3886
Brain cortical changes are related to SARS-CoV-2 inflammatory biomarkers in hospitalized patients with neurological manifestations1Department of Medicine and Biomedical Engineering, Translational Imaging in Neurology (ThINK), University Hospital Basel and University of Basel, Basel, Switzerland, 2Department of Biomedicine, University Hospital Basel and University of Basel, Basel, Switzerland, 3Division of Neurosurgery, University Hospital Basel, Basel, Switzerland, 4Neurologic Clinic and Policlinic, MS Center and Research Center for Clinical Neuroimmunology and Neuroscience Basel (RC2NB), University Hospital Basel and University of Basel, Basel, Switzerland, 5Department of Neuroradiology, Clinic of Radiology and Nuclear Medicine, University Hospital Basel, Basel, Switzerland
Synopsis
A quantitative imaging study is critical to detect cortical brain macrostructural alterations associated with an inflammatory response in hospitalized SARS-CoV-2 patients. Using automated processing of the 3D high-resolution T1-weighted anatomical images, we found a decrease of cortical gray matter volume and thickness, but not in the surface area related to increased levels in CSF protein, CSF blood/albumin ratio, and CSF EN-RAGE. The anatomical localization of these regions may be the in vivo hallmarks of the virus effect on the brain cortex due to a hyperinflammatory response and associated with neurological deficits presented in acute and post-Covid phases.
Introduction
Increasing evidence shows that the brain is a target of SARS-CoV-2 1,2,3,4. Following the penetration of the virus into the central nervous system (CNS), a hyperinflammatory reaction occurs that provoke neurological deficits (Neuro-Covid), leading to functional impairment and death5,6. However, the structural consequences of SARS-CoV-2 penetration in the CNS of severely ill patients, where neurological complications are observed in 80% of the cases7, are currently unknown. Most brain imaging studies published to date focused on the mild8,9 or post-Covid10,11 phases. No studies investigated the effect of SARS-CoV-2-related inflammatory processes on the brain cortical macrostructure using multiple morphometric descriptors.Purpose:
-To identify brain cortical gray matter volume, thickness, and surface-area changes associated with an acute inflammatory response in SARS-CoV-2 hospitalized patients suffering from Neuro-Covid.
Methods
In the frame of the Neuro-Covid trial (clinicaltrials.gov ID NCT04472013), we enrolled 35 SARS-CoV-2 patients and 36 healthy age and gender-matched subjects that underwent 3D high-resolution T1-weighted anatomical imaging at Basel University Hospital, Switzerland.MRI was acquired using two MRI-scanners: Scanner 1: 1.5T Siemens-Avanto-Fit and Scanner 2: 3T Siemens-Skyra. A MPRAGE pulse sequence was used with the following parameters: Scanner-1: 160 slices in sagittal orientation; in-plane FOV= 256×256mm2, and matrix size 256×256, voxel size of 1×1×1mm3. The echo (TE), repetition (TR), and inversion (TI) times were TE/TR/TI=2.8ms/2400ms/900ms, flip angle FA=8°. Scanner-2: 160 slices in sagittal orientation; in-plane FOV= 256×240 mm2, matrix size 256×240, voxel size 1×1×1mm3. The echo, repetition, and inversion times were TE/TR/TI= 2.98ms/2300ms/900ms, flip angle FA=9°.
SARS-CoV-2 patients were neurologically evaluated, and subjected to extensive cerebro-spinal-fluid (CSF) and plasma analysis. In the CSF, we assessed leukocytes, lactate, protein levels, and CSF-blood/albumin ratio. Additionally, the quantification of 184 secreted proteins, including cytokines, chemokines, and soluble cell membrane proteins were measured by multiplexed proximity extension technology using the Olink neurology and inflammation panels (www.olink.com) assay, which included EN-RAGE (extracellular receptor for advanced glycation end-products binding protein). Groups characteristics are presented in Table 1.
Cortical reconstruction and volumetric segmentation were performed with FreeSurfer (FS) 5.0 image analysis suite (http://surfer.nmr.mgh.harvard.edu/) 12,13,14. In this study, we selected the Desikan-Killiany atlas15 (34 areas per hemisphere), for which the cortical volume(mm3), surface-area(mm2), and thickness(mm) were assessed.
Clinical and demographic variables were compared between groups with an independent t-test, Mann-Whitney tests, or Chi-square tests as appropriate. Cortical volumes, surface-area, and thickness were compared between groups using a linear regression model. The covariates were age, gender, age*gender, MRI magnetic field strength, and total intracranial volume (TIV)/mean cortical thickness (Th)/Total surface-area. P-values were adjusted for multiple comparisons using False Discovery Rate (FDR). The association between cortical features and laboratory variables was assessed using partial correlation adjusting for age, gender, age*gender interaction, MRI magnetic field strength, and TIV/mean Th/Total surface-area. We adjusted for multiple comparisons using FDR. The statistical analysis was performed using the JASP software (https://jasp-stats.org/). We used MATLAB software for the partial correlation analysis (‘partialcorri.m’) (https://www.mathworks.com/).
Results
Demographic and neuropsychological variables: There were no significant differences between groups in age, gender, and global brain variables except for white matter normalized (Table 1).Groups differences in cortical volume, thickness, and surface-area: Only the right rostral anterior cingulate cortex volume was statistically significantly decreased after the FDR correction (mean: control =1.87, patients=1.63; p=0.01).
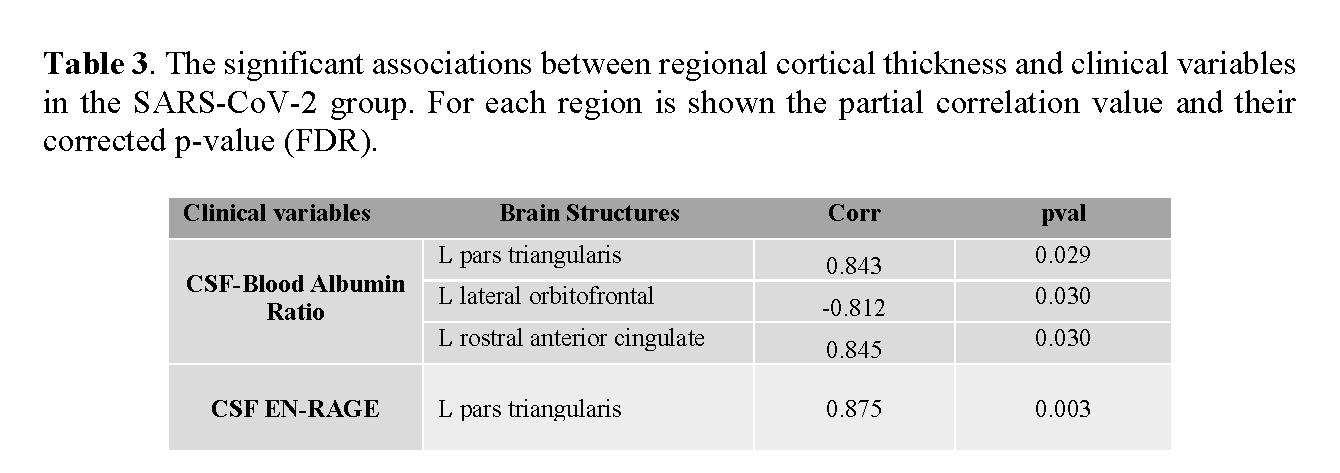
Association between brain cortical morphometric features and laboratory variables in SARS-CoV-2 patients: Figure 1 shows 31 significant correlations between cortical volumes and laboratory variables (FDR corrected). Increased CSF protein, CSF blood/albumin ratio, and CSF EN-RAGE levels were associated with a decrease in regional volumes (Table 2). Cortical thickness in frontal and orbitofrontal cortex showed significant associations with the CSF blood/albumin Ratio and EN-RAGE (FDR corrected) (Figure 2, Table 3)
Discussion
In this cohort of patients, we did not observe any differences in brain cortical macrostructure between critically ill SARS-CoV-2 patients and age and gender-matched healthy subjects. However, in SARS-CoV-2 patients, there was a significant association between (i) a decreased cortical volume and thickness in frontal, fronto-orbital, temporal, and parietal cortical regions and (ii) increased CSF protein, CSF blood/albumin ratio, and CSF EN-RAGE levels. Increased CSF protein levels are commonly found in inflammatory conditions and have been used in the acute phase of SARS-CoV-2 infection to indicate an inflammatory response and axonal injury16. Also, EN-RAGE is a cytokine previously associated with inflammatory responses in atherosclerotic plaques17, but so far unidentified in SARS-CoV-2 patients. Our data suggest that viral-triggered inflammation leads to increased neurotoxic damage in some cortical areas, although our results do not show a significant decrease in cortical volume and thickness in the acute phase of the disease. Interestingly, the regions associated with the inflammatory biomarkers in this study are part of brain circuits responsible for cognitive processes affected in post-Covid patients, such as memory, attention, emotion, and motivation18,19. Future work should be devoted to establishing whether there are long-term structural changes in the cortex of SARS-CoV-2 patients, who have been critically ill.Acknowledgements
No acknowledgement found.References
1. Bougakov D, Podell K, Goldberg E. Multiple Neuroinvasive Pathways in COVID-19. Mol Neurobiol. 2021;58(2):1. doi:10.1007/S12035-020-02152-5
2. Katal S, Gholamrezanezhad A. Neuroimaging findings in COVID-19: A narrative review. Neurosci Lett. 2021;742:135529. doi:10.1016/j.neulet.2020.135529
3. Tassorelli C, Mojoli F, Baldanti F, et al. First ultrastructural autoptic findings of SARS -Cov-2 in olfactory pathways and brainstem. Minerva Anestesiol. 2020;86(6):678-679. doi:10.23736/S0375-9393.20.14772-2
4. Dey J, Alam MT, Chandra S, et al. Neuroinvasion of SARS-CoV-2 may play a role in the breakdown of the respiratory center of the brain. J Med Virol. 2021;93(3):1296-1303. doi:10.1002/JMV.26521
5. Sims JT, Krishnan V, Chang CY, et al. Characterization of the cytokine storm reflects hyperinflammatory endothelial dysfunction in COVID-19. J Allergy Clin Immunol. 2021;147(1):107-111. doi:10.1016/J.JACI.2020.08.031
6. Buszko M, Nita-Lazar A, Park JH, et al. Lessons learned: new insights on the role of cytokines in COVID-19. Nat Immunol 2021 224. 2021;22(4):404-411. doi:10.1038/s41590-021-00901-9
7. Chou SH-Y, Beghi E, Helbok R, et al. Global Incidence of Neurological Manifestations Among Patients Hospitalized With COVID-19—A Report for the GCS-NeuroCOVID Consortium and the ENERGY Consortium. JAMA Netw Open. 2021;4(5):e2112131-e2112131. doi:10.1001/JAMANETWORKOPEN.2021.12131
8. Crunfli F, Carregari VC, Veras FP, et al. SARS-CoV-2 infects brain astrocytes of COVID-19 patients and impairs neuronal viability. medRxiv. Published online July 7, 2021:2020.10.09.20207464. doi:10.1101/2020.10.09.20207464
9. Duan K, Premi E, Pilotto A, et al. Alterations of frontal-temporal gray matter volume associate with clinical measures of older adults with COVID-19. Neurobiol Stress. 2021;14:100326. doi:10.1016/J.YNSTR.2021.100326
10. Douaud G, Lee S, Alfaro-Almagro F, et al. Brain imaging before and after COVID-19 in UK Biobank. medRxiv. Published online June 20, 2021. doi:10.1101/2021.06.11.21258690
11. Lu Y, Li X, Geng D, et al. Cerebral Micro-Structural Changes in COVID-19 Patients – An MRI-based 3-month Follow-up Study. EClinicalMedicine. 2020;25. doi:10.1016/J.ECLINM.2020.100484
12. Dale AM, Fischl B, Sereno MI. Cortical Surface-Based Analysis: I. Segmentation and Surface Reconstruction. Neuroimage. 1999;9(2):179-194. doi:10.1006/NIMG.1998.0395
13. Fischl B, Sereno MI, Dale AM. Cortical Surface-Based Analysis: II: Inflation, Flattening, and a Surface-Based Coordinate System. Neuroimage. 1999;9(2):195-207. doi:10.1006/NIMG.1998.0396
14. Fischl B, Dale AM. Measuring the thickness of the human cerebral cortex from magnetic resonance images. Proc Natl Acad Sci U S A. 2000;97(20):11050-11055. doi:10.1073/pnas.200033797
15. Desikan RS, Segonne F, Fischl B, et al. An automated labeling system for subdividing the human cerebral cortex on MRI scans into gyral based regions of interest. Neuroimage. 2006;31(3):968-980. doi:10.1016/j.neuroimage.2006.01.021
16. Tandon M, Kataria S, Patel J, et al. A Comprehensive Systematic Review of CSF analysis that defines Neurological Manifestations of COVID-19. Int J Infect Dis. 2021;104:390-397. doi:10.1016/J.IJID.2021.01.002
17. Ligthart S, Sedaghat S, Arfan Ikram M, Hofman A, Franco OH, Dehghan A. A novel inflammatory marker for incident coronary heart disease. Arterioscler Thromb Vasc Biol. 2014;34(12):2695-2699. doi:10.1161/ATVBAHA.114.304306/FORMAT/EPUB
18. Becker JH, Lin JJ, Doernberg M, et al. Assessment of Cognitive Function in Patients After COVID-19 Infection. JAMA Netw Open. 2021;4(10):e2130645-e2130645. doi:10.1001/JAMANETWORKOPEN.2021.30645
19. Daroische R, Hemminghyth MS, Eilertsen TH, Breitve MH, Chwiszczuk LJ. Cognitive Impairment After COVID-19—A Review on Objective Test Data. Front Neurol. 2021;12:1238. doi:10.3389/FNEUR.2021.699582/BIBTEX
Figures
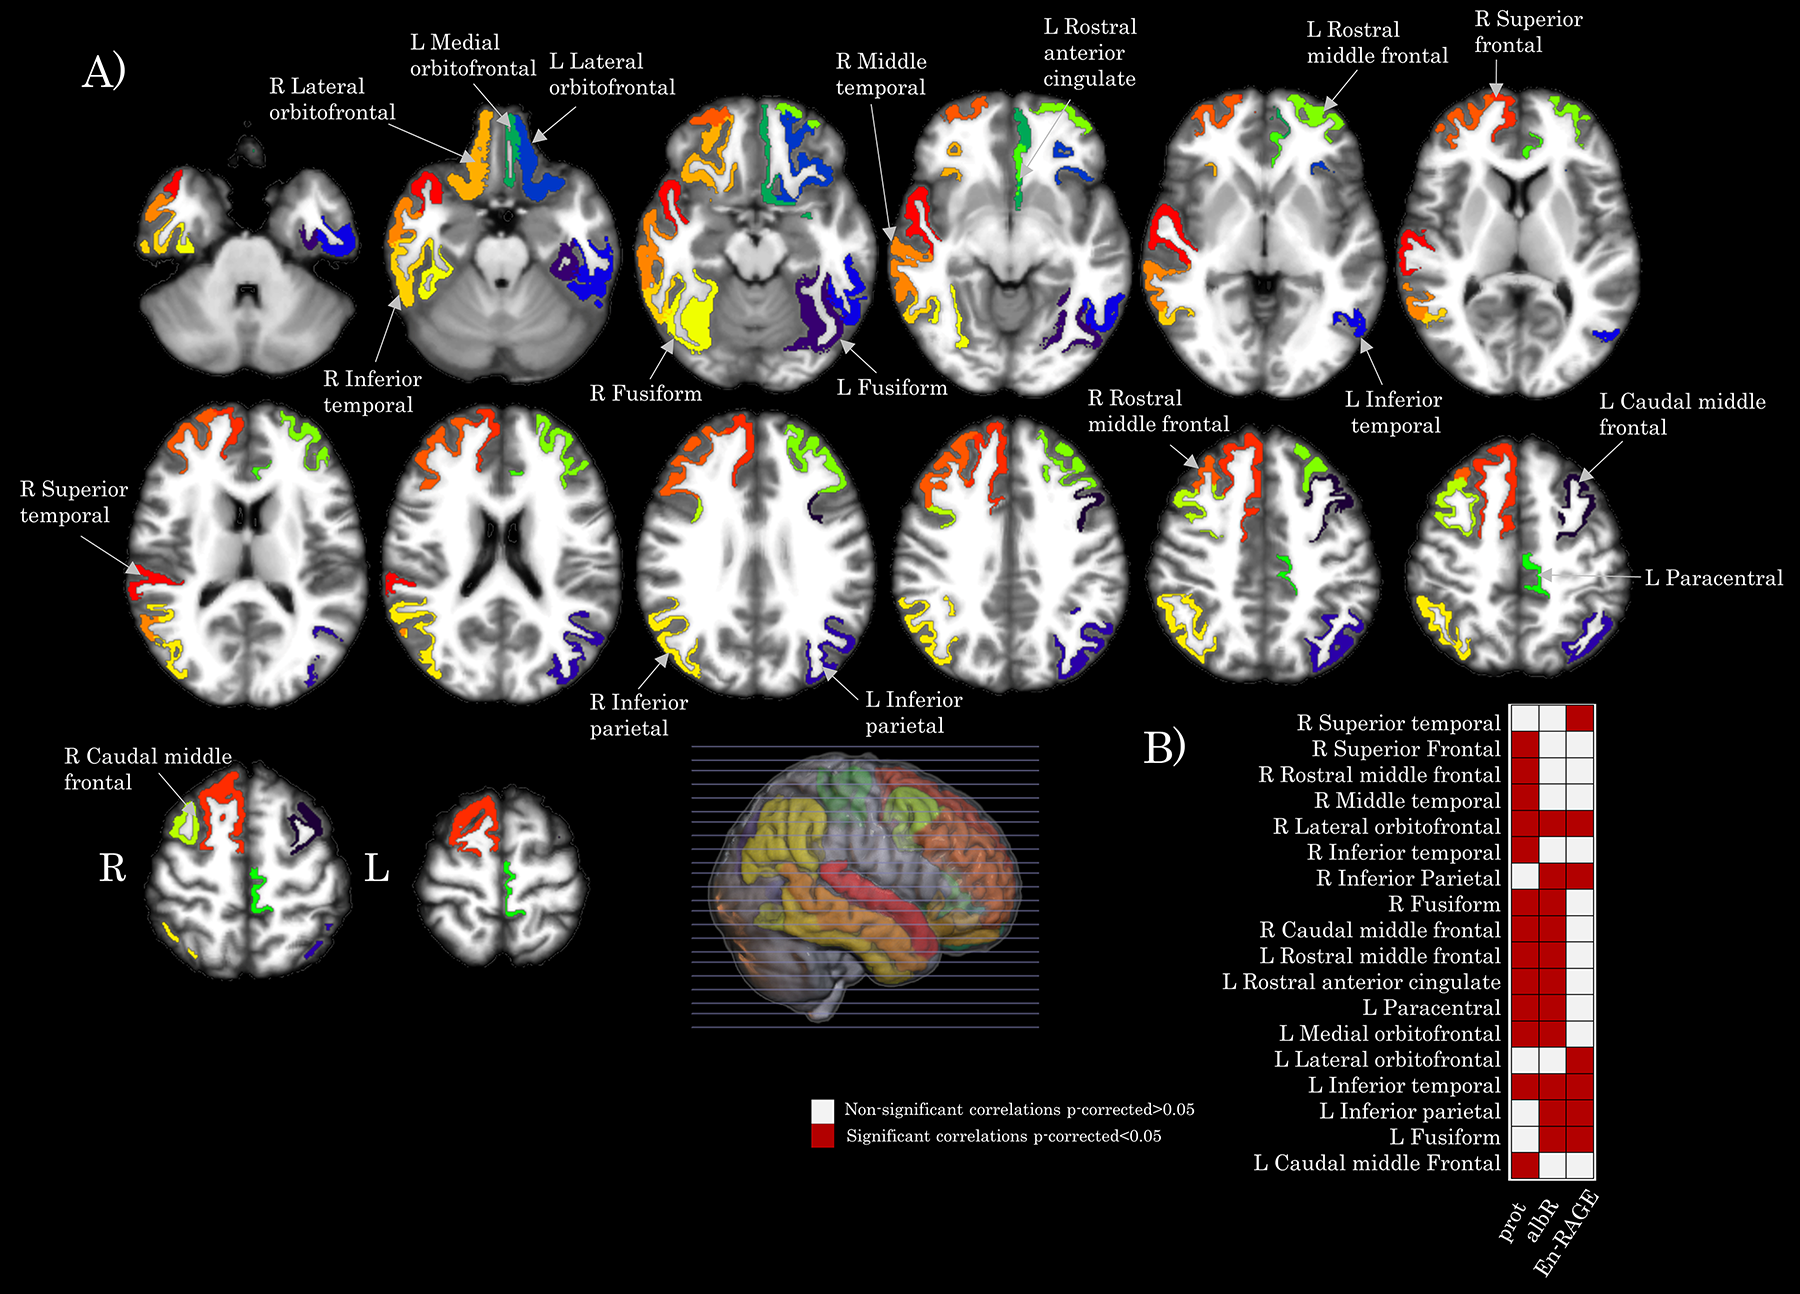
Figure 1. Map of the brain regions with a significant association between gray matter volume and clinical variables (albR: Albumin CSF-blood ratio, EN-RAGE: extracellular receptor for advanced glycation end-products binding protein) in the SARS-CoV-2 group. Panel A) shows the 31 brain regions (in axial oriented slices) with significant correlation values after FDR correction. Panel B) shows a matrix representing the association significance (significant p-corrected<0.05 in red squares). Legend: CSF: Cerebrospinal fluid, R: right, L: left.
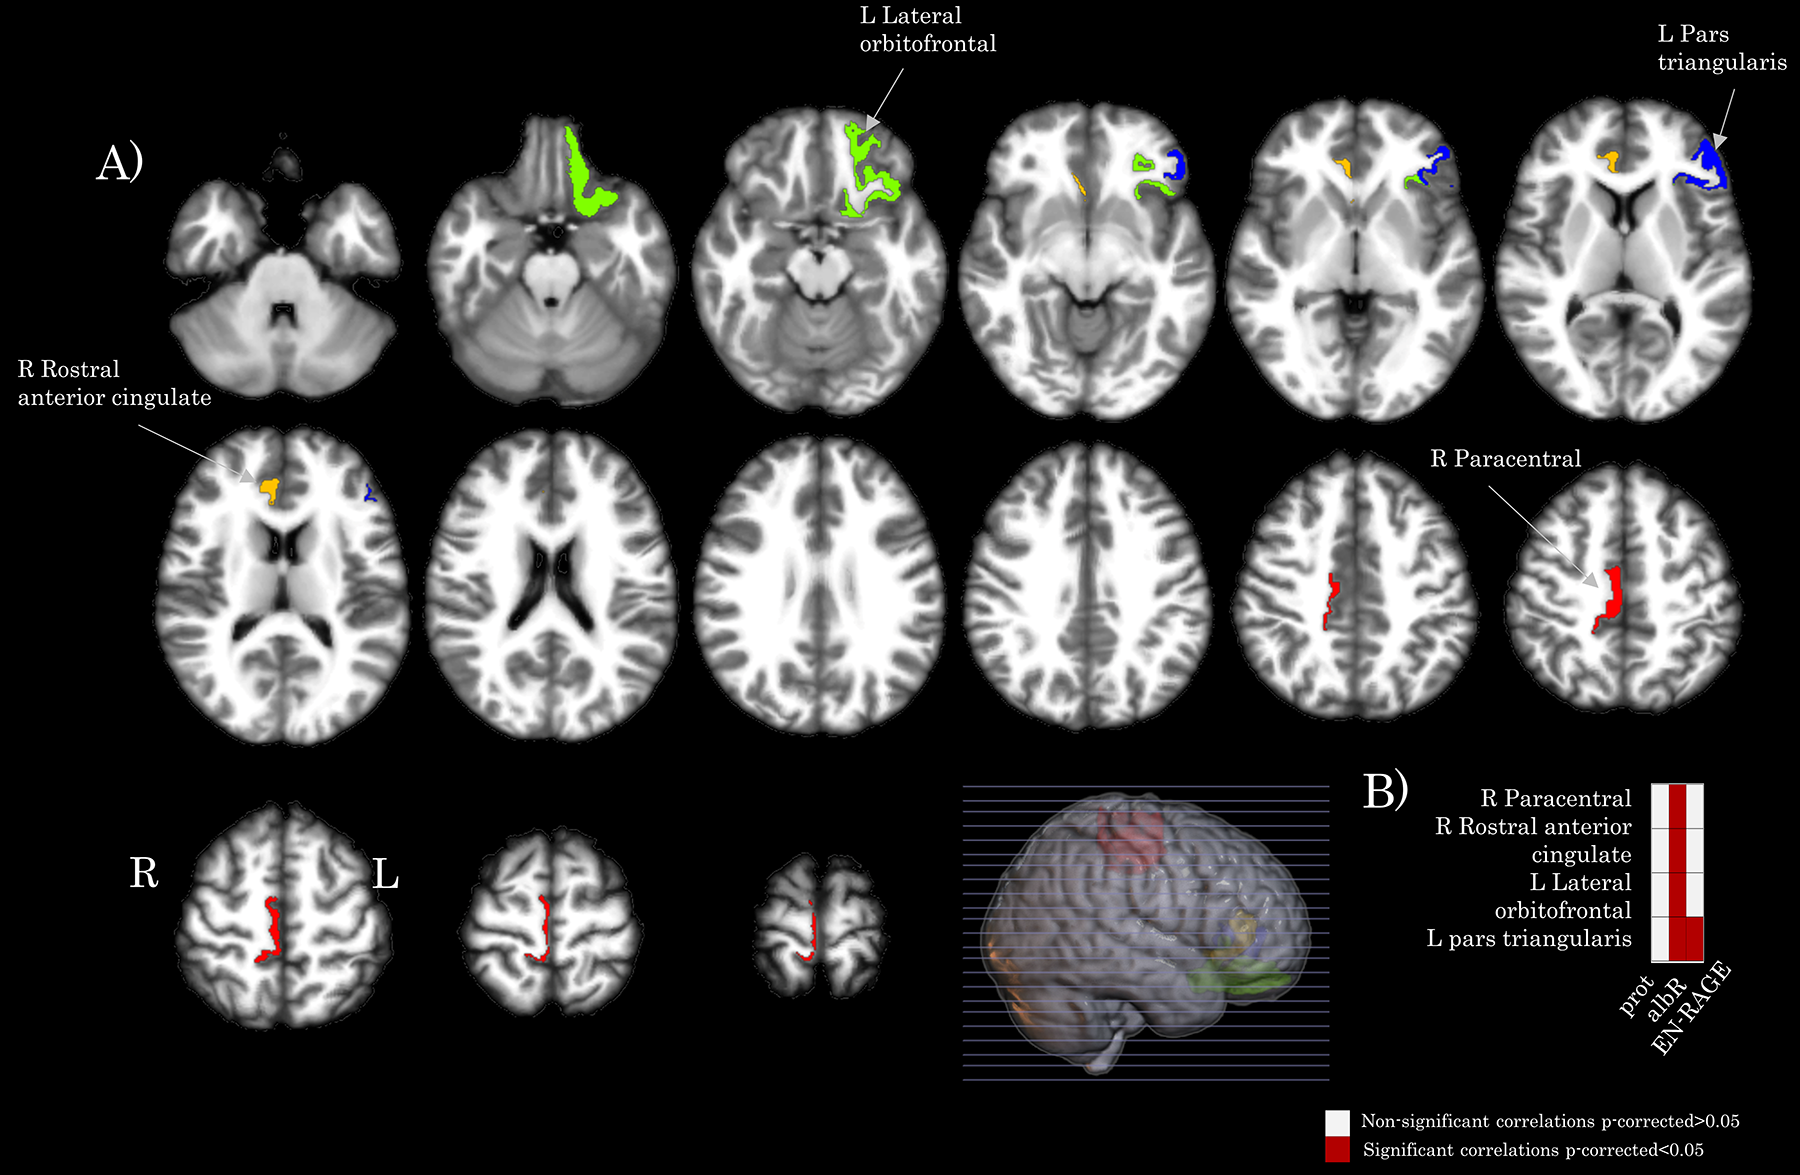
Figure 2. Map of the brain regions with a significant association between cortical thickness and clinical variables (albR: Albumin CSF-blood ratio, EN-RAGE in the SARS-CoV-2 group. Panel A) shows the 4 brain regions (in axial oriented slices) with significant correlation values FDR correction. Panel B) shows a matrix representing the association significance (significant p-corrected<0.05 in red squares). Legend: CSF: Cerebrospinal fluid, R: right, L: left.
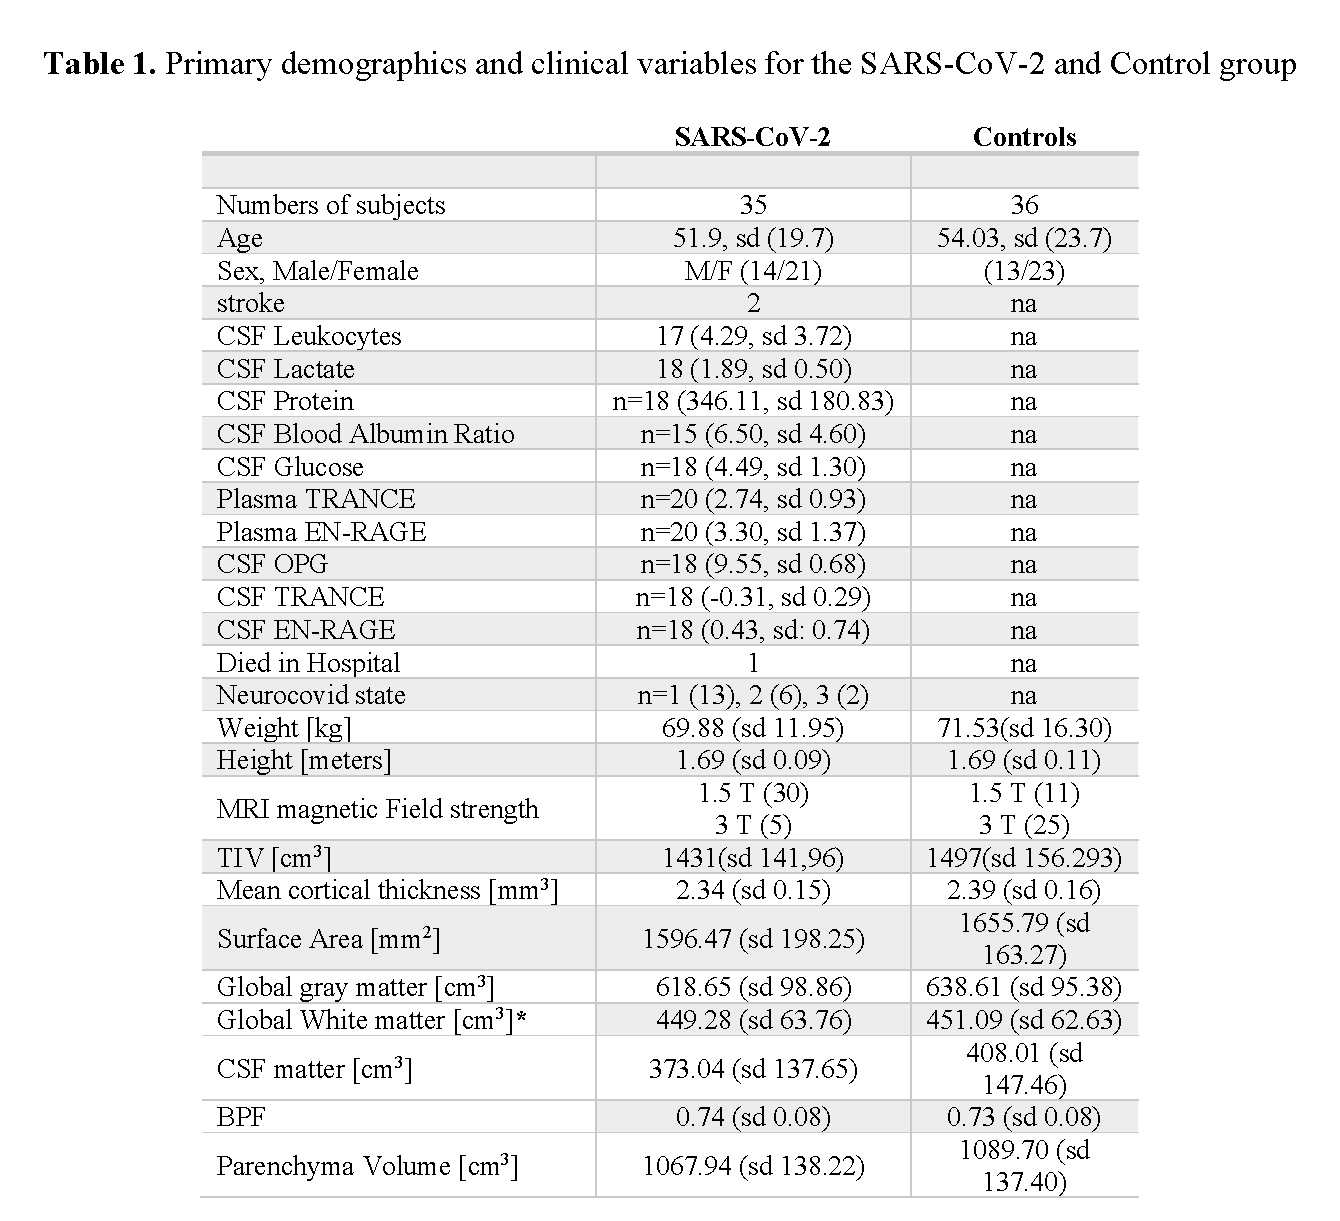
Legend: T-test for independent by the group was used when the variable was normally distributed (Shapiro-Wilk P < 0.05). Non-parametric Mann-Whitney U-test was applied whenever a variable for each group was not normally distributed; chi-square test for sex. Mean and standard deviation are shown for all variables except the categorical ones: sex, stroke, died in the hospital, Neurocovid state and MRI magnetic Field strength. sd: standard deviation, CSF: Cerebrospinal fluid, TIV: Total Intracranial Volume, BPF: brain parenchymal fraction, na: not applicable. *p<0.05.
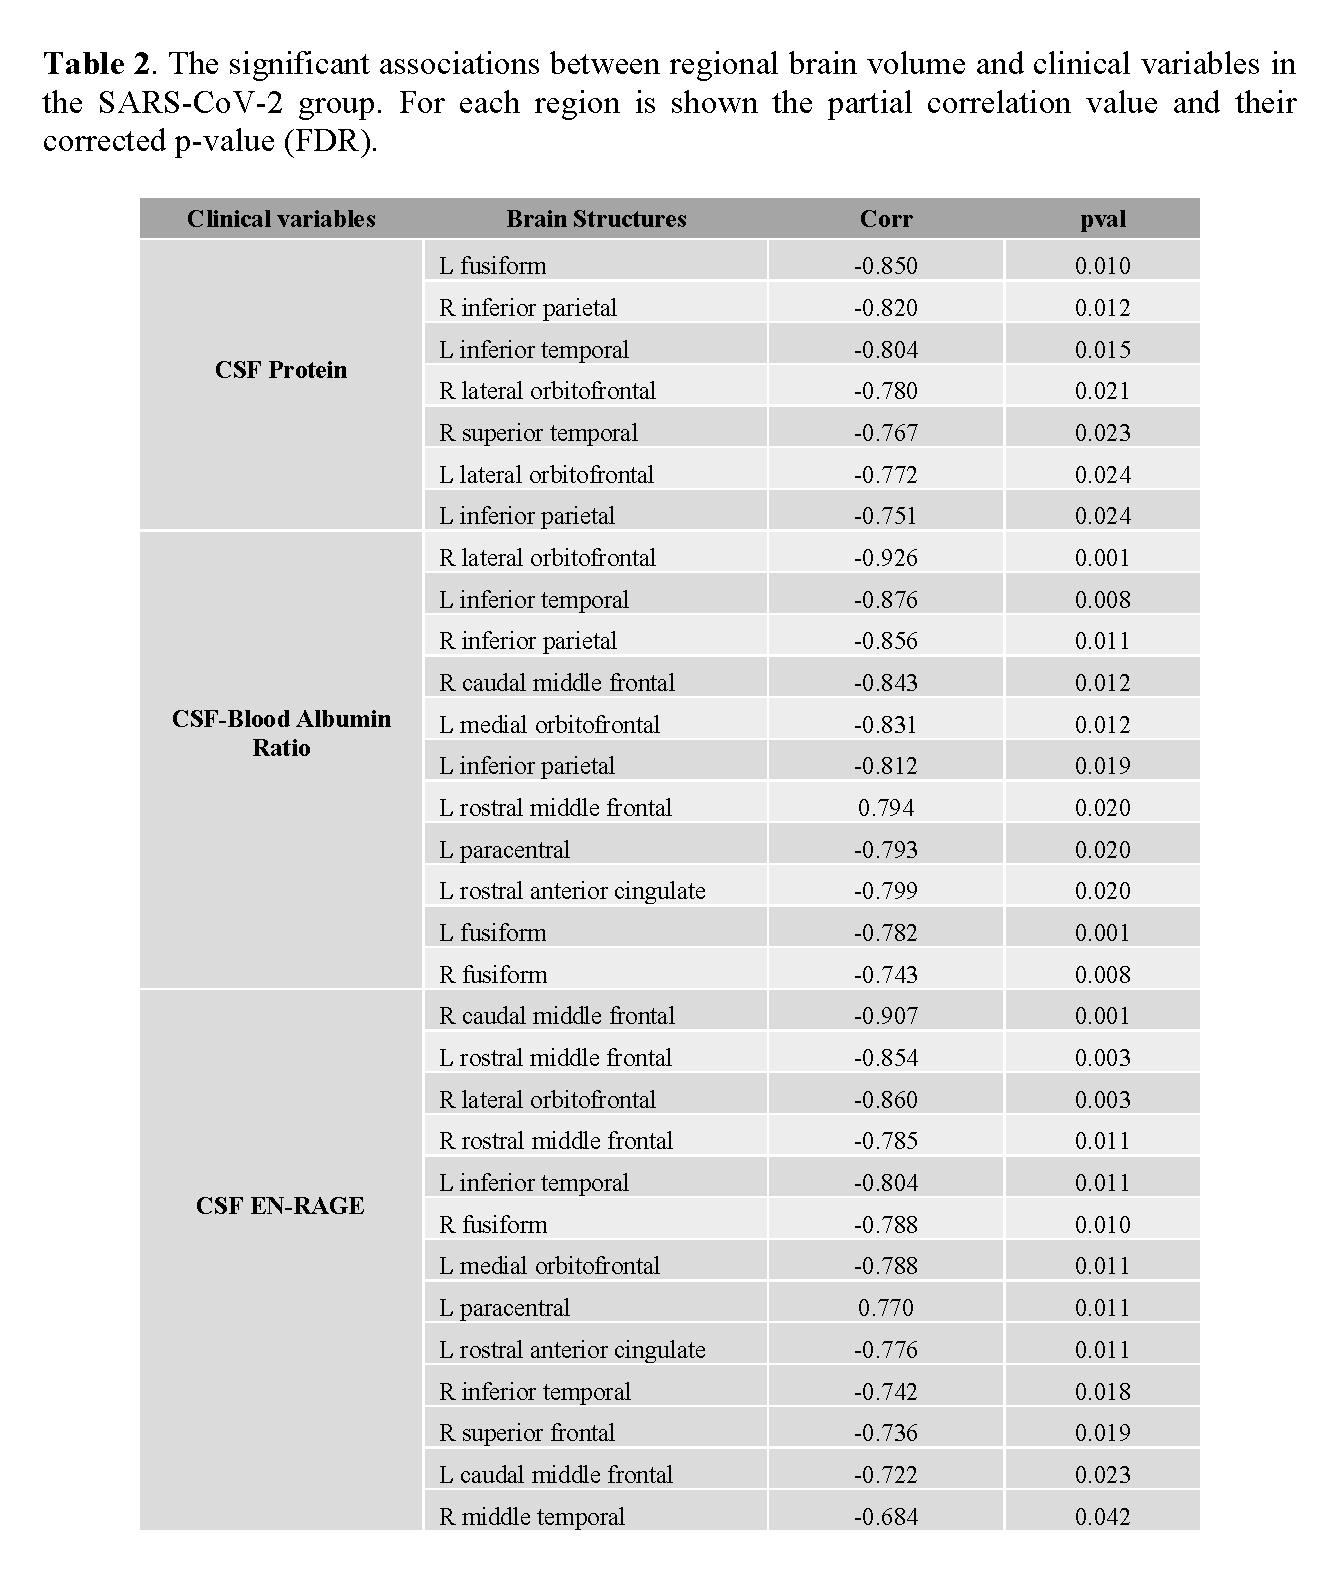
Legend: CSF: Cerebrospinal fluid; EN-RAGE: extracellular receptor for advanced glycation end-products binding protein; pval: p values corrected by FDR; Corr: correlation. L: left hemisphere; R: right hemisphere.