3885
Reduced white matter venous density is associated with neurodegeneration and cognitive impairment: a susceptibility weighted imaging study1Department of Radiology, NYU Grossman School of Medicine, New York, NY, United States, 2Department of Neurology, NYU Grossman School of Medicine, New York, NY, United States, 3Department of Radiology, Wayne State University School of Medicine, Detroit, MI, United States
Synopsis
High resolution SWI images provide unique contrast to small venous vasculature. The conspicuity of small veins on SWI venography, such as deep medullary vein in white matter (WM), is susceptible to venous blood oxygenation level changes. This study demonstrates a significant association between WM venous density and neurodegenerative feature characterized by brain atrophy in the elderly, but no significant association of WM venous density to white matter hyperintensities (WMHs) load. Further clinical correlative analysis revealed a significant correlation of WM venous density to semantic fluency and different stages of cognitive status.
Introduction
Susceptibility-weighted imaging (SWI) is an emerging clinical imaging sequence for the examination of venous vasculature, using paramagnetic deoxygenated hemoglobin as intrinsic T2* contrast agent(1,2). SWI provides rich information not only on anatomy of venous vasculature, but also, albeit indirect, on oxygen utilization of the brain through venous blood contrast on SWI venography(3). When brain metabolism is reduced, unconsumed arterialized blood will drain directly to the veins, elevating the level of diamagnetic oxygenated hemoglobin in the veins. As a consequence of this altered T2* dephasing between veins and surrounding tissue(4), the visibility of these small veins are more susceptible to diminish or enhance from the SWI image. Therefore, we hypothesized that the conspicuity of venous appearance on SWI, particularly small veins in white matter, could be used as a sensitive marker for characterizing regional status of local tissue oxygen metabolism(5-8). In this study, we quantitatively assess the visibility of the small venous appearance on SWI using WM venous density and examine the relationship of WM venous density to both neurodegenerative changes and WM hyperintensities (WMHs) related to small vessel disease in aging brains.Methods
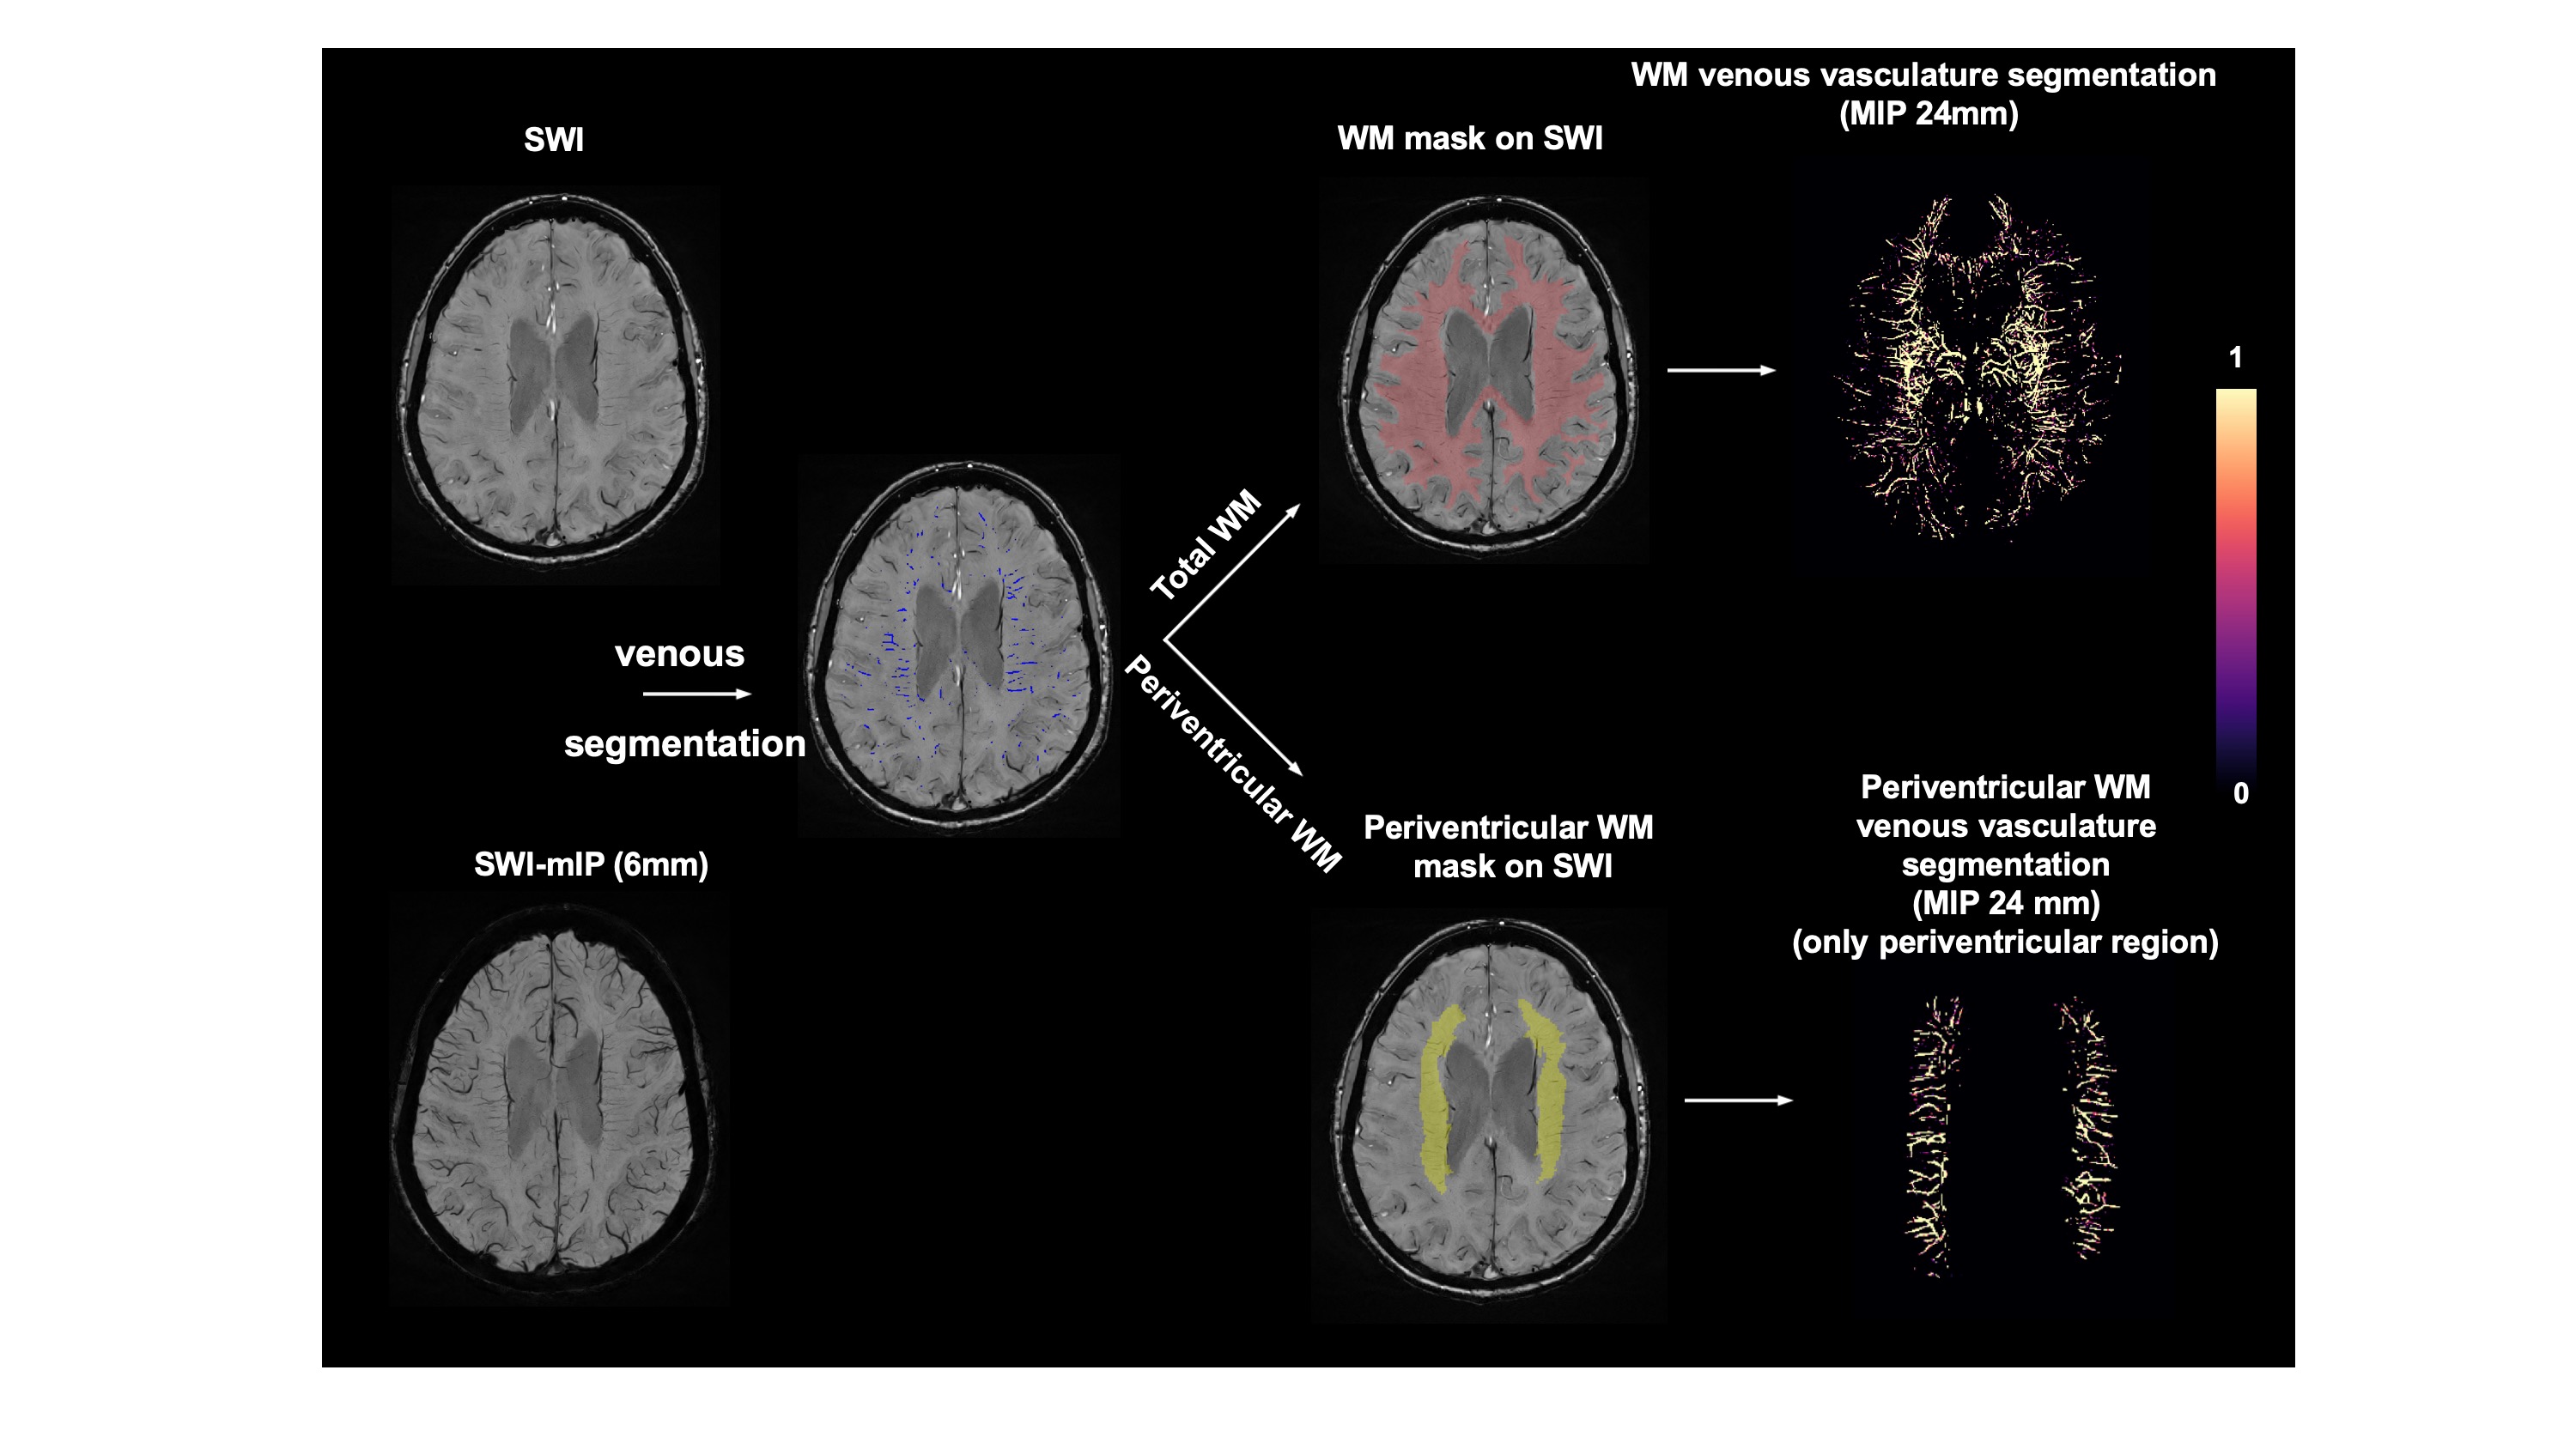
Consecutive baseline MRI of 137 elderly participants from New York University Alzheimer’s Disease Research Center (NYU-ADRC) has been examined. All subjects underwent a detailed diagnostic and psychological assessment including sum of the Clinical Dementia Rating (CDR-sum)(9) and one minute animal test (OMAT)(10). All subjects were scanned on a 3 Tesla (3T) MRI system (Siemens Prisma) using a 64-channel head coil under a clinical MRI protocol that includes: T1-MPRAGE (TE/TR: 5ms/2100ms; matrix size: 176*256*256; voxel size: 1mm isotropic), T2-FLAIR (TE/TR: 75ms/9000ms; matrix size: 320*320*42; voxel size: 0.6875mm*0.6875mm*4mm) and SWI sequence (TE/TR: 25ms/50ms; matrix size: 512*512*32; voxel size: 0.4297mm*0.4297mm*1.5mm). Brain parenchymal fraction (BPF) and gray matter fraction (GMF) are calculated as the volumetric measures of brain atrophy based on brain segmentation using SPM12. SWI images were preprocessed with bias field correction and de-noise using ANTs. Venous vasculature segmentation on SWI was performed using a novel vascular segmentation toolbox developed by Bernier et al(11). The periventricular white matter density was calculated using the same approach as white matter venous density after segmentation of periventricular region(Pv). The flowchart of image processing pipeline is illustrated in Figure 1.Results
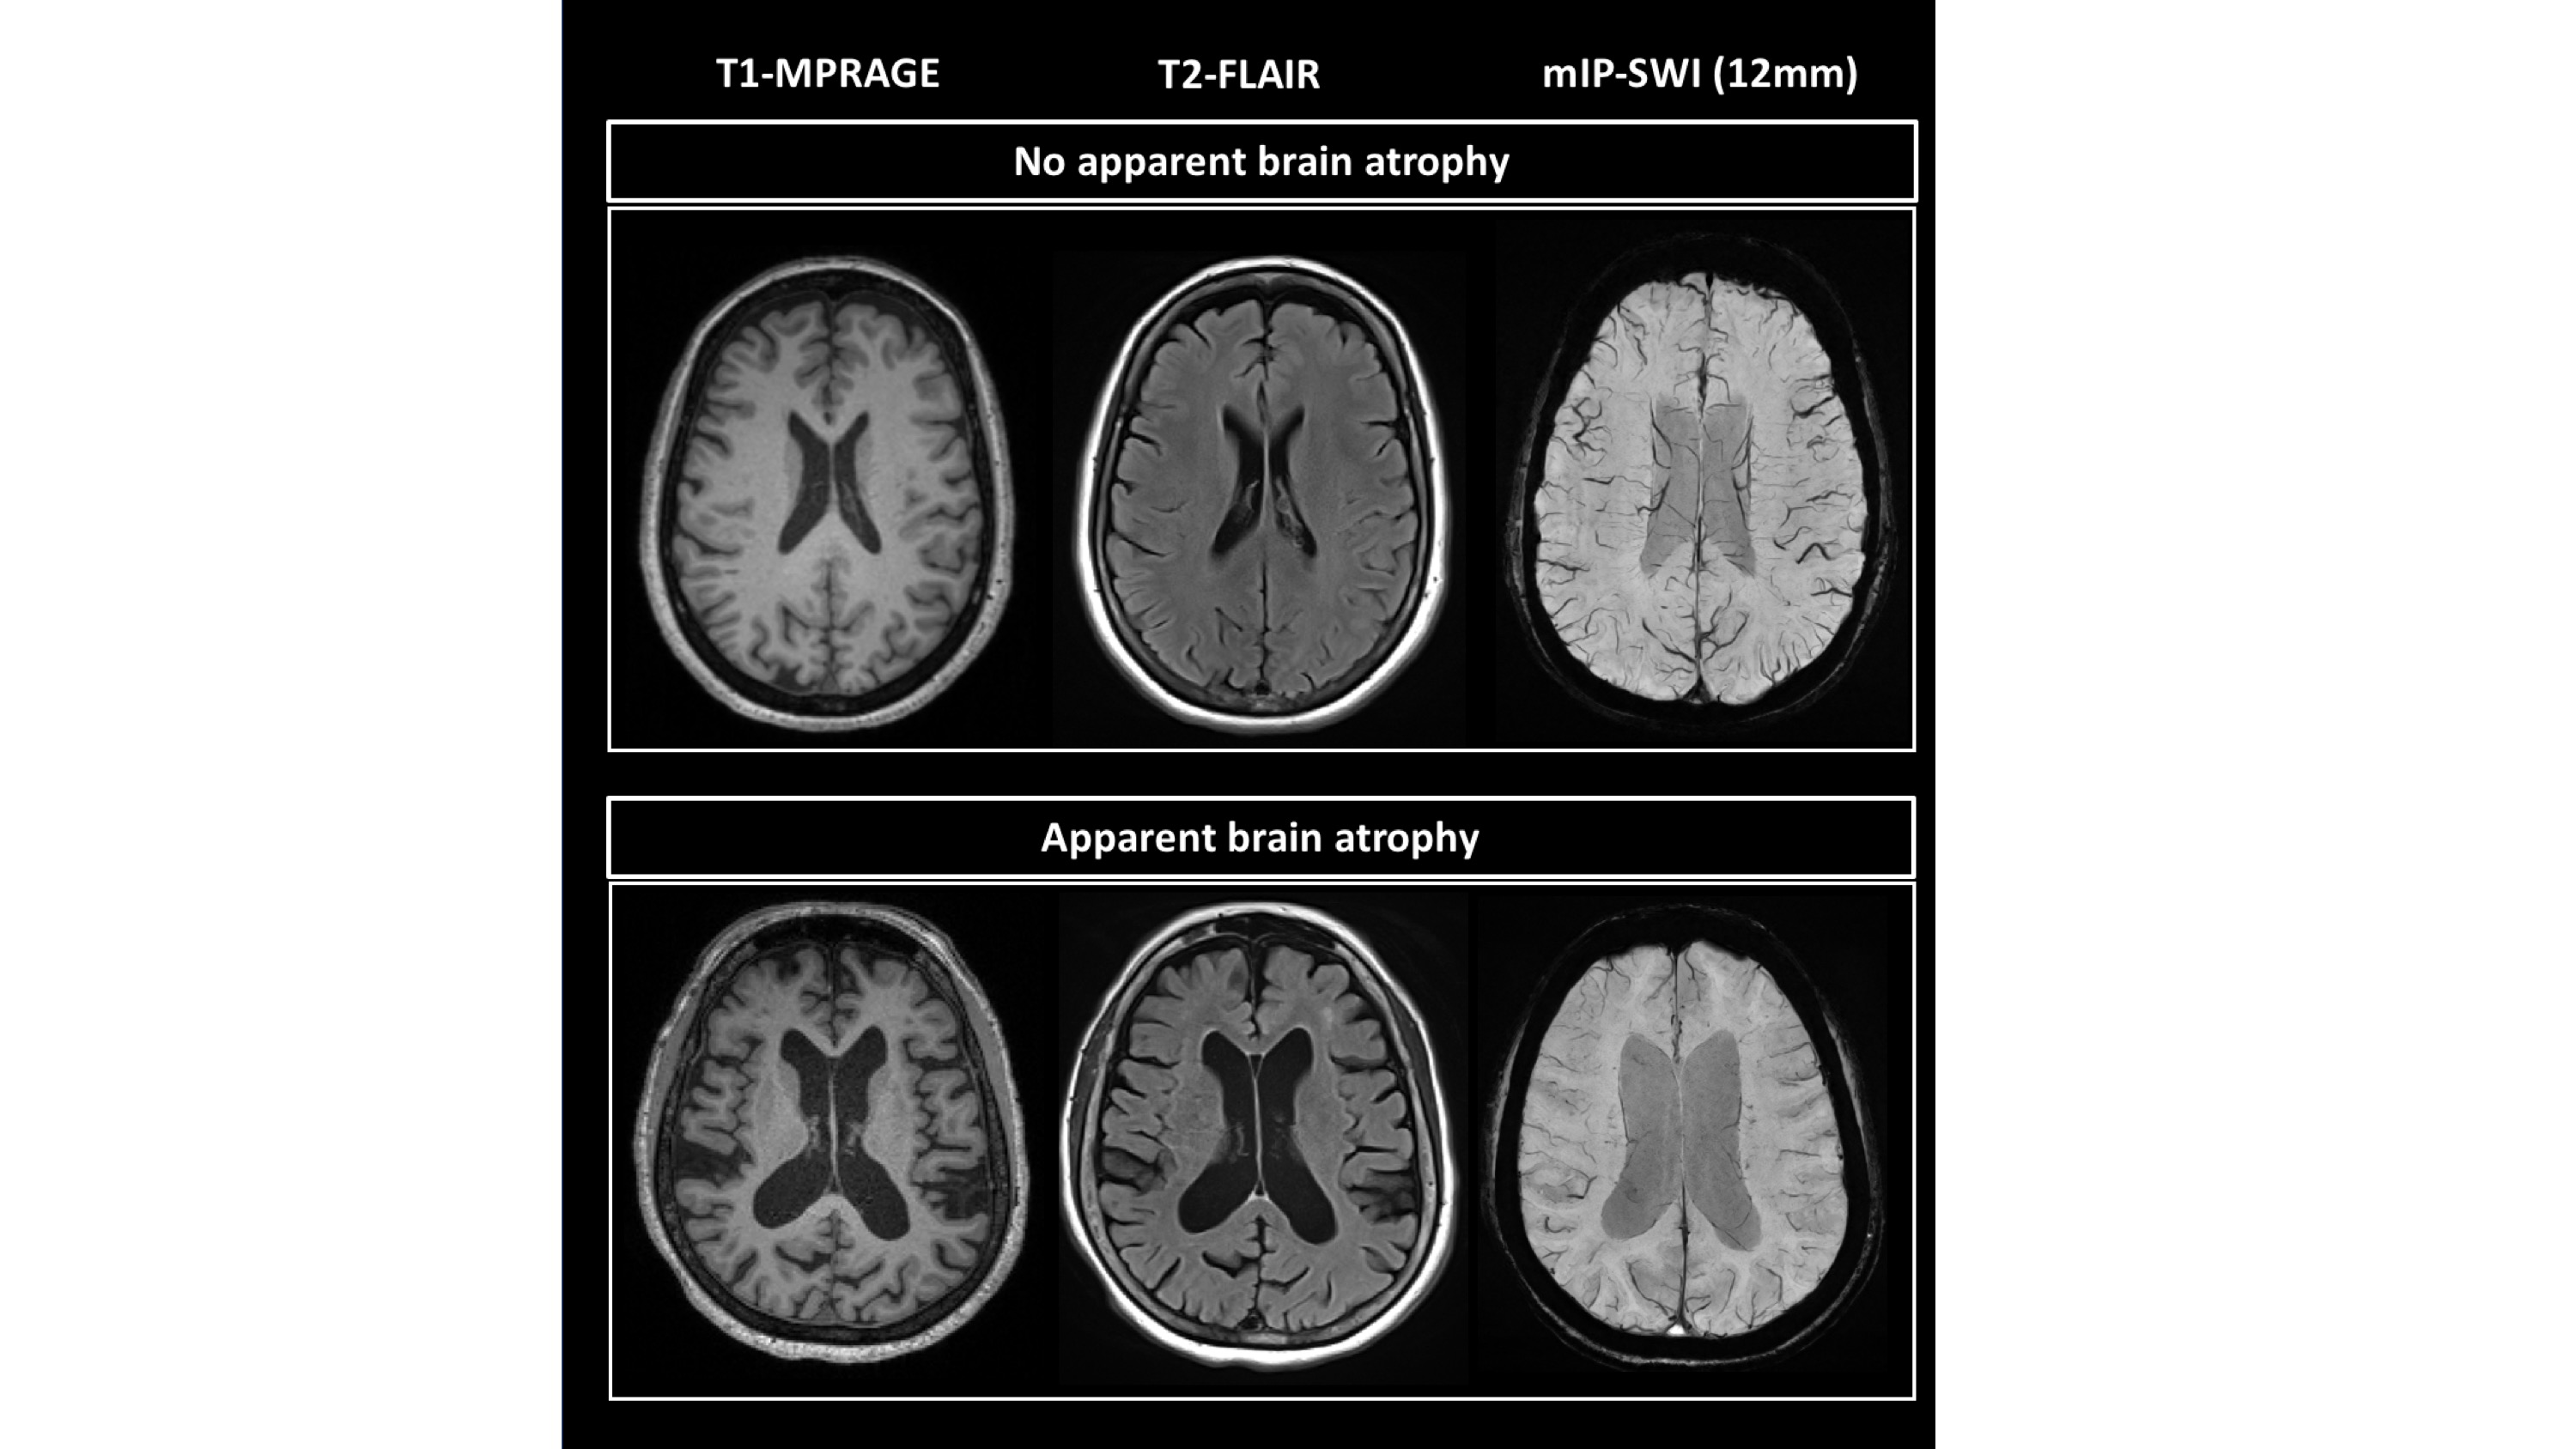
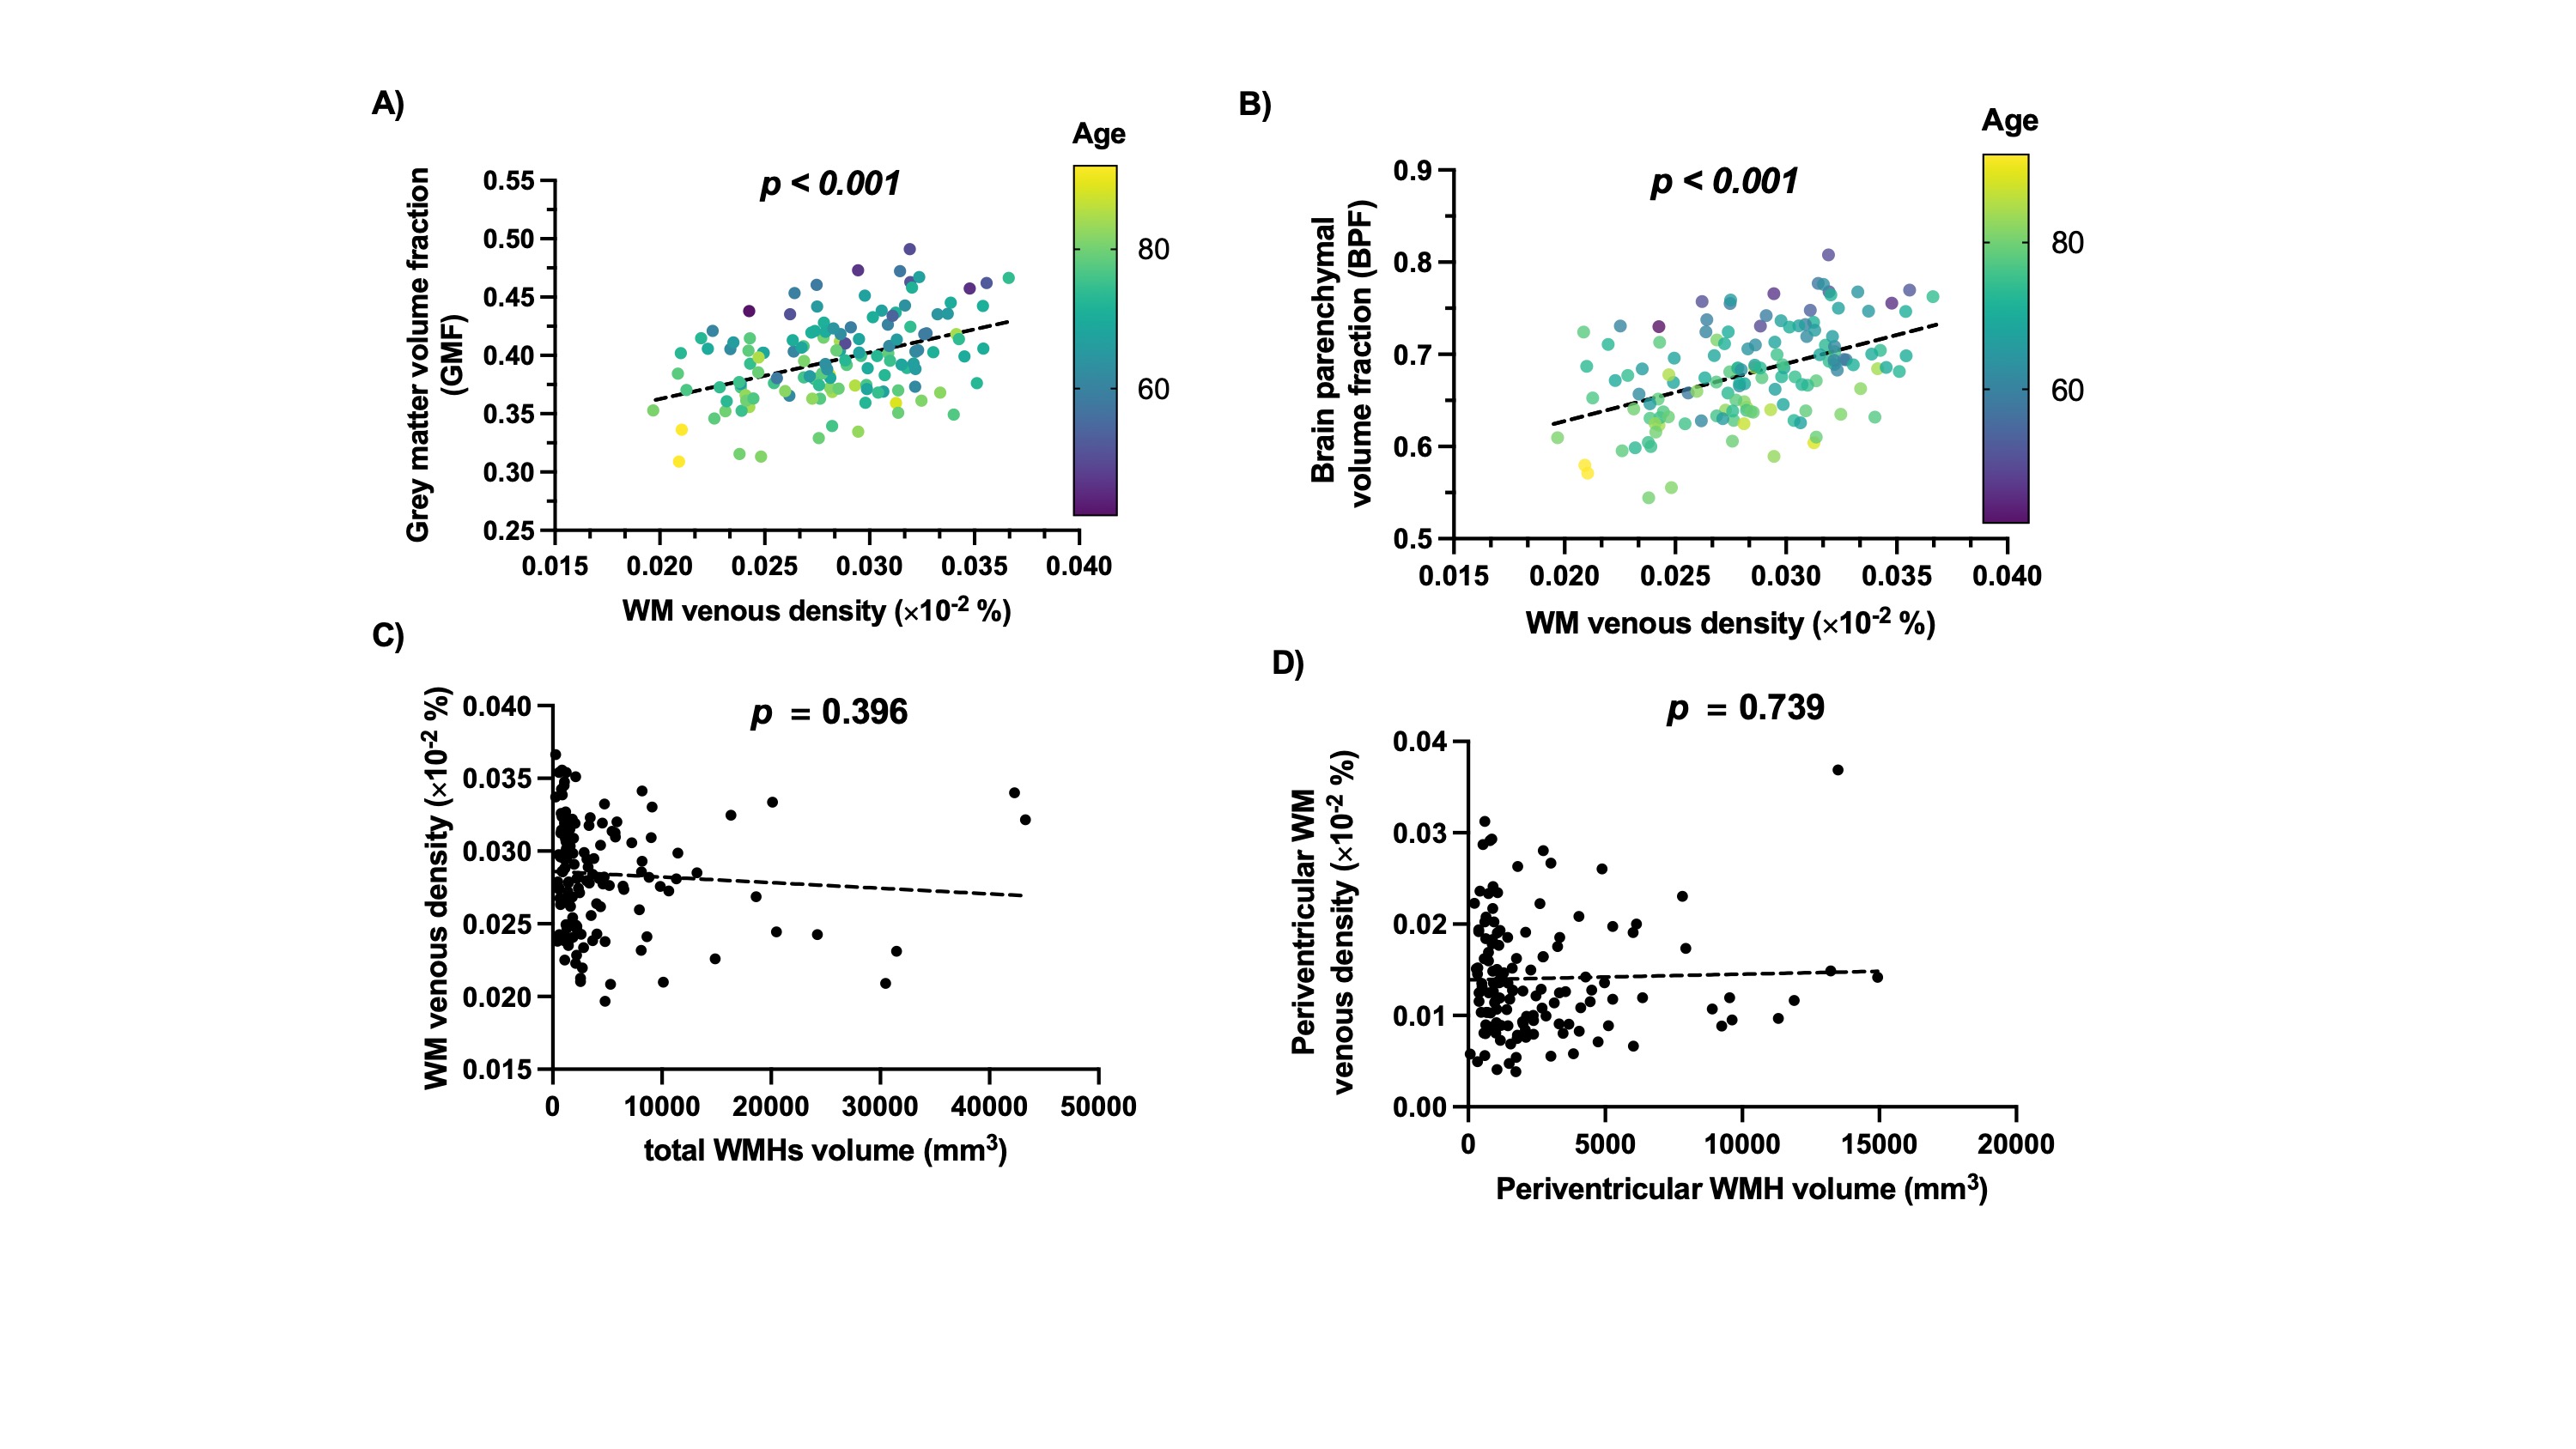
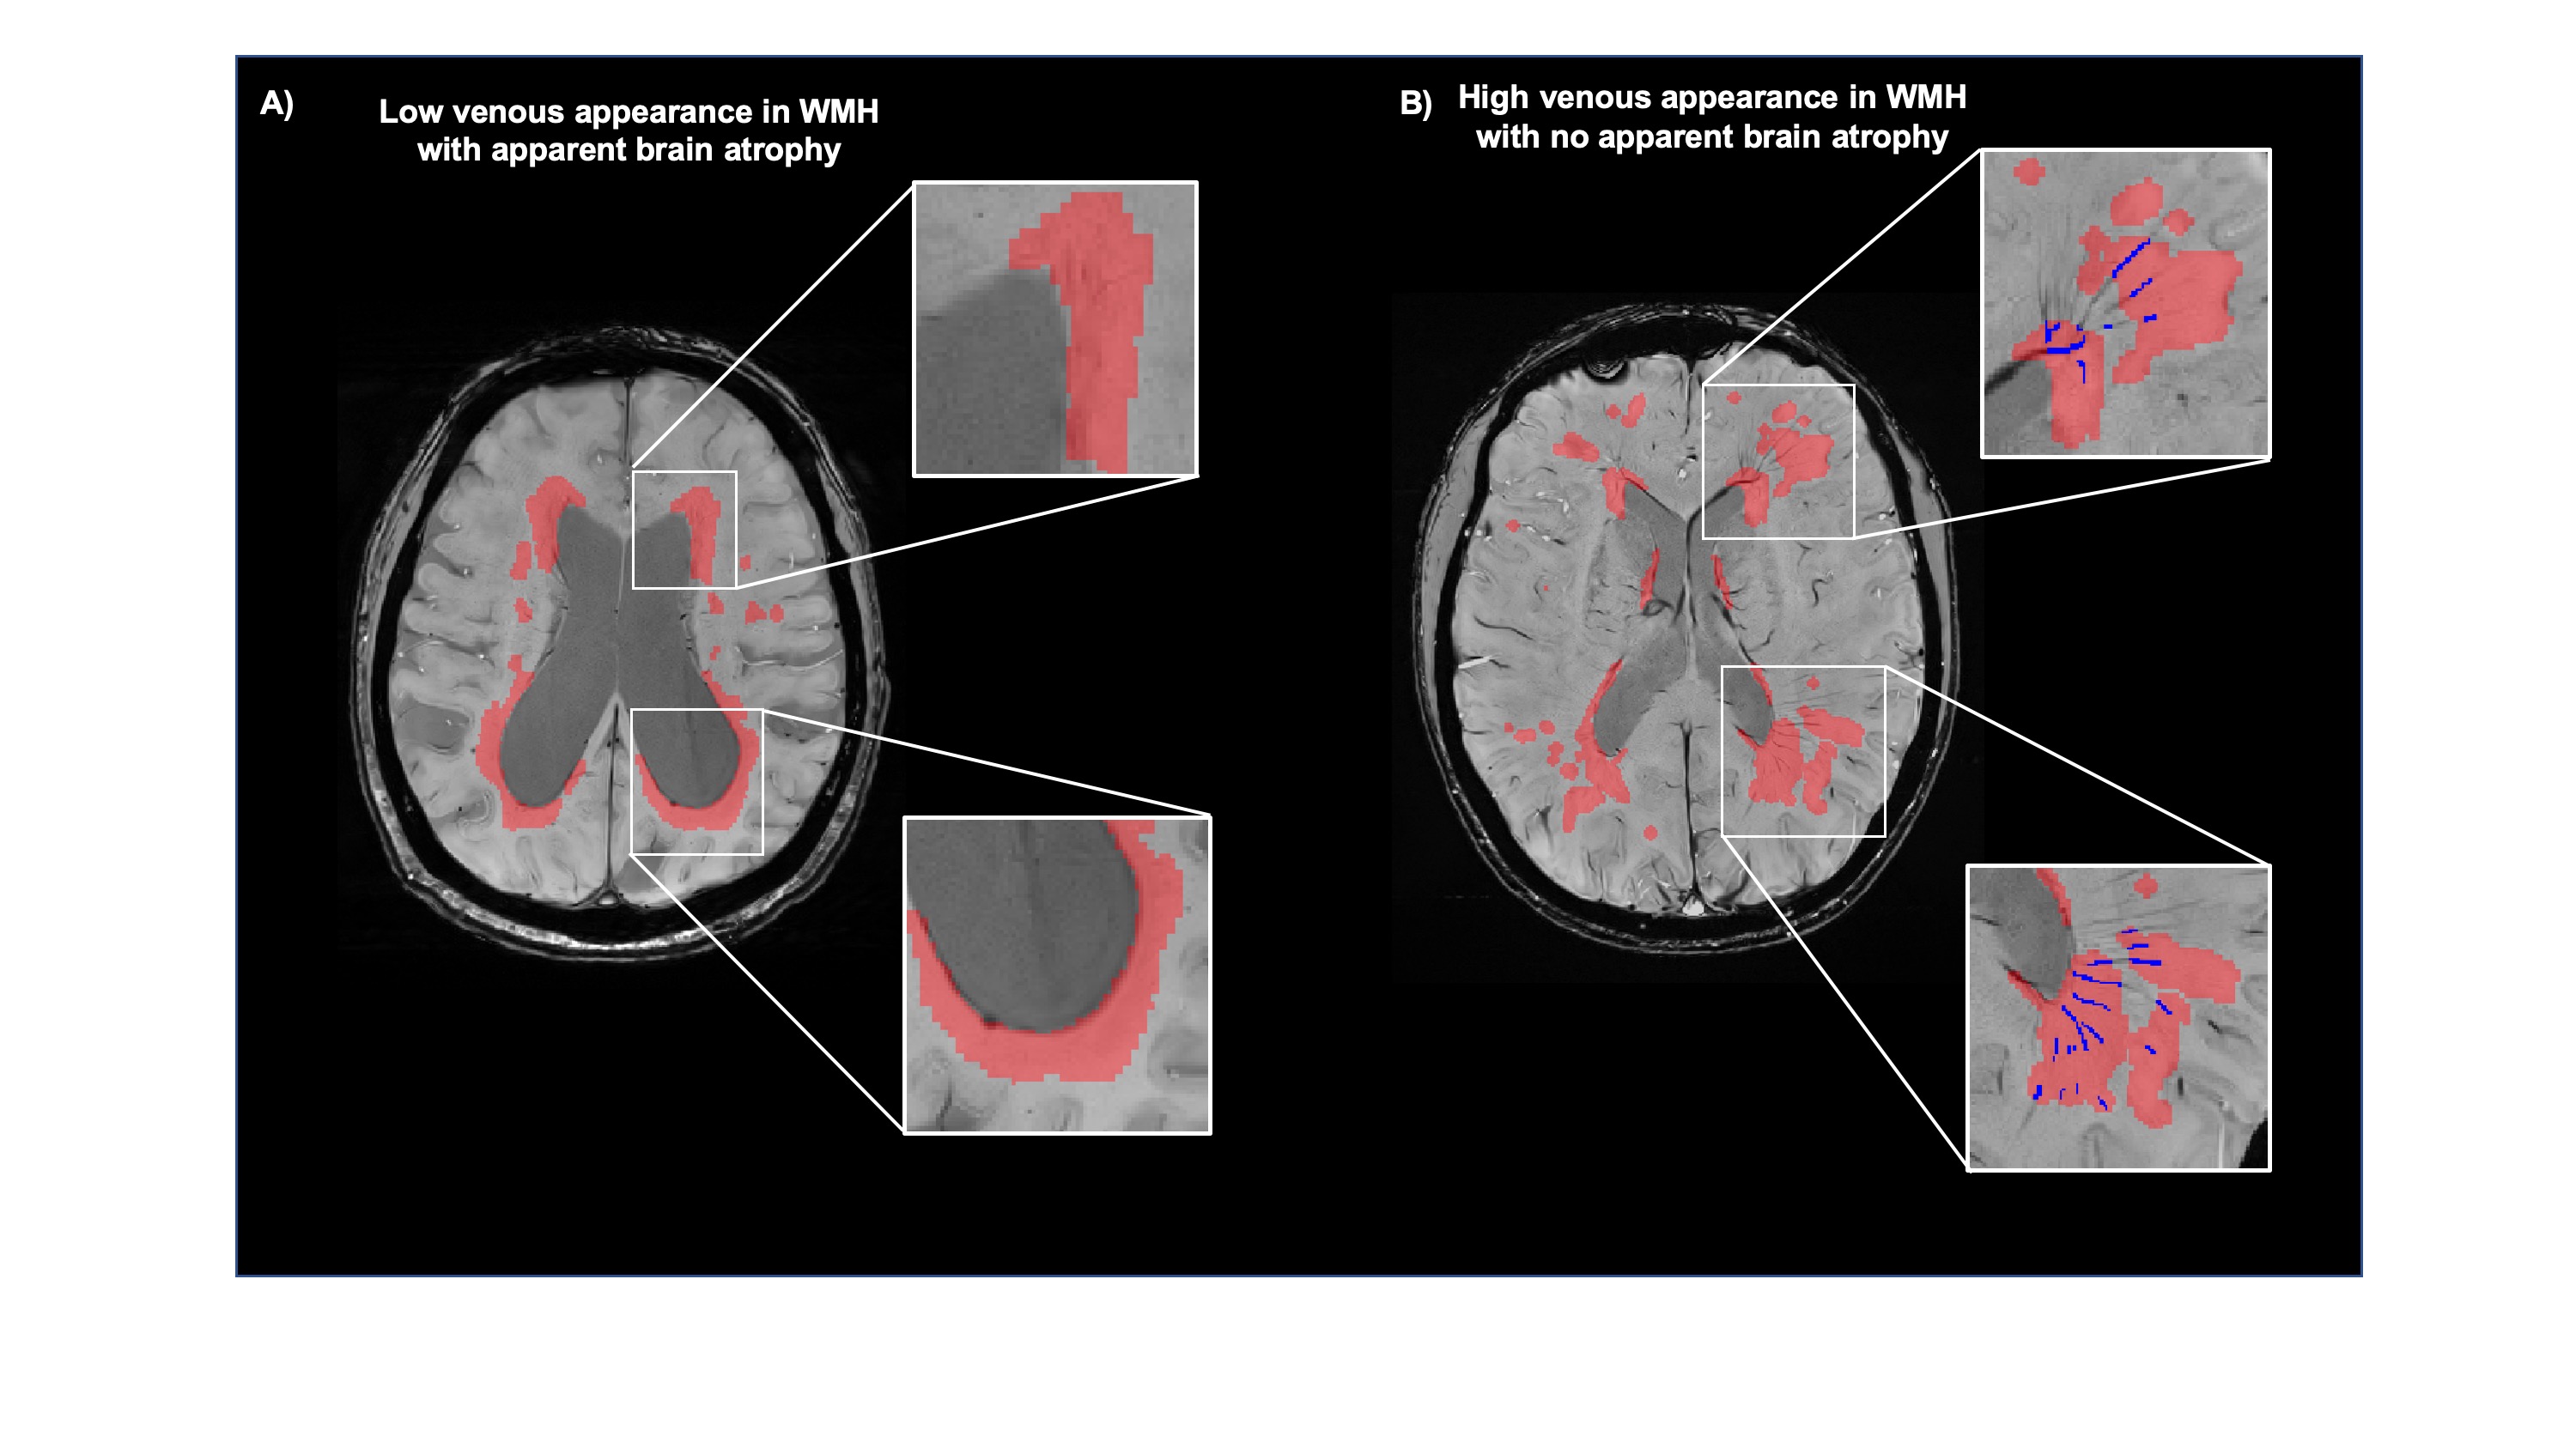
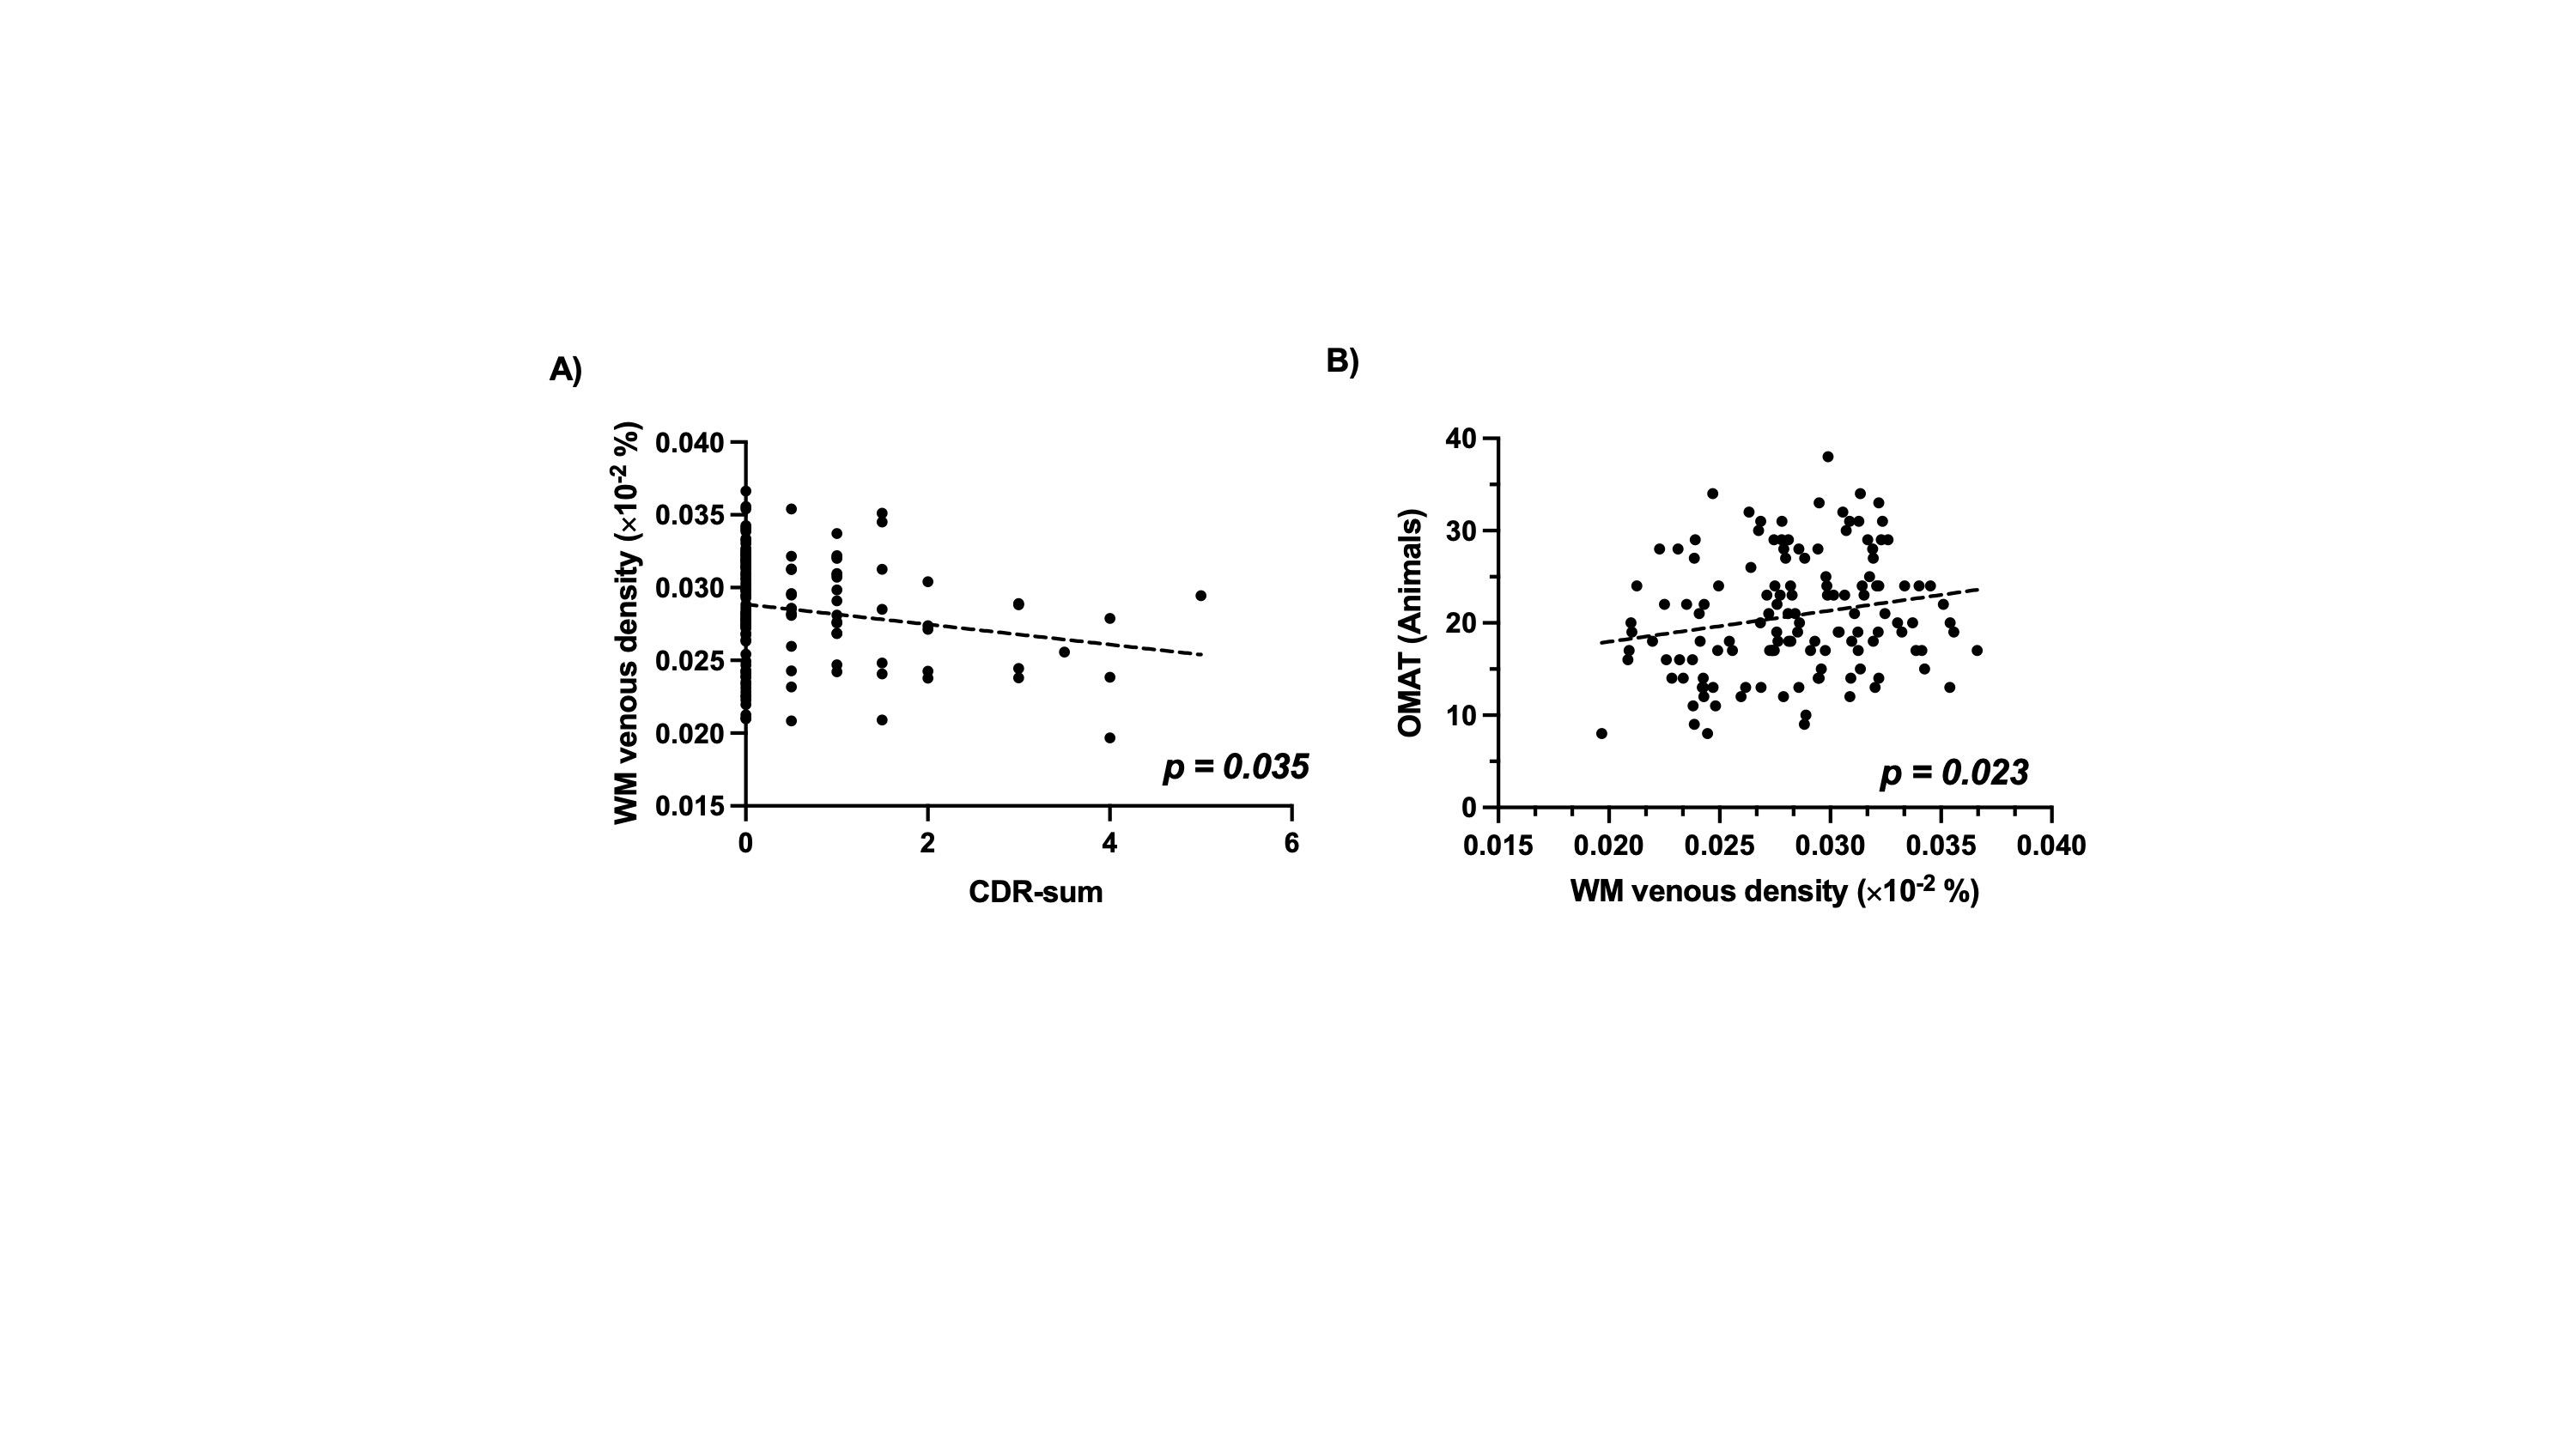
Figure 2 shows representative T1-MPRAGE, T2-FLAIR and minimum-intensity projected SWI (mIP-SWI) of patient with and without apparent brain atrophy. Low visibility of deep medullary vein was observed when patient has high degree of cerebral atrophy or low BPF and GMF. Figure 3.A and Figure 3. B show the association of WM venous density with neurodegenerative features, that WM venous density is positively associated with BPF ( β=0.046±0.01, p<0.001), GMF ( β=0.037±0.01,p<0.001). Figure 4.A and Figure 4.B illustrate the representative cases of SWI images overlaid with WMHs lesion mask. Conspicuous small veins were delineated penetrating or surrounding WMHs when the patient has no apparent brain atrophy, whereas patient with apparent brain atrophy has lower visibility of small veins. In addition, quantitative analysis revealed no significant association of white matter venous density to WMHs lesion load (p=0.396). We also exam the association of PvWM venous density with Pv-WMHs lesion load and no association has been found (p=0.739) (Figure 3.C-D). When examining the association between WM venous density and cognitive evaluations, WM venous density is negatively associated with CDR-sum score (p=0.035) (Figure 5.A) and is positively correlated with OMAT test scores (p=0.023) (Figure 5.B).Discussion
Compared to large venous structure, the contrast of small veins on the SWI venography is more sensitive to the concentration of deoxygenated hemoglobin(12). From anatomical perspective, venous vasculature within the WMHs lesion does not drain blood solely from WMHs, but also from cortical grey matter and deep white matter region. The venous drainage pathways could cross WMHs. The neurodegenerative features of these brain structures may result in higher oxygenated level in WM small veins resulting in diminished visibility on SWI venography. In a way, loss of brain volume indicates the damage and loss of neural processing and computational components such as neurons and synapses, which are thought to be major energy-consuming components in the brain. The reduction in tissue oxygen utilization caused by neurodegeneration may play a dominating role, while the oxygen metabolism in WMHs is mildly affected.Conclusion
Our study showed that reduced venous density on SWI is associated with neurodegeneration measured with brain atrophy indices. This diminished small veins visibility could be associated with reduced oxygen utilization in neurodegeneration but minimally altered in regions where WMHs present, suggesting the venous contrast changes are likely due to oxygen metabolic changes rather than vascular physical damage. Furthermore, we demonstrated that reduced WM venous density is associated with cognitive impairment and subjects with dementia showed lower WM venous density(13,14).Acknowledgements
This study was funded by National Institute of Health grants (RF1 NS11041, R56 AG060822, R01 NS108491, R13 AG067684, P30 AG066512). This study is also supported by Alzheimer’s Association (AARG-17-533484).References
1. Haacke EM, Xu Y, Cheng YC, Reichenbach JR. Susceptibility weighted imaging (SWI). Magn Reson Med 2004;52(3):612-618.
2. Haacke EM, Mittal S, Wu Z, Neelavalli J, Cheng YC. Susceptibility-weighted imaging: technical aspects and clinical applications, part 1. AJNR Am J Neuroradiol 2009;30(1):19-30.
3. Ge Y, Zohrabian VM, Osa EO, Xu J, Jaggi H, Herbert J, Haacke EM, Grossman RI. Diminished visibility of cerebral venous vasculature in multiple sclerosis by susceptibility-weighted imaging at 3.0 Tesla. J Magn Reson Imaging 2009;29(5):1190-1194.
4. Li M, Hu J, Miao Y, Shen H, Tao D, Yang Z, Li Q, Xuan SY, Raza W, Alzubaidi S, Haacke EM. In vivo measurement of oxygenation changes after stroke using susceptibility weighted imaging filtered phase data. PLoS One 2013;8(5):e63013.
5. Kesavadas C, Santhosh K, Thomas B. Susceptibility weighted imaging in cerebral hypoperfusion-can we predict increased oxygen extraction fraction? Neuroradiology 2010;52(11):1047-1054.
6. Zivadinov R, Poloni GU, Marr K, Schirda CV, Magnano CR, Carl E, Bergsland N, Hojnacki D, Kennedy C, Beggs CB, Dwyer MG, Weinstock-Guttman B. Decreased brain venous vasculature visibility on susceptibility-weighted imaging venography in patients with multiple sclerosis is related to chronic cerebrospinal venous insufficiency. BMC Neurol 2011;11:128.
7. Sinnecker T, Bozin I, Dorr J, Pfueller CF, Harms L, Niendorf T, Brandt AU, Paul F, Wuerfel J. Periventricular venous density in multiple sclerosis is inversely associated with T2 lesion count: a 7 Tesla MRI study. Mult Scler 2013;19(3):316-325.
8. Yan S, Wan J, Zhang X, Tong L, Zhao S, Sun J, Lin Y, Shen C, Lou M. Increased visibility of deep medullary veins in leukoaraiosis: a 3-T MRI study. Front Aging Neurosci 2014;6:144.
9. Morris JC. The Clinical Dementia Rating (CDR): current version and scoring rules. Neurology 1993;43(11):2412-2414.
10. Kinuhata S, Takemoto Y, Senda M, Nakai S, Tsumura E, Otoshi T, Hiratani S, Fukumoto K, Namikawa H, Tochino Y, Morimura M, Shuto T, Uchimoto S. The 1-min animal test as a mental status screening examination in patients with diabetes. Asia Pac Fam Med 2018;17:6.
11. Bernier M, Cunnane SC, Whittingstall K. The morphology of the human cerebrovascular system. Hum Brain Mapp 2018;39(12):4962-4975.
12. Haller S, Haacke EM, Thurnher MM, Barkhof F. Susceptibility-weighted Imaging: Technical Essentials and Clinical Neurologic Applications. Radiology 2021;299(1):3-26.
13. Jiang D, Lin Z, Liu P, Sur S, Xu C, Hazel K, Pottanat G, Darrow J, Pillai JJ, Yasar S, Rosenberg P, Moghekar A, Albert M, Lu H. Brain Oxygen Extraction Is Differentially Altered by Alzheimer's and Vascular Diseases. J Magn Reson Imaging 2020;52(6):1829-1837.
14. Thomas BP, Sheng M, Tseng BY, Tarumi T, Martin-Cook K, Womack KB, Cullum MC, Levine BD, Zhang R, Lu H. Reduced global brain metabolism but maintained vascular function in amnestic mild cognitive impairment. J Cereb Blood Flow Metab 2017;37(4):1508-1516.
Figures