3884
Quantitative susceptibility mapping of early myelination in the posterior limb of internal capsule in neonates1UBC MRI Research Centre, University of British Columbia, Vancouver, BC, Canada, 2Department of Physics and Astronomy, University of British Columbia, Vancouver, BC, Canada, 3Department of Radiology, Children's Hospital of Chongqing Medical University, Chongqing, China, 4Division of Neurology, Department of Pediatrics, University of British Columbia, Vancouver, BC, Canada, 5Department of Radiology, University of British Columbia, Vancouver, BC, Canada
Synopsis
We performed quantitative susceptibility mapping (QSM) of the posterior limb of internal capsule (PLIC) in human neonates. As the PLIC is one of the earliest structures to myelinate, it is clearly visible as a hypointense structure on QSM. This work investigates the potential as a marker for brain health in neonates. There were no significant differences in magnetic susceptibility of the PLIC between healthy controls, injured preterm, and injured term neonates.
Introduction
Myelination of human brains begins during the second trimester of gestation in some brain regions but the majority of myelin is built after birth, with rapid myelination until 2 years of age, after which it slows but continues into late adulthood.1,2 Prenatal injuries and premature birth can lead to injury to immature white matter, and consequently, hypomyelination in white matter tracts.3 Impaired myelination of the posterior limb of internal capsule (PLIC) is considered to be indicative of developmental delay in newborns,4 being one of the abnormalities observed on magnetic resonance imaging (MRI) scans of preterm neonates at term-equivalent age linked to significantly premature birth,5 along with term infants diagnosed with hypoxic-ischemic encephalopathy.6 Disruptions of the myelination process is linked to abnormal neurodevelopment, such as deficits in cognitive and motor function.7 Quantitative susceptibility mapping is based on gradient-echo MR and was shown to be sensitive to changes in myelin content.8 Here we investigated QSM in the PLIC of neonates.Methods
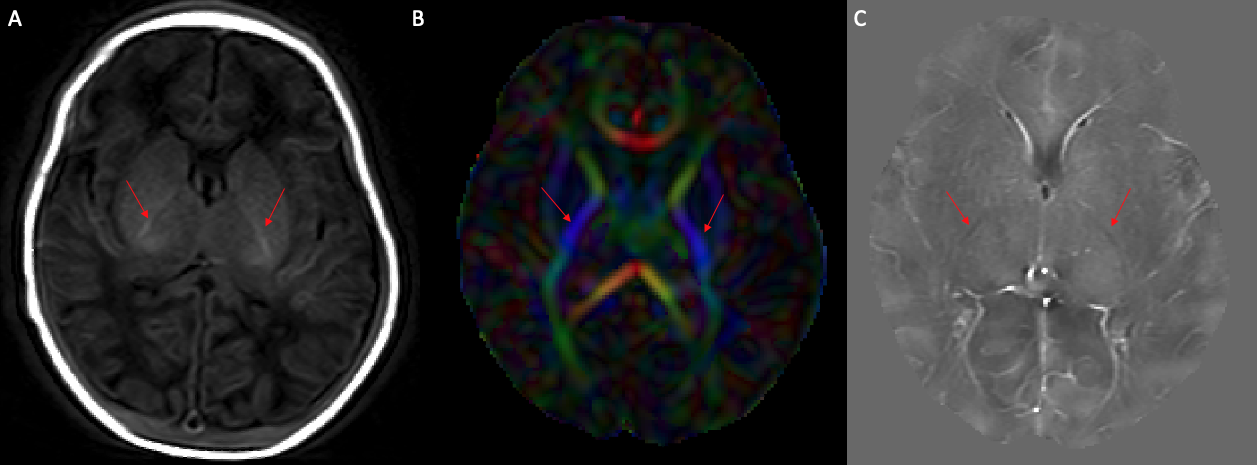
Data were acquired on a 3T system (Achieva; Philips Healthcare) at term equivalent age in 14 preterm infants with a clinical history of perinatal asphyxia and mild to moderate HIE (Mean gestational age at birth = 33.6 ± 2.1 weeks; at scan = 38.8 ± 2.9 weeks), 9 term infants with a clinical history of perinatal asphyxia and moderate HIE (Mean gestational age at birth = 39.0 ± 1.0 weeks; at scan = 41.0 ± 1.0 weeks), and 7 healthy controls (Mean gestational age at birth = 39.3 ± 0.7 weeks; at scan = 41.2 ± 1.0 weeks). Neonates were classified into mild and moderate injury groups based on the clinical classification of HIE, including the clinical symptoms and signs, such as seizures and inhibited primitive reflexes, among others.9 The QSM scan was a 5-echo 3D gradient echo scan (TR = 30 ms, TE1 = 4.5 ms, echo spacing = 5.5 ms, flip angle = 17°, FOV = 196 x 154 x 103 mm3, acquired voxel size = 0.5 x 0.5 x 1 mm3, reconstructed voxel size = 0.5 x 0.5 x 0.5 mm3).10 Diffusion tensor data were also acquired for anatomical identification of the PLIC. 2D T1-weighted scans were acquired as per clinical protocol.QSM was computed using a 2-step dipole inversion algorithm11 after Laplacian unwrapping and background removal using V-SHARP.12,13 The last three echoes were averaged for the final quantitative susceptibility map used to measure susceptibility values (χ). Diffusion data were processed using FSL’s DTIFIT.14 FA maps were registered into susceptibility weighted imaging (SWI) space using FSL’s FLIRT.15,16 Regions of interest were manually drawn in FSLview17 using the FA map that was registered into SWI space. The researcher was blinded to patient condition when drawing masks of the PLIC to avoid bias, masks were drawn based on anatomical references.18
Statistical analysis was performed using R 4.0.3 (2020; https://www.r-project.org/). The relationship between susceptibility value (χ) and condition (healthy control, preterm injury, and term injury) was investigated using a 1-way ANOVA. Shapiro-Wilks normality test revealed no deviations from normality within groups.19
Results
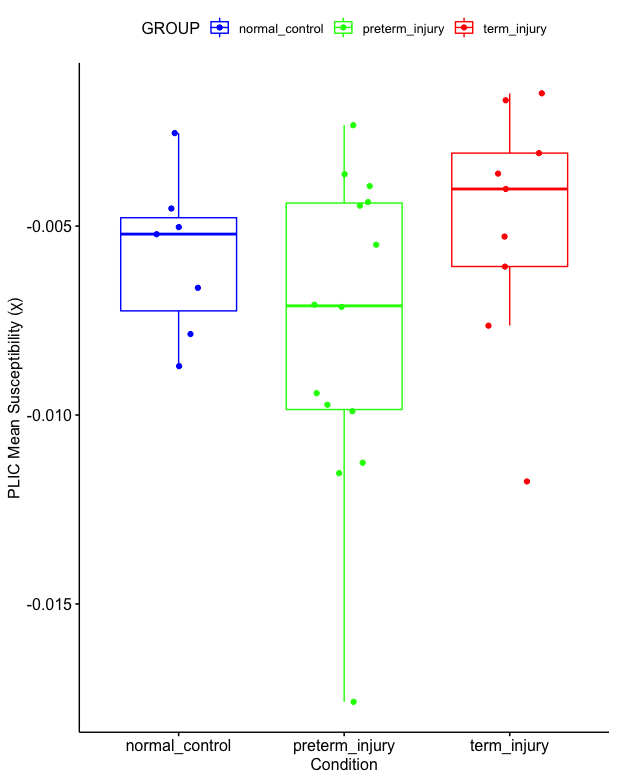
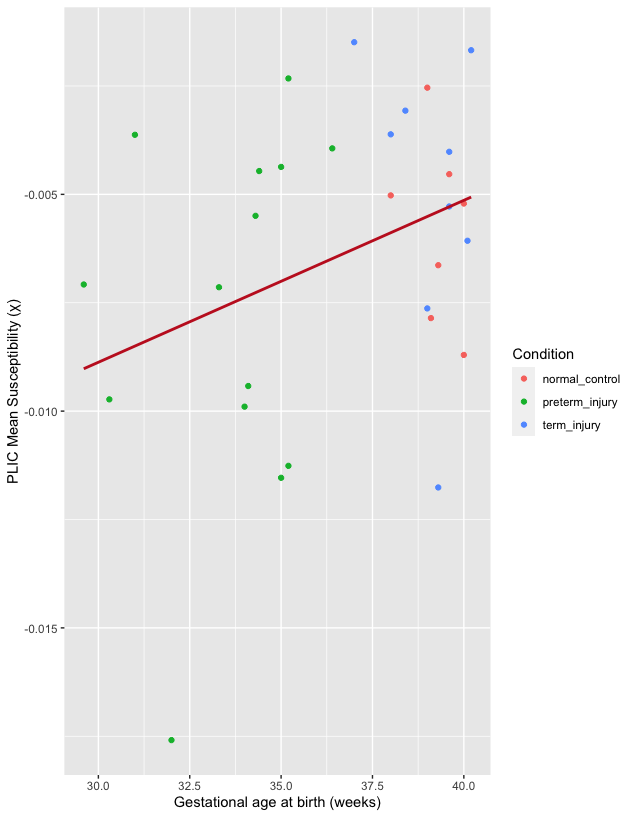
The PLIC was present as a hyperintense area on the T1-weighted scans of all subjects and as hypointense areas on QSM. The mean susceptibility value (χ) of the PLIC in healthy controls, injured preterm, and injury term neonates was -0.0058 (SD, 0.0021) ppm, -0.0077 (SD, 0.0041) ppm, and -0.0050 (SD, 0.0032) ppm, respectively. One-way ANOVA analysis revealed that the condition (healthy control, preterm injury, and term injury) did not make a significant difference among groups (p = 0.18, see Figure 2). A weak, positive correlation was found between gestational age at birth and magnetic susceptibility (χ) of the PLIC (Fig. 3: r = 0.33, N = 31), but this relationship was not significant (p = 0.07, see Figure 3).Discussion
We quantified the degree of myelination of the PLIC in injured term and preterm neonates and healthy term controls using magnetic susceptibility measurements from QSM. It has been shown that abnormal signal intensity in the PLIC, namely in T1 and T2-weighted scans, can be an accurate predictor of neurodevelopmental outcomes in neonates with hypoxic-ischemic encephalopathy.6 Thus, the quantification of the degree of myelination in the PLIC using QSM could serve as a marker for neonatal brain health. No significant differences in the mean magnetic susceptibility of the PLIC were found between the three cohorts. A weak, but non-significant positive correlation between gestational age at birth and magnetic susceptibility was also found (Fig. 3). These findings may be due to a mixed effect of a possible earlier onset of postnatal myelination in preterm neonates,20 and hypomyelination secondary to perinatal insults.3Conclusion
In injured preterm, injured term, and healthy term neonates, the PLIC can be clearly identified on QSM as a structure that is myelinated at birth. However, no significant differences in magnetic susceptibility were measured between these cohorts. In this work the susceptibility of the PLIC obtained using a conventional QSM sequence does not appear to be a good marker of injury in this cohort of neonates. Given the clear visibility of the PLIC in QSM, an adjusted acquisition that is more appropriate for the newborn brain is a promising avenue for future studies.Acknowledgements
UBC Vancouver is located on the traditional, ancestral, and unceded territory of the Musqueam people.
We acknowledge the support of the Natural Sciences and Engineering Research Council of Canada, (Grant/Award Number 016-05371), the Canadian Institutes of Health Research, (Grant Number RN382474-418628), the National MS Society (RG-1507-05301). A.R. is supported by Canada Research Chairs (950-230363). B.M. was supported by an NSERC Undergraduate Student Research Award.
References
1. Laule C, Vavasour IM, Kolind SH, et al. Magnetic resonance imaging of myelin. Neurotherapeutics. 2007;4(3):460-484. doi:10.1016/j.nurt.2007.05.004
2. Stadelmann C, Timmler S, Barrantes-Freer A, Simons M. Myelin in the Central Nervous System: Structure, Function, and Pathology. Physiological Reviews. 2019;99(3):1381-1431. doi:10.1152/physrev.00031.2018
3. Ortinau C, Neil J. The neuroanatomy of prematurity: Normal brain development and the impact of preterm birth. Clinical Anatomy. 2015;28(2):168-183. doi:10.1002/ca.22430
4. McArdle CB, Richardson CJ, Nicholas DA, Mirfakhraee M, Hayden CK, Amparo EG. Developmental features of the neonatal brain: MR imaging. Part I. Gray-white matter differentiation and myelination. Radiology. 1987;162(1):223-229. doi:10.1148/radiology.162.1.3786767
5. Inder TE, Wells SJ, Mogridge NB, Spencer C, Volpe JJ. Defining the nature of the cerebral abnormalities in the premature infant: a qualitative magnetic resonance imaging study. J Pediatr. 2003;143(2):171-179. doi:10.1067/S0022-3476(03)00357-3
6. Rutherford MA, Pennock JM, Counsell SJ, et al. Abnormal magnetic resonance signal in the internal capsule predicts poor neurodevelopmental outcome in infants with hypoxic-ischemic encephalopathy. Pediatrics. 1998;102(2):323+.
7. Olivieri B, Rampakakis E, Gilbert G, Fezoua A, Wintermark P. Myelination may be impaired in neonates following birth asphyxia. NeuroImage: Clinical. 2021;31:102678. doi:10.1016/j.nicl.2021.102678
8. Liu C, Wei H, Gong NJ, Cronin M, Dibb R, Decker K. Quantitative Susceptibility Mapping: Contrast Mechanisms and Clinical Applications. Tomography. 2015;1(1):3-17. doi:10.18383/j.tom.2015.00136
9. Thompson C, Puterman A, Linley L, et al. The value of a scoring system for hypoxic ischaemic encephalopathy in predicting neurodevelopmental outcome. Acta Paediatrica. 1997;86(7):757-761. doi:10.1111/j.1651-2227.1997.tb08581.x
10. Denk C, Rauscher A. Susceptibility weighted imaging with multiple echoes. J Magn Reson Imaging. 2010;31(1):185-191. doi:10.1002/jmri.21995
11. Kames C, Wiggermann V, Rauscher A. Rapid two-step dipole inversion for susceptibility mapping with sparsity priors. NeuroImage. 2018;167:276-283. doi:10.1016/j.neuroimage.2017.11.018
12. Schofield MA, Zhu Y. Fast phase unwrapping algorithm for interferometric applications. Opt Lett, OL. 2003;28(14):1194-1196. doi:10.1364/OL.28.001194
13. Li W, Wu B, Liu C. Quantitative susceptibility mapping of human brain reflects spatial variation in tissue composition. Neuroimage. 2011;55(4):1645-1656. doi:10.1016/j.neuroimage.2010.11.088
14. Behrens TEJ, Woolrich MW, Jenkinson M, et al. Characterization and propagation of uncertainty in diffusion-weighted MR imaging. Magn Reson Med. 2003;50(5):1077-1088. doi:10.1002/mrm.10609
15. Jenkinson M, Smith S. A global optimisation method for robust affine registration of brain images. Med Image Anal. 2001;5(2):143-156. doi:10.1016/s1361-8415(01)00036-6
16. Jenkinson M, Bannister P, Brady M, Smith S. Improved optimization for the robust and accurate linear registration and motion correction of brain images. Neuroimage. 2002;17(2):825-841. doi:10.1016/s1053-8119(02)91132-8
17. Jenkinson M, Beckmann CF, Behrens TEJ, Woolrich MW, Smith SM. FSL. NeuroImage. 2012;62(2):782-790. doi:10.1016/j.neuroimage.2011.09.015
18. Alexander B, Yang JYM, Yao SHW, et al. White matter extension of the Melbourne Children’s Regional Infant Brain atlas: M-CRIB-WM. Human Brain Mapping. 2020;41(9):2317-2333. doi:10.1002/hbm.24948
19. SHAPIRO SS, WILK MB. An analysis of variance test for normality (complete samples)†. Biometrika. 1965;52(3-4):591-611. doi:10.1093/biomet/52.3-4.591
20. Cowan FM. Magnetic resonance imaging of the normal infant brain: term to 2 years. In: MRI of the Neonatal Brain. http://www.mrineonatalbrain.com/ch02-04.php
Figures