3883
Quantitative MRI Reveals Nerve Pathology in a HNPP Mouse Model1Neurology, Wayne State University School of Medicine, Detroit, MI, United States, 2Radiology, Wayne State University School of Medicine, Detroit, MI, United States
Synopsis
Quantitative MRI (qMRI) methods were developed to measure T1, T2, proton density, and MTR of mouse sciatic nerve in-vivo. Pmp22+/- mouse, an animal model of hereditary neuropathy with liability to pressure palsies (HNPP), was imaged at 3- and 6-month of age. The imaging demonstrated an increase of MTR, and a decrease of proton density and T1 in the Pmp22+/- nerves, compared with those in wild-type nerves. These qMRI changes correlate with the growth of HNPP pathology – tomacula formed by excessive myelin folding over time. Ongoing experiment is to determine the pathological and molecular substrates responsible for the qMRI findings.
Introduction
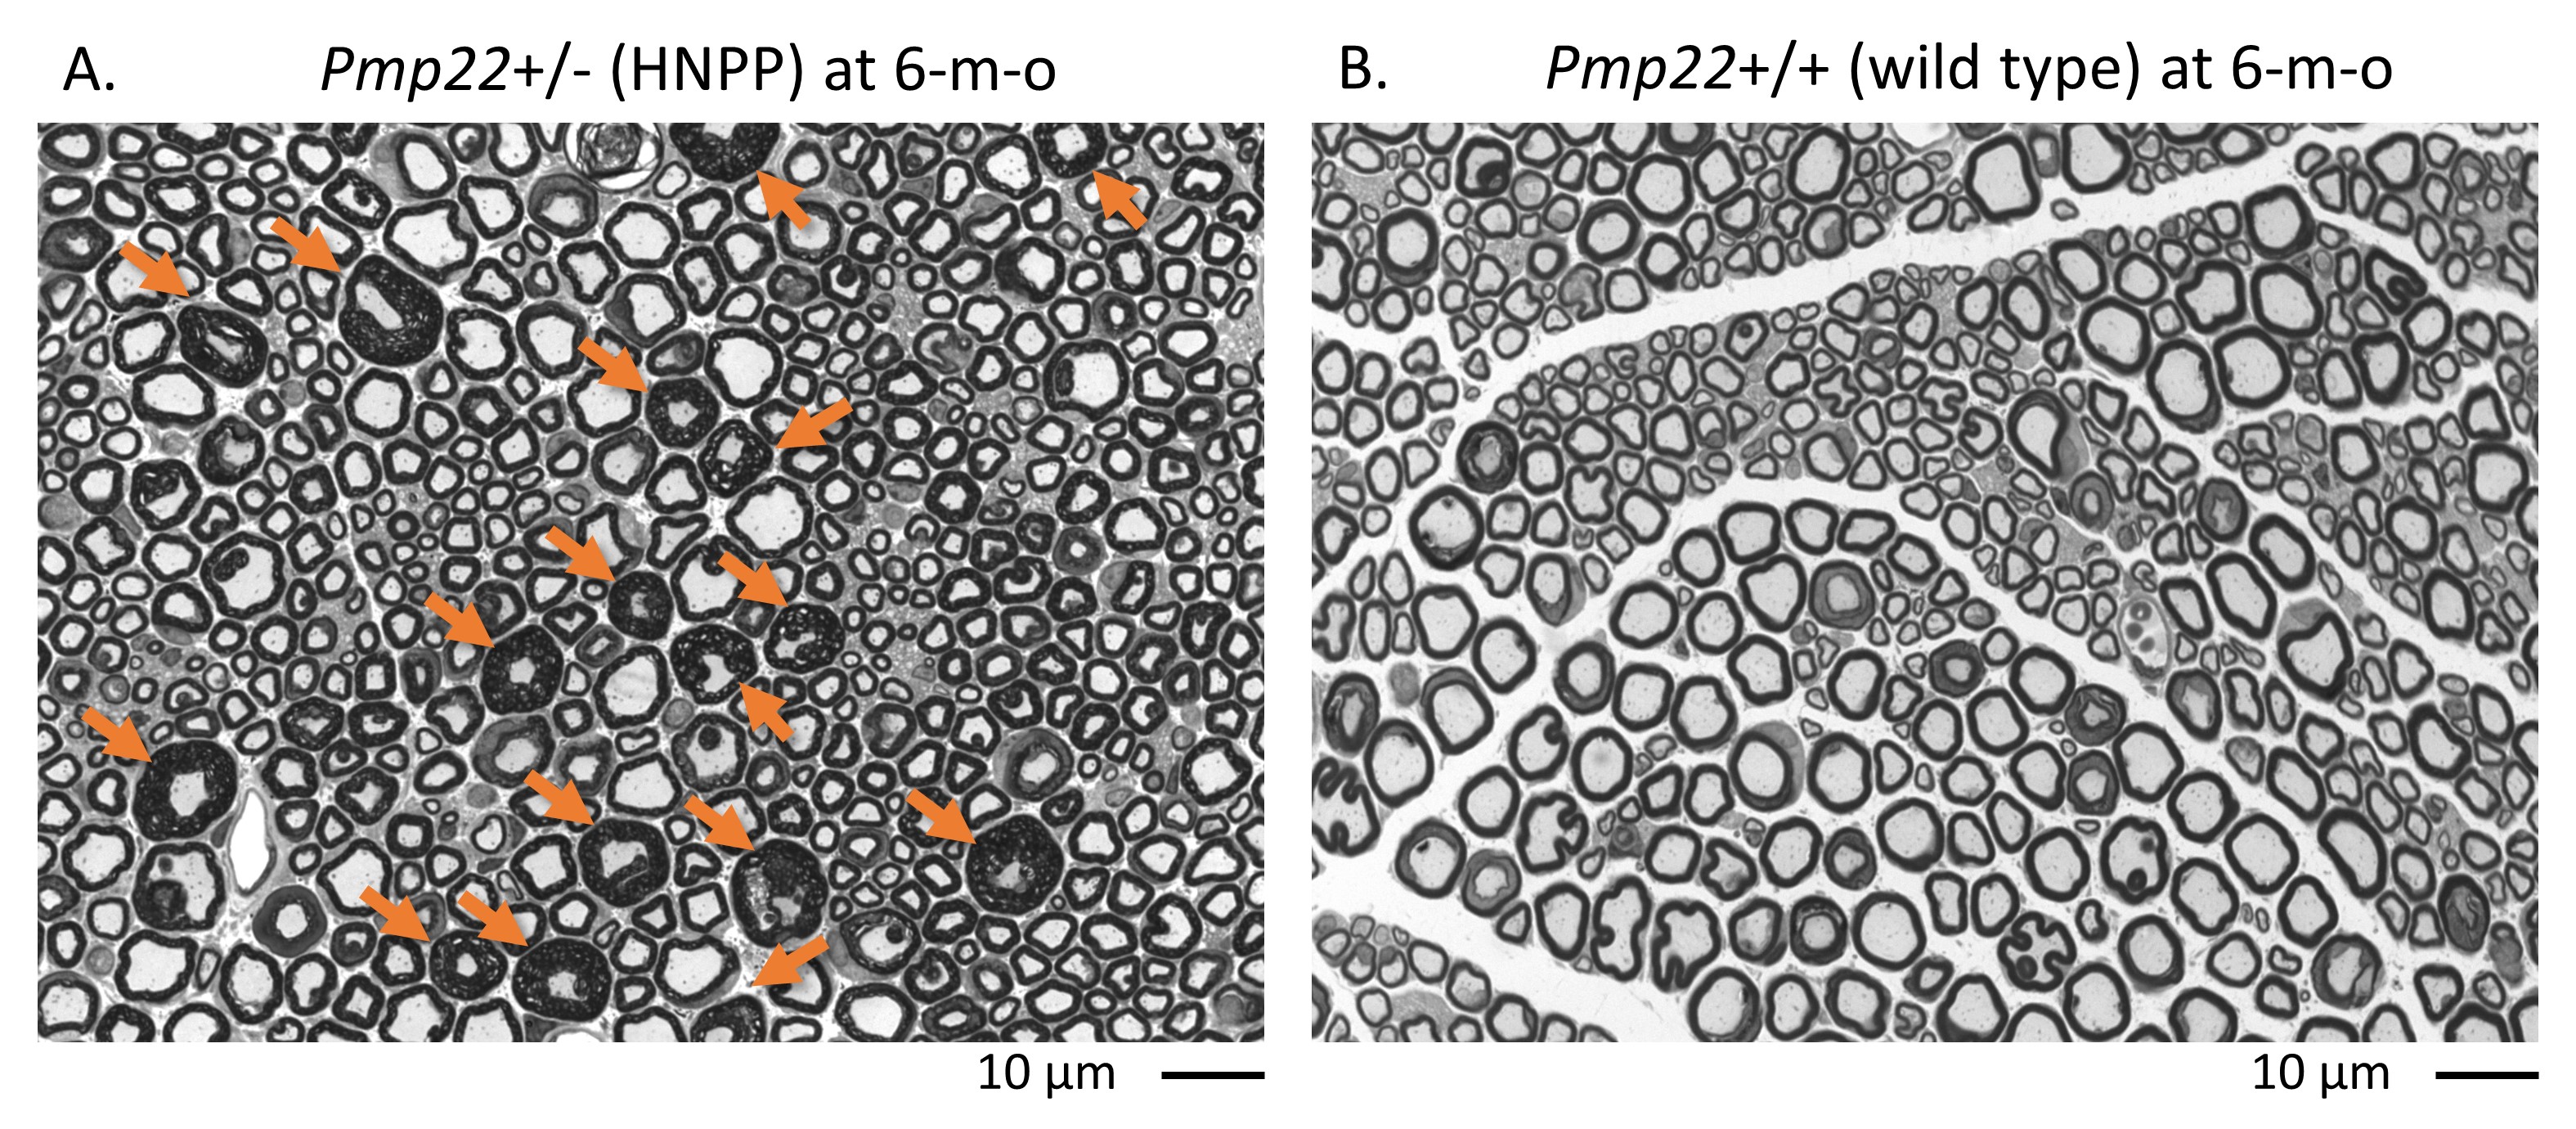
Hereditary neuropathy with liability to pressure palsies (HNPP) is an autosomal-dominantly inherited peripheral nerve disease caused by a heterozygous deletion of the human PMP22 gene.1 HNPP is characterized by focal myelin thickenings known as ‘tomacula’ in peripheral nerves (Figure 1).2, 3 Our studies revealed that haploinsufficiency of PMP22 results in disruption of myelin junctions leading to excessive myelin permeability in HNPP nerves4, 5 and severe fatigue in patients with HNPP6. These discoveries also result in a potential therapy to treat HNPP.7 Hence, there is a pressing need to develop monitoring biomarkers in patients with HNPP. Our quantitative MRI (qMRI) study has shown a high nerve proton density (PD) strongly correlated with fatigue severity in persons with HNPP.6 To determine molecular substrates responsible for these HNPP qMRI changes, we have studied a HNPP mouse model (Pmp22+/-)2, 3 that well recapitulates nerve pathology in HNPP patients. This study measured mouse sciatic nerve T1, T2, PD, and magnetization transfer ratio (MTR) in vivo on a 7T preclinical scanner (Bruker AV4 Neo BioSpec, ParaVison 360 software) which will be correlated with histological and molecular changes in the same nerves.Methods
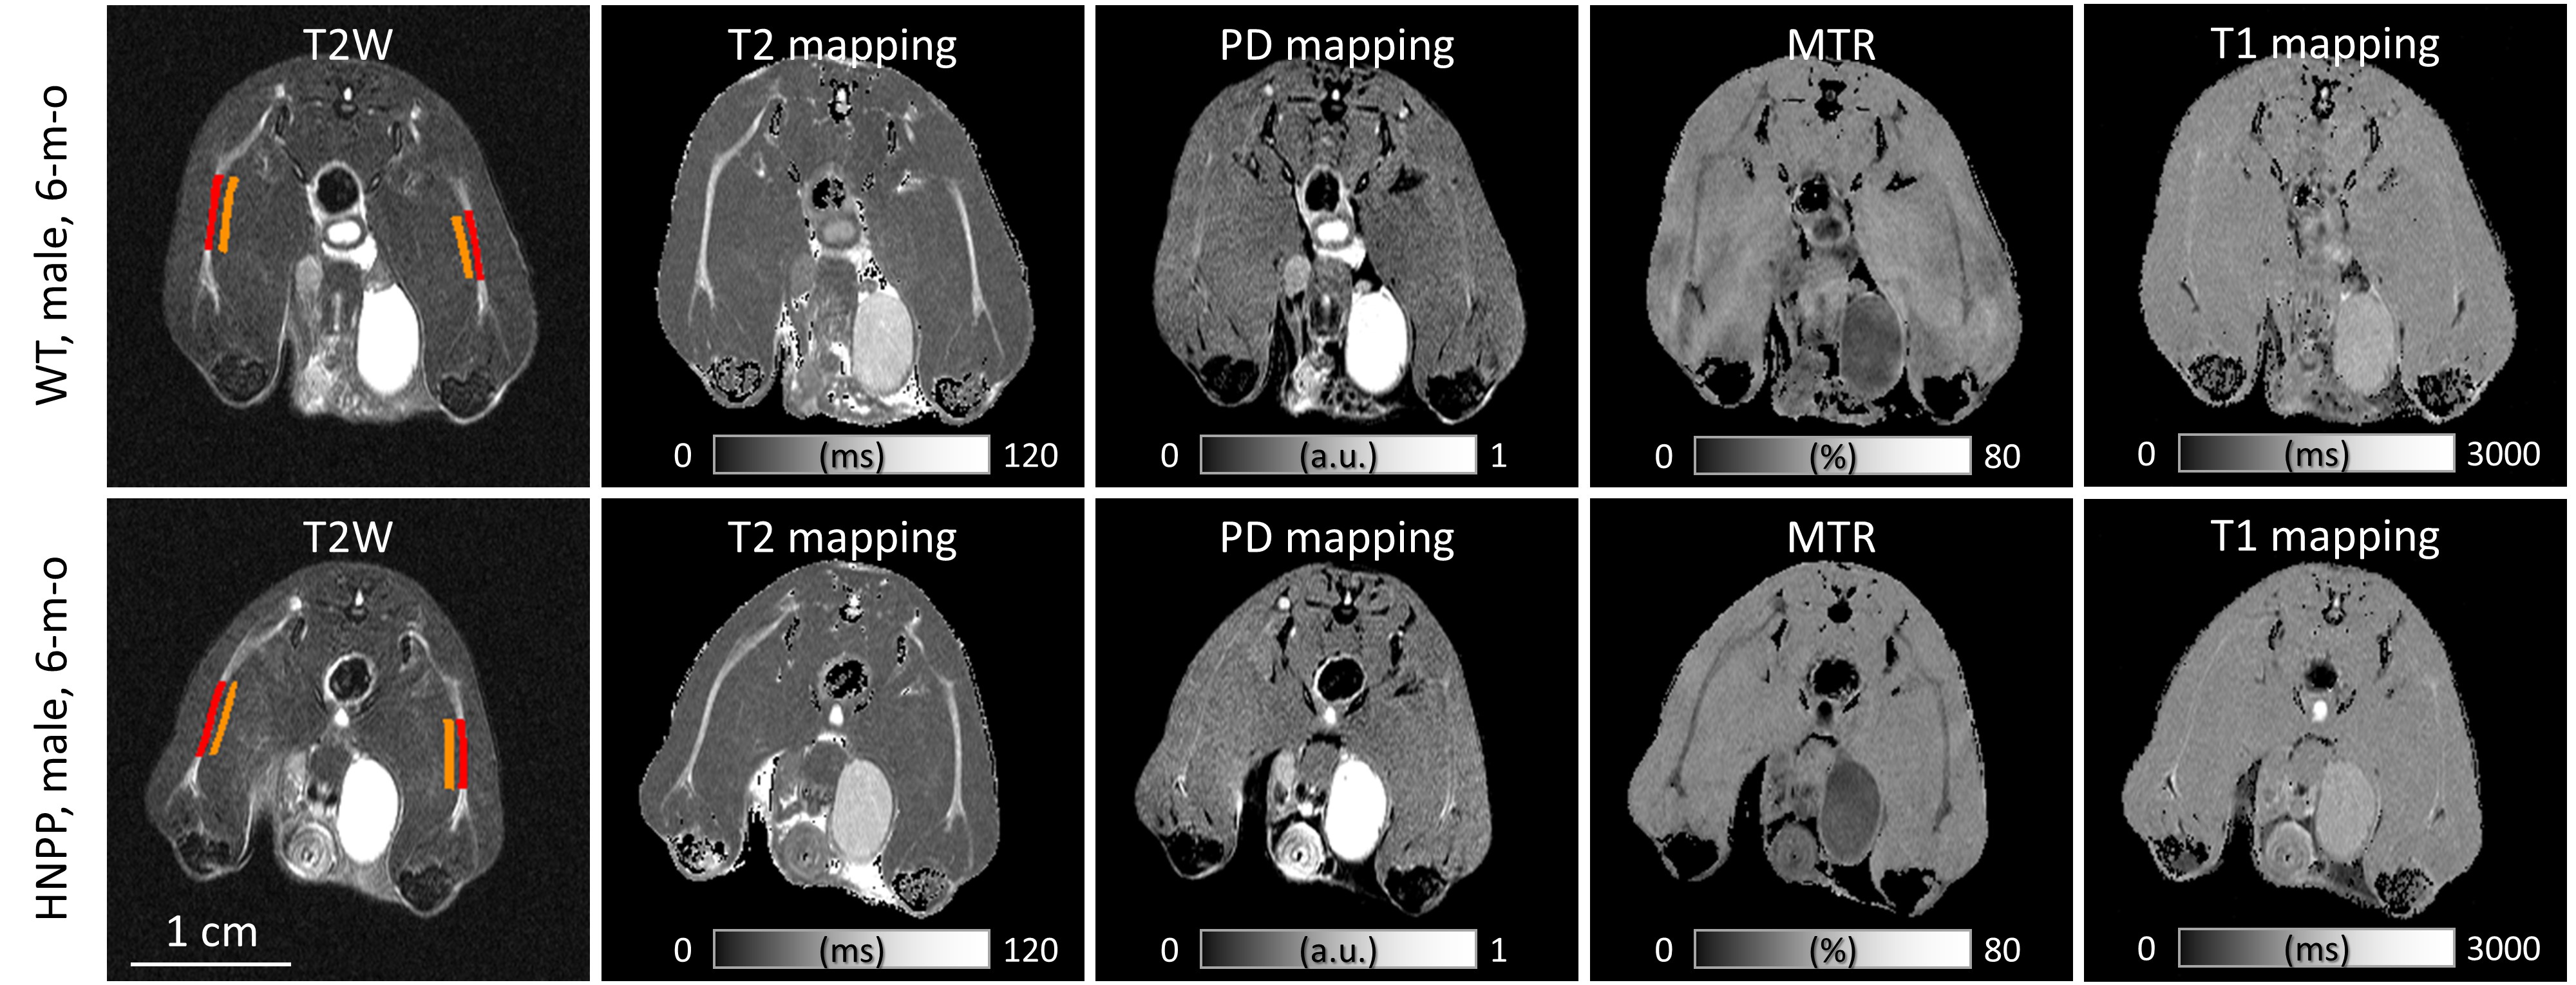
Isoflurane anesthetized (3-5% isoflurane in medical air for induction, 1.3-1.5% for maintenance), spontaneously breathing Pmp22+/- (n = 4, 75% male) and Pmp22+/+ (n = 4, 75% male) mice were placed into the 7T scanner at the prone position and scanned using a volumetric Tx/Rx coil (35 mm in diameter) to acquire bilateral sciatic nerve image in the axial plane. Each animal was imaged twice at 3- and 6-month old then repeated 5 days after the 6-month scan for the test-retest reliability purpose.The imaging protocol includes: i) a 2D T2 weighted RARE (rapid acquisition with relaxation enhancement) sequence for anatomical images. ii) a 2D multi-slice multi-echo sequence for simultaneously T2 and PD mapping using 16 echoes from 11 ms to 176 ms and a three-parameter mono-exponential fitting. A TR = 8s (≥ 5 times T1) was used to minimize the T1 effect and to get a relatively pure PD value. iii) a 3D FLASH (fast low angle shot) sequence with and without an MT pulse for quantifying MTR. The MT pulse was a single-lobe sinc pulse with Gaussian apodization, 15 ms duration, and 1.5k Hz off-resonance. iv) a single slice variable TR RARE sequence for T1 mapping which had 8 TRs from 350 ms to 7750 ms. The imaging resolution was 0.12 x 0.12 x 0.8 mm3. All sequences had 20 slices except for the single slice T1 mapping. A hermite pulse of 5.2 ms/1039 Hz duration/bandwidth followed by a 2-ms-long gradient spoiler was used to suppress fat for all sequences.8
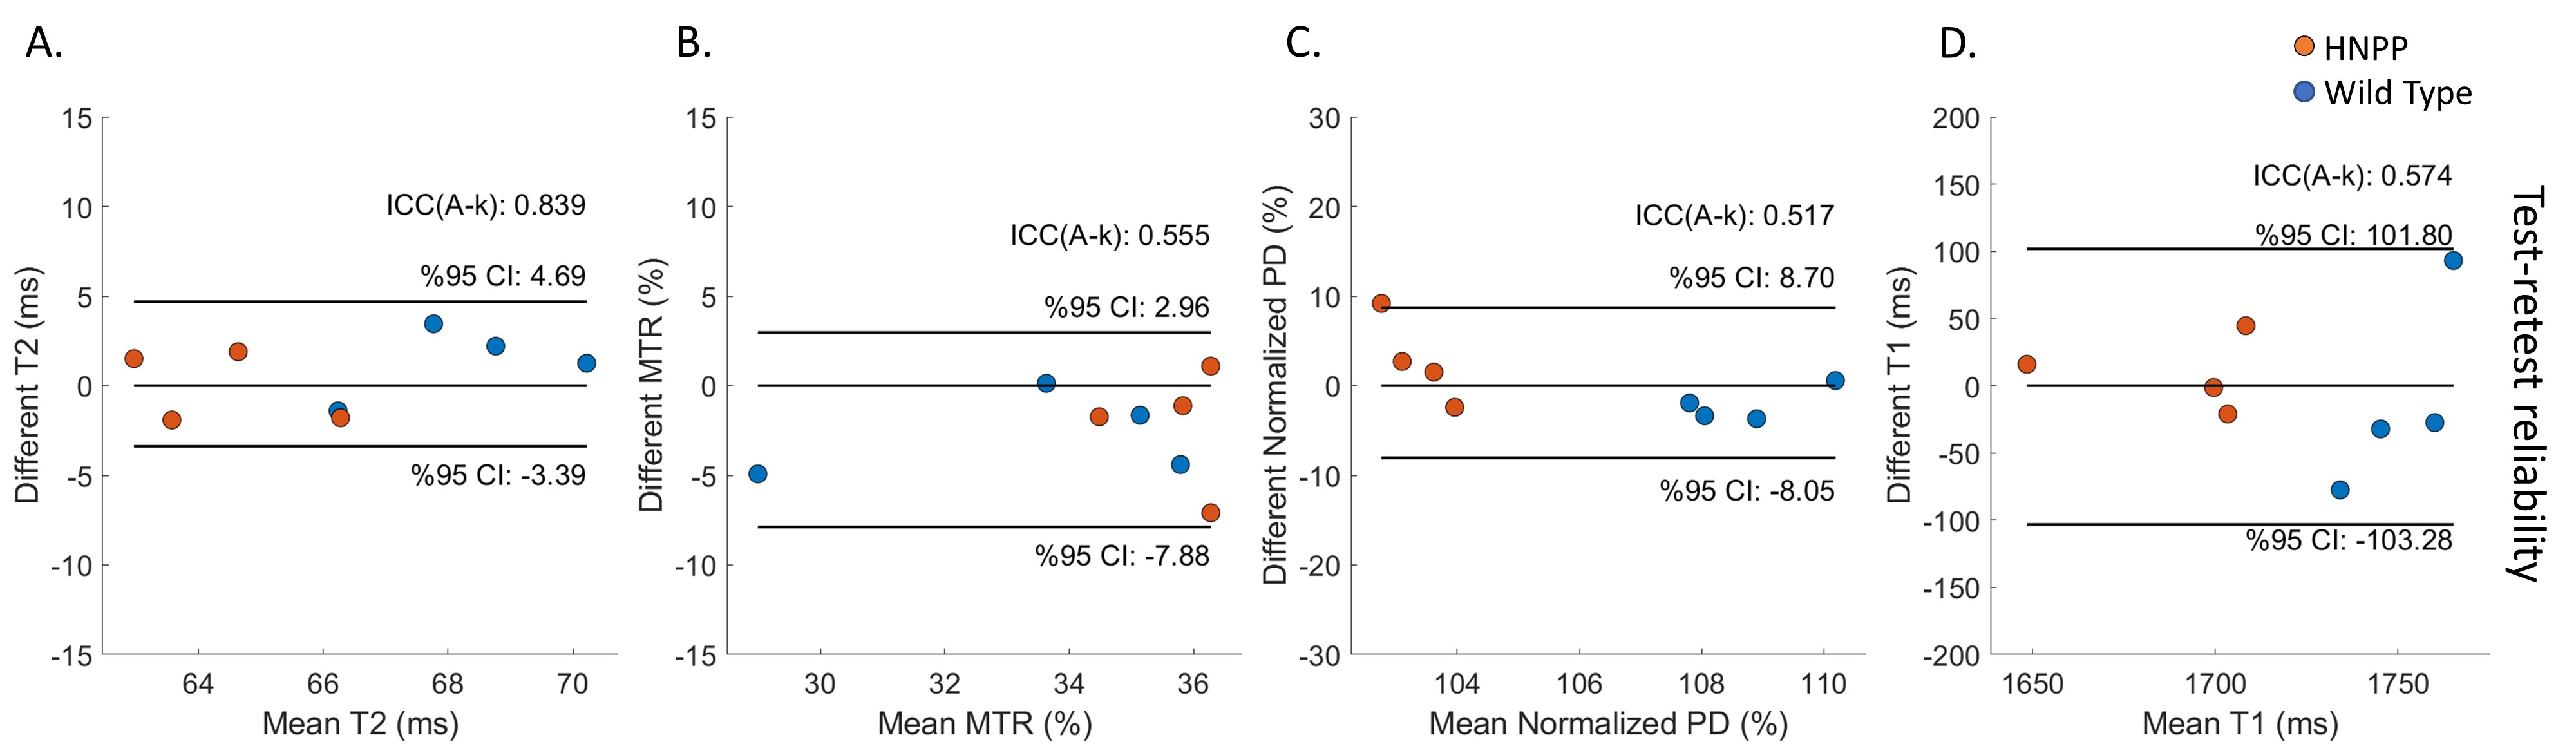
Two independent raters manually measured regions of interest (ROIs) for bilateral sciatic nerves (Figure 2). One of the raters measured all data again 7 days later. The mean value of pixels within the ROI was calculated for T1, T2, PD, and MTR. Wilcoxon rank-sum test was used for the comparison between groups. Paired t-test was used to compare longitudinal changes for each group. The ±95% confidence interval of Bland-Altman analysis and intraclass correlation coefficient (ICC) were used to evaluate the method's test-retest, inter-rater, and intra-rater reliability.
Results
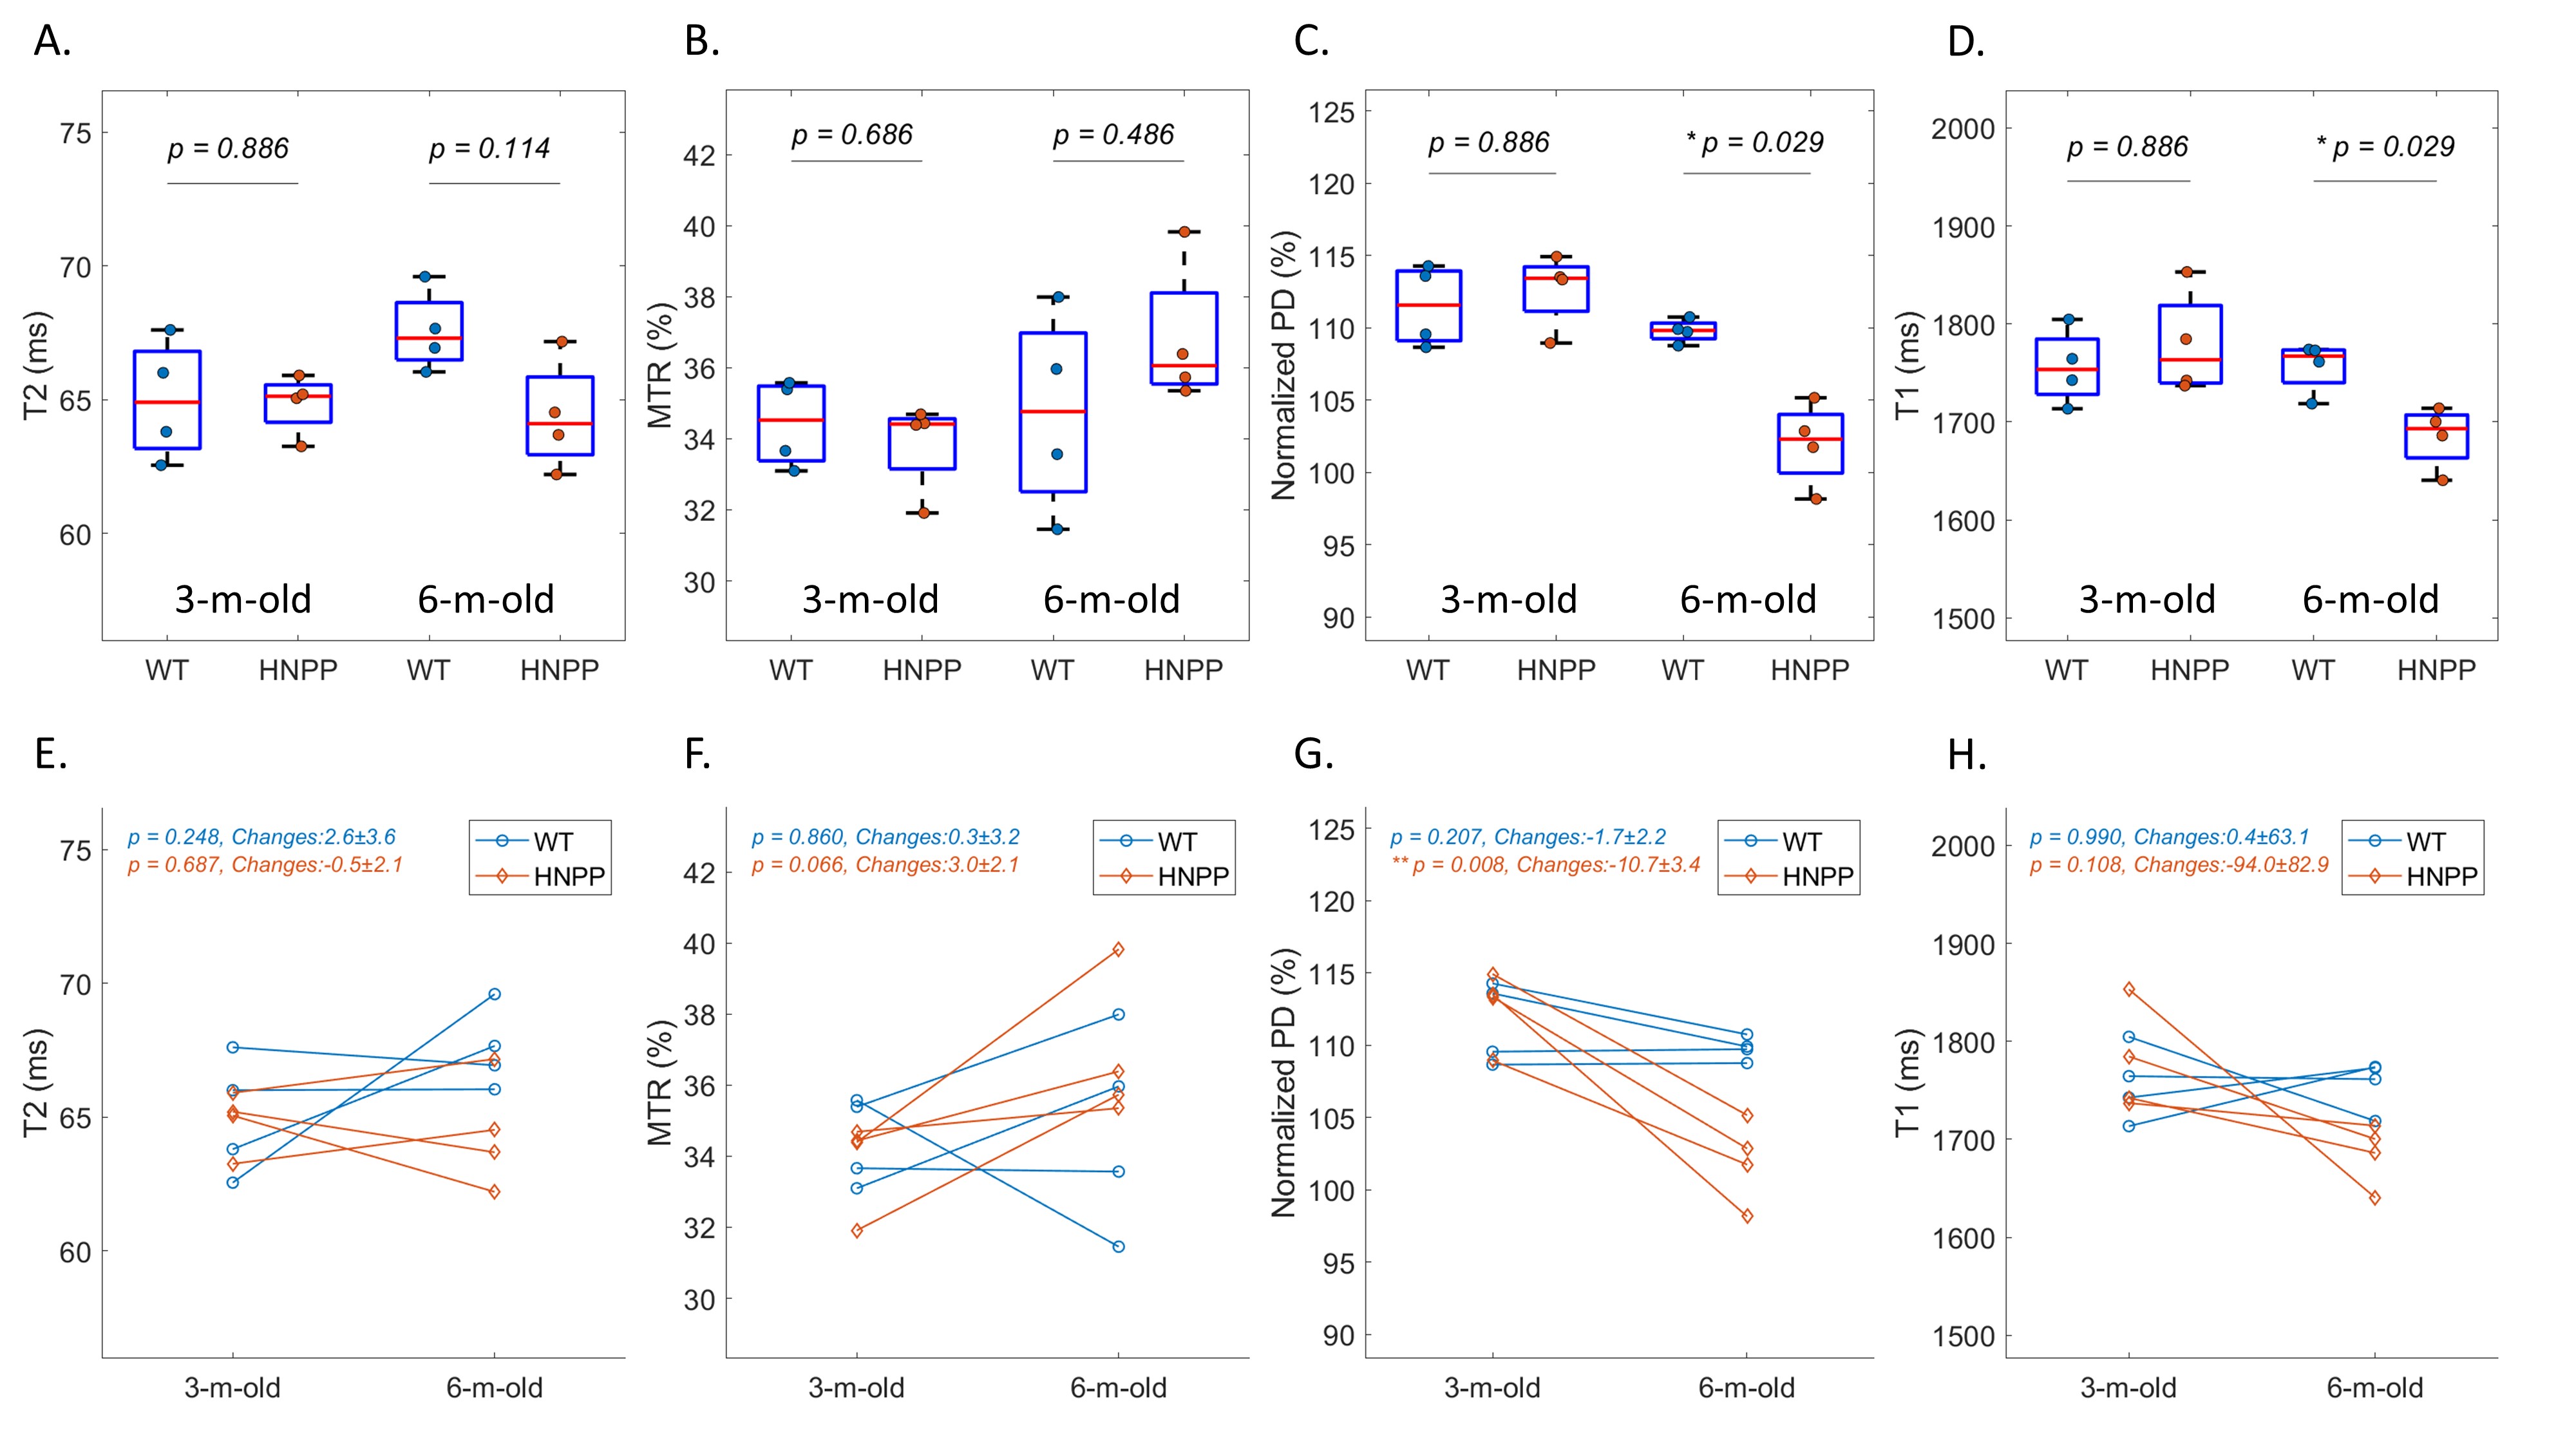
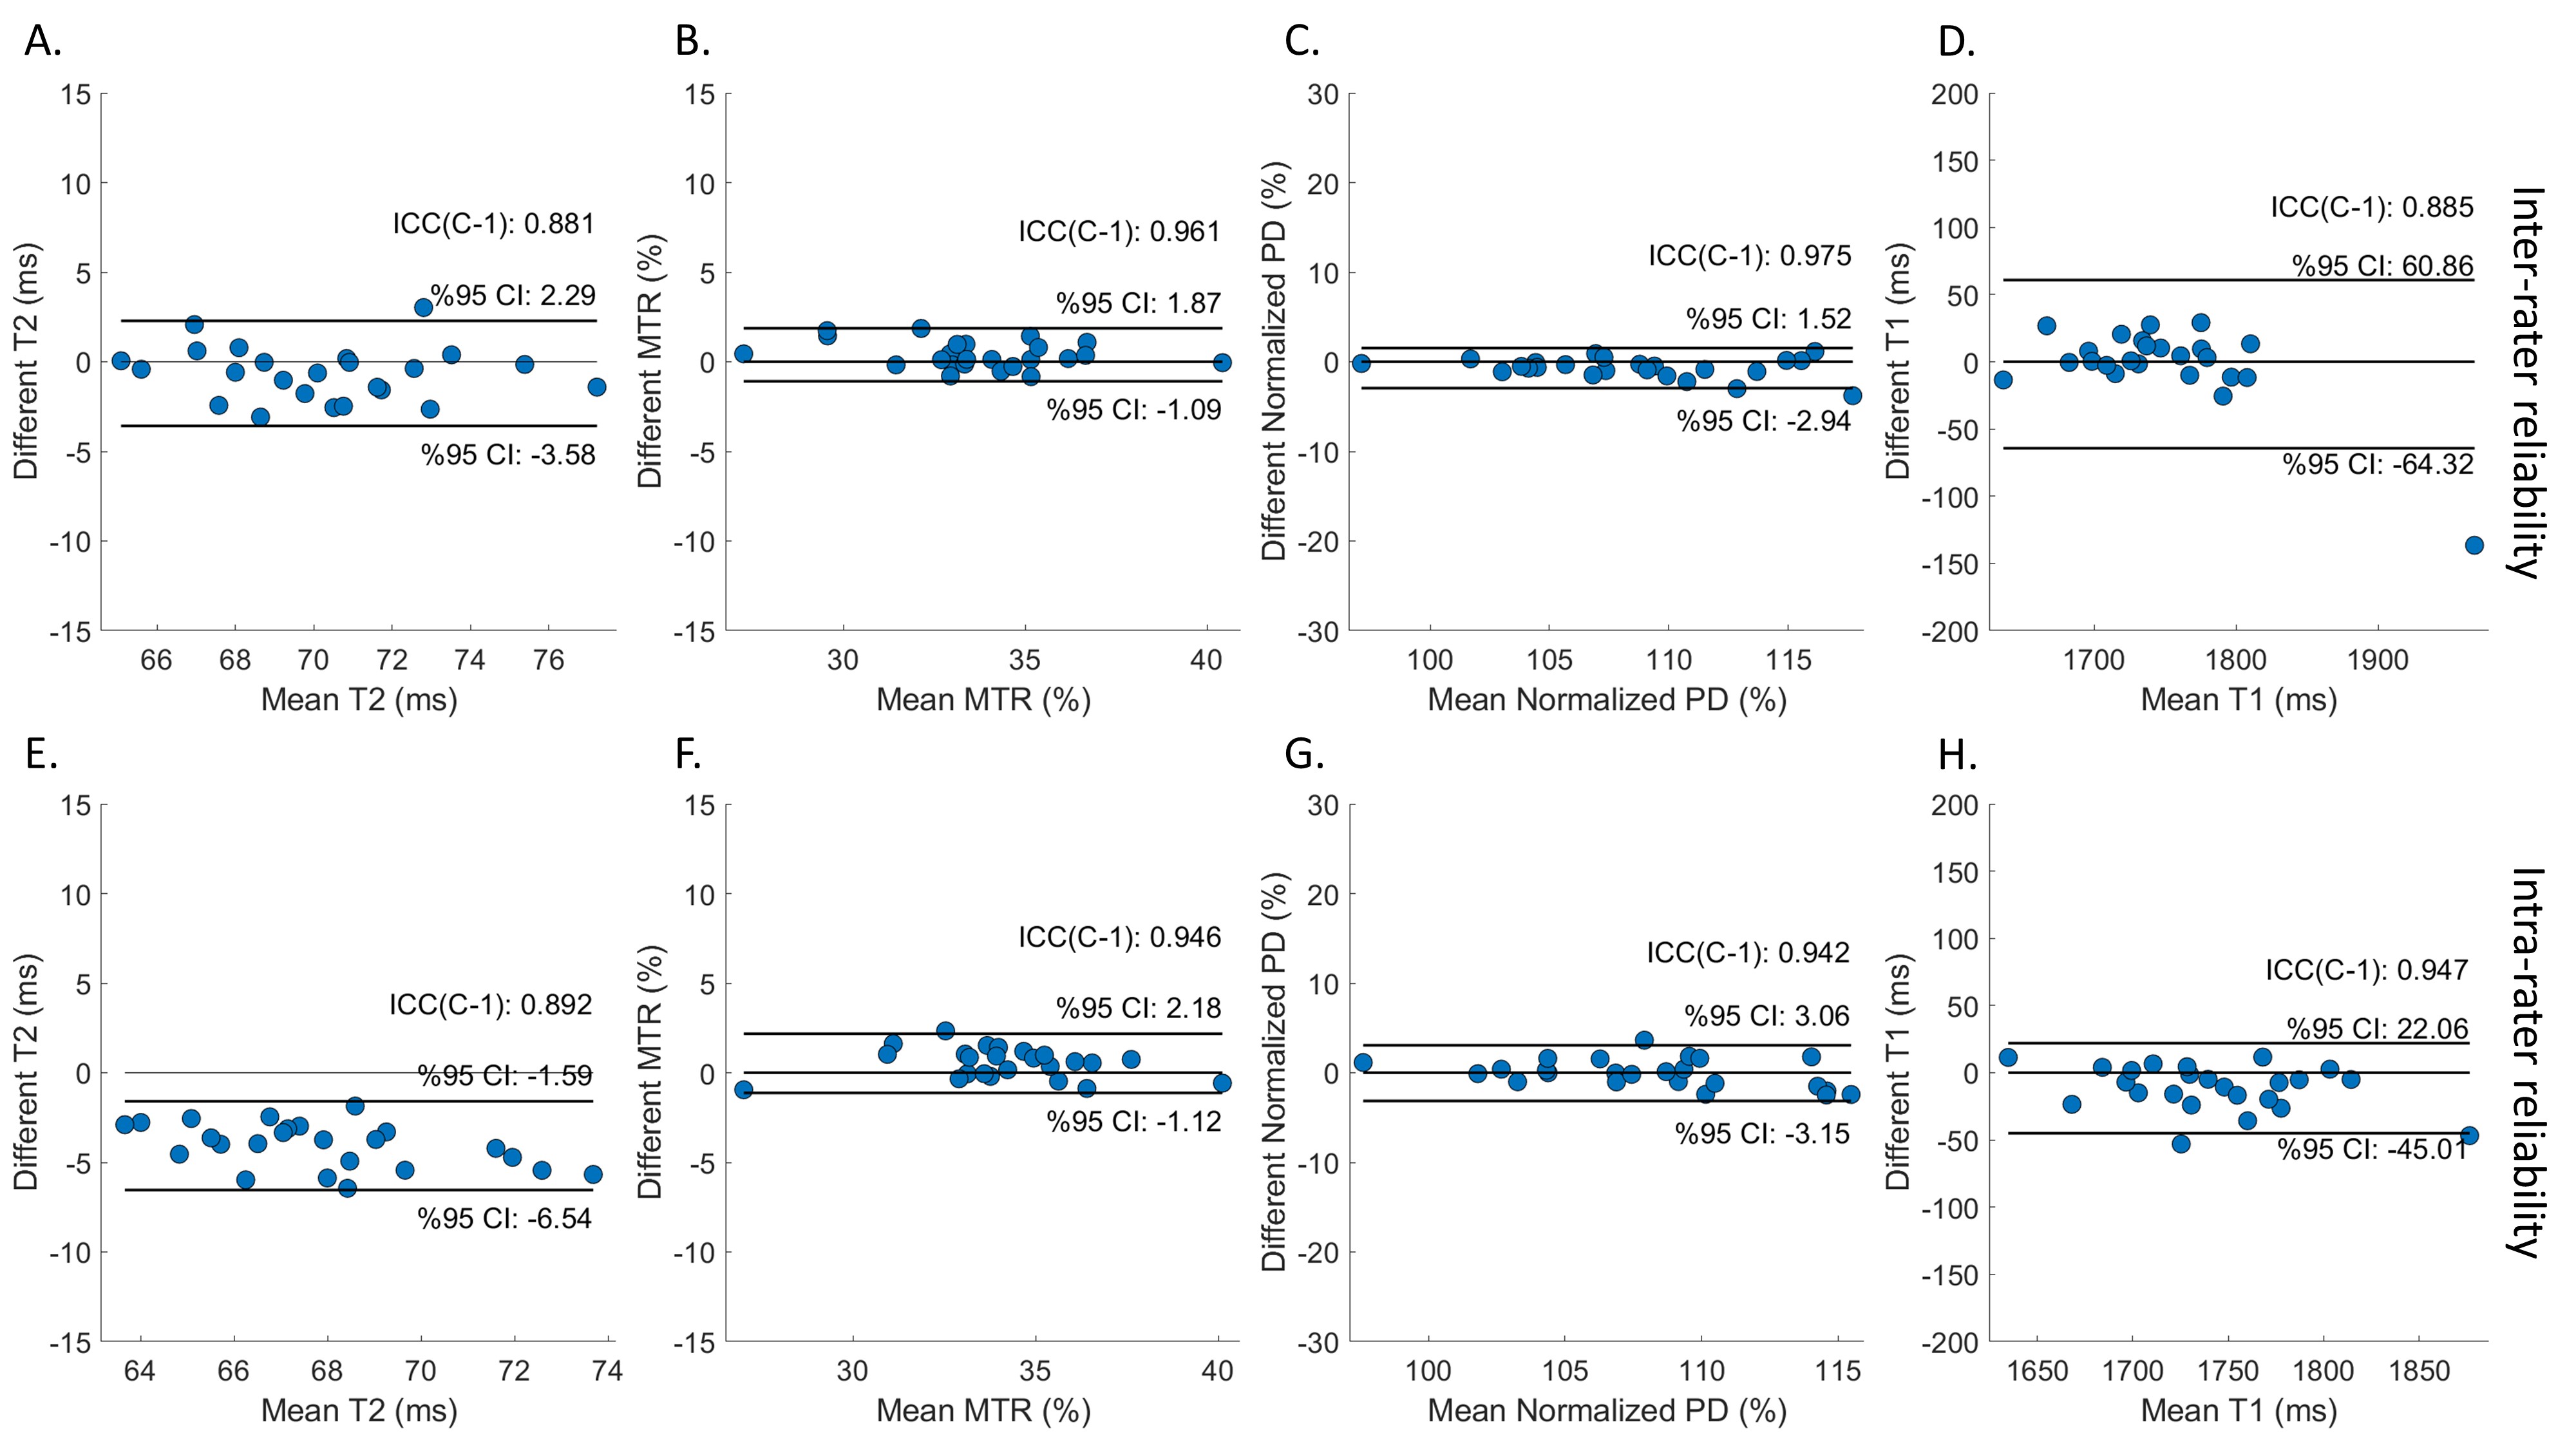
Compared with wild-type (Pmp22+/+) mice, HNPP (Pmp22+/-) mice had a decreased PD, T1, T2; and a high MTR at 6 months of age, but these differences were not seen at 3 months of age (Figures 3A to 3D). While there was a longitudinal increase of MTR, decrease of PD and T1 for Pmp22+/- mice over the 3-month interval, the T2 value was unchanged (Figures 3E to 3H). The test-retest analyses demonstrated a moderate (ICC = 0.5~0.75) agreement for MTR, PD, and T1 assays, and a good (ICC = 0.75~0.9) agreement for T2 (Figure 4). Inter-rater analysis showed good reliability for T1 and T2 measures, and excellent (ICC > 0.9) reliability for PD and MTR measures (Figures 5A to 5D). All parameters had good to excellent intra-rater reliability (Figures 5E to 5H).Discussion and Conclusions
Pmp22+/- mouse is a well-established model for HNPP.2-5 Tomacula formed by excessive myelin folding increases the myelin content per unit of nerve volume. Tomacula gradually increases from 3-month to 6-month of age in both prevalence and their sizes. This pathological change appears to correlate with the qMRI findings indicating an increase of myelin contents and a decrease of water content. However, at the late stage of the disease (>10 months of age), segmental demyelination takes place while tomacula degenerate. We would expect to see an increase in PD and T1 due to a demyelination-induced increase in water content, and a decrease in MTR due to degeneration of tomacula, leading to a decrease of myelin content in the aged animals.In conclusion, this pilot study demonstrated the reliability and feasibility of the quantitative MRI methods to monitor the progression of peripheral nerve pathologies in the HNPP mouse model. The ongoing investigation will determine the molecular substrates responsible for the MRI findings.
Acknowledgements
Funding sources: NIH/NINDS R01NS115748 and NIH/NCATS R21TR003312.References
1. Li J, Parker B, Martyn C, Natarajan C, Guo J. The PMP22 gene and its related diseases. Molecular neurobiology 2013;47:673-698.
2. Adlkofer K, Frei R, Neuberg DH-H, Zielasek J, Toyka KV, Suter U. Heterozygous peripheral myelin protein 22-deficient mice are affected by a progressive demyelinating tomaculous neuropathy. Journal of Neuroscience 1997;17:4662-4671.
3. Adlkofer K, Martini R, Aguzzi A, Zielasek J, Toyka KV, Suter U. Hypermyelination and demyelinating peripheral neuropathy in Pmp22-deficient mice. Nature genetics 1995;11:274-280.
4. Guo J, Wang L, Zhang Y, et al. Abnormal junctions and permeability of myelin in PMP22‐deficient nerves. Annals of neurology 2014;75:255-265.
5. Hu B, Arpag S, Zhang X, et al. Tuning PAK activity to rescue abnormal myelin permeability in HNPP. PLoS genetics 2016;12:e1006290.
6. Fritz NE, Chen Y, Waters L, et al. Fatigue in patients with hereditary neuropathy with liability to pressure palsies. Annals of Clinical and Translational Neurology 2020;7:1400-1409.
7. Li J, Hu B. Treatment for hereditary neuropathy with liability to pressure palsies (HNPP). US Patent 10507211, 2019.
8. Giorgetti E, Obrecht M, Ronco M, et al. Magnetic Resonance imaging as a Biomarker in Rodent peripheral nerve injury Models Reveals an Age-Related impairment of nerve Regeneration. Scientific reports 2019;9:1-18.
Figures