3882
Can Proximal Nerve Morphometrics Predict Disease Severity in Polyneuropathies?1Neurology, Wayne State University School of Medicine, Detroit, MI, United States, 2Radiology, Wayne State University School of Medicine, Detroit, MI, United States
Synopsis
Human sciatic nerve morphometrics were measured for nerve volume, fascicle volume, and fascicle density using a 3D gradient echo sequence with an in-plane resolution of 0.15 x 0.15 mm2. Metrics from healthy controls showed a moderate correlation of nerve and fascicle volumes with body mass index but not with age. There was a strong correlation between nerve volume and the clinical score of disease severity in patients with hereditary neuropathy with liability to pressure palsies.
Introduction
Peripheral nerve hypertrophy is a pathological finding often seen in patients with inherited or acquired polyneuropathies such as Charcot-Marie-Tooth (CMT) diseases, diabetic neuropathy, and chronic inflammatory demyelinating polyneuropathy (CIDP).1 MRI is typically used to measure the cross-sectional area (CSA) of peripheral nerves as an index of nerve hypertrophy.2 The progression of polyneuropathy evolves in a length-dependent fashion where distal nerves, the part of a neuron farthest from the cell body, are afflicted first; and then the degeneration migrates toward the proximal nerves.3, 4 In patients with severe neuropathy, distal nerves may completely degenerate and are not able to track disease progression. Therefore, proximal nerves are alternative targets to track disease progression.5 We image proximal nerves above the knee to measure sciatic nerve CSA and other quantitative MRI indices.6 The CSA is often measured by an outer boundary of the nerve which encloses all nerve fascicles, epi-/perineurium, and other connective tissues. Using high-resolution 3D imaging, we were able to measure the nerve fascicle volume and the entire nerve volume over a given nerve length. The study is to acquire proximal nerve morphometrics (nerve volume, fascicle volume, and fascicle density) and determine whether these morphometrics are associated with disease severity in patients with polyneuropathies.Methods
We analyzed the high-resolution 3D gradient recalled echo sequence data for 24 consecutively enrolled patients with polyneuropathies and 20 healthy controls. The data were acquired on the subject’s right or left mid-thigh level using a Siemens Verio 3T MRI scanner with an 8-channel knee coil. The imaging parameters were: TR = 26 ms, TE = 5.1 ms, flip angle = 12o, RF pulse = water excitation, bandwidth = 110 Hz/pixel, field of view = 153 x 153 mm2, matrix = 1024 x 768, slice thickness = 3.0 mm. With a parallel imaging acceleration factor of 2, the sequence took 7.5 min for 40 axial slices reconstructed with a voxel size of 0.15 x 0.15 x 3.0 mm3. To minimize the location variation, we measured the tibial portion of the sciatic nerve for nerve volume, fascicle volume, and fascicle density from the central 30 slices (Figure 1). Nerve volume was measured by manually delineating nerve boundaries on each slice. The fascicle volume was calculated using a histogram-based full width at half maximum threshold method. Finally, the fascicle density was the ratio of fascicle volume over the nerve volume. The CMT examination score (CMTES), which is a sub-score of the CMT neuropathy score by excluding electrophysiological score7, was used as a measure of disease severity. Pearson correlations of the nerve morphometrics with age and body mass index (BMI) for control data, and with CMTES for patient data were analyzed using MATLAB. Two raters independently delineated the regions of interest for the inter-rater reliability analysis.Results
Summary of demographic and MRI data are shown in Figure 2. BMI was moderately correlated with fascicle volume (r2 = 0.48, p < 0.001) and nerve volume (r2 = 0.51, p < 0.001), but not fascicle density in healthy controls (Figure 3). There were no correlations between age and nerve morphometrics (Figure 3). The correlation coefficients between CMTES and nerve/ fascicle volumes were moderate when all patients’ data were analyzed together (Figure 4A to 4D). A sub-group of data from 9 patients with hereditary neuropathy with liability to pressure palsies (HNPP) were analyzed separately (Figure 4F to 4J) which showed a very strong correlation between nerve volume and CMTES (r2 = 0.798, p = 0.001). However, when the nerve volume was adjusted by the person’s BMI, the correlation was diminished (r2 = 0.274, p = 0.148, Figure 4H and 4I). There were no correlations between fascicle density and CMTES (Figure 4E and 4J). The inter-rater reliability of the method was excellent (Figure 5).Discussion and Conclusions
The sciatic nerve has a tubular anatomical structure where multiple myelinated and unmyelinated nerve fibers are encased by perineurium to form a nerve fascicle. Multiple fascicles and intraneural blood vessels constitute the nerve encasing by epineurium.2 With high-resolution imaging with fat-sat, nerve fascicles appear as isolated hyperintensity round structures which enables an accurate measure of fascicle volume and density. Nerve hypertrophy may be caused by cell proliferation.8 On the other hand, loosely compacted nerve fascicles increase the nerve volume but not the fascicle volume. The present data suggest that the nerve enlargement is likely associated with inter- and/or intra-fascicular non-neural cell hypertrophy. The ongoing investigation is to analyze the relationships between nerve morphometrics and longitudinal functional outcomes.Acknowledgements
Funding sources: Detroit Medical Center Foundation and NIH/NCATS R21TR003312.
References
1. Sinclair C, Miranda M, Cowley P, et al. MRI shows increased sciatic nerve cross sectional area in inherited and inflammatory neuropathies. J Neurol Neurosurg Psychiatry 2011;82:1283-1286.
2. Chen Y, Haacke EM, Li J. Peripheral nerve magnetic resonance imaging. F1000Res 2019;8:1803.
3. Li J. Inherited neuropathies. Seminars in neurology; 2012: Thieme Medical Publishers: 204-214.
4. Chen Y, Moiseev D, Kong WY, Bezanovski A, Li J. Automation of Quantifying Axonal Loss in Patients with Peripheral Neuropathies through Deep Learning Derived Muscle Fat Fraction. Journal of Magnetic Resonance Imaging 2021;53:1539-1549.
5. Dortch RD, Dethrage LM, Gore JC, Smith SA, Li J. Proximal nerve magnetization transfer MRI relates to disability in Charcot-Marie-Tooth diseases. Neurology 2014;83:1545-1553.
6. Fritz NE, Chen Y, Waters L, et al. Fatigue in patients with hereditary neuropathy with liability to pressure palsies. Annals of Clinical and Translational Neurology 2020;7:1400-1409.
7. Murphy SM, Herrmann DN, McDermott MP, et al. Reliability of the CMT neuropathy score (second version) in Charcot‐Marie‐Tooth disease. Journal of the Peripheral Nervous System 2011;16:191-198.
8. Saba S, Chen Y, Maddipati KR, Hackett M, Hu B, Li J. Demyelination in hereditary sensory neuropathy type‐1C. Annals of Clinical and Translational Neurology 2020;7:1502-1512.
Figures
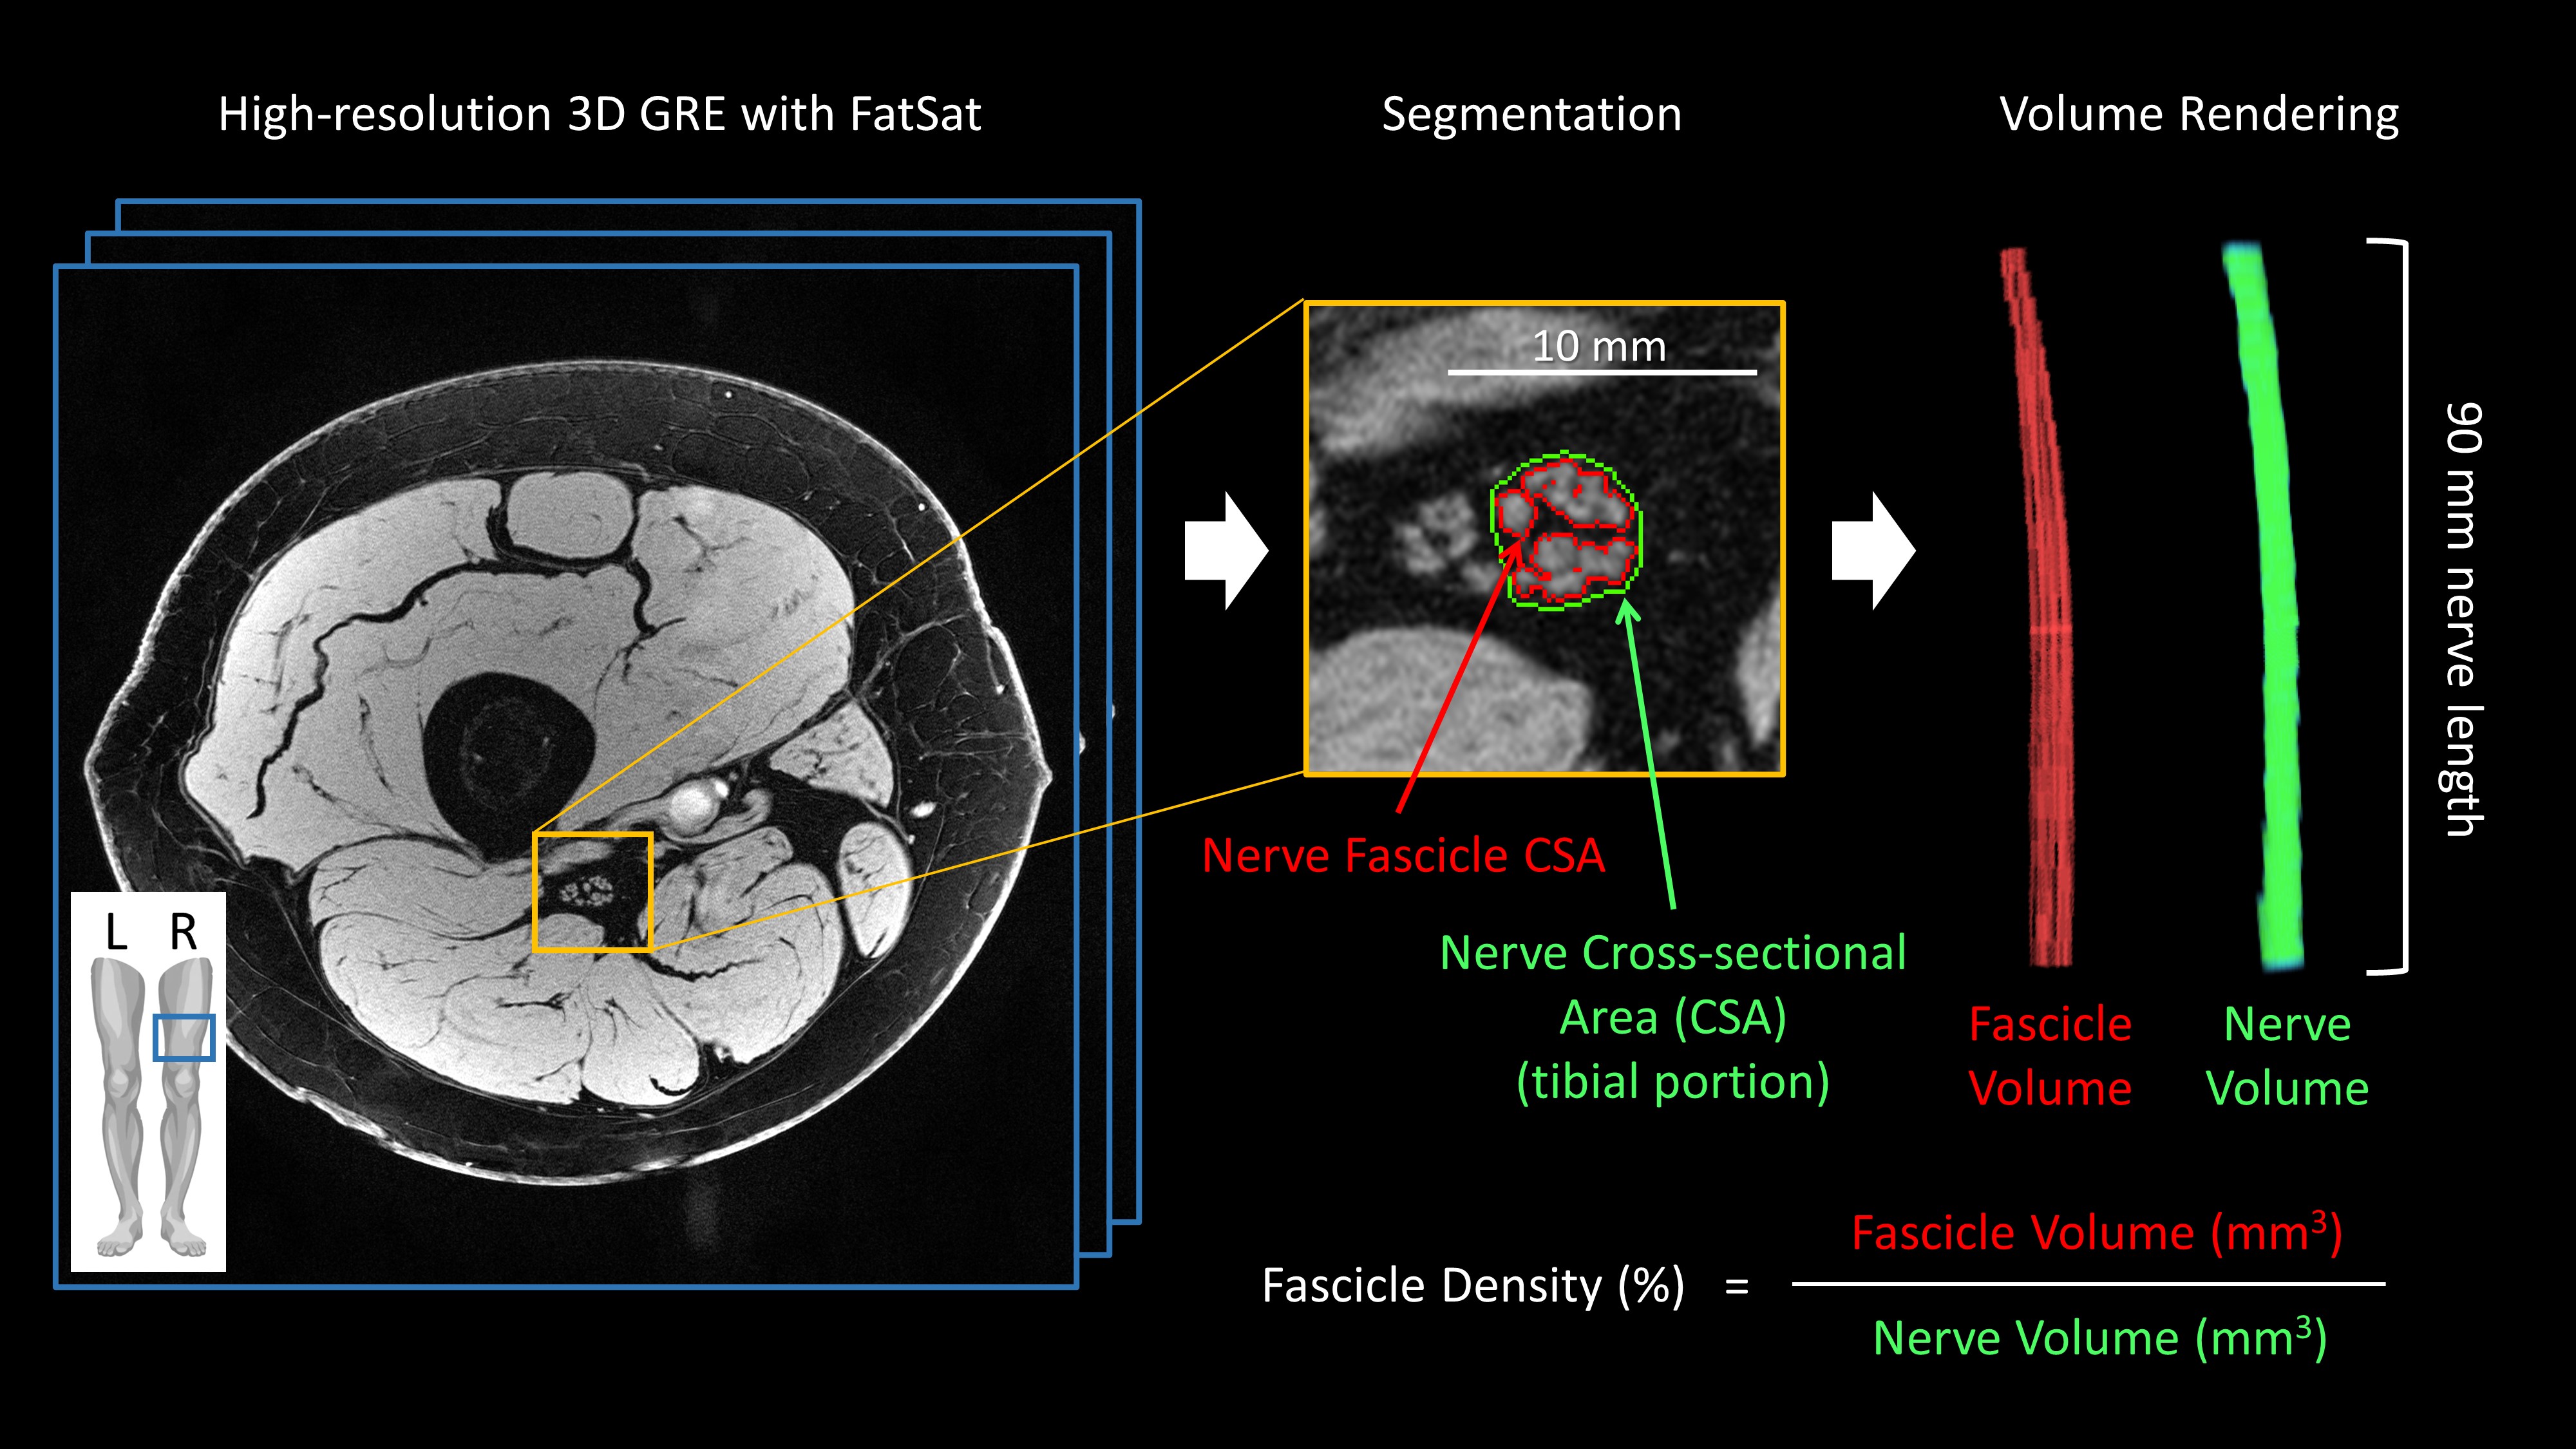
Figure 1. Representative image and illustrations of nerve morphometrics.
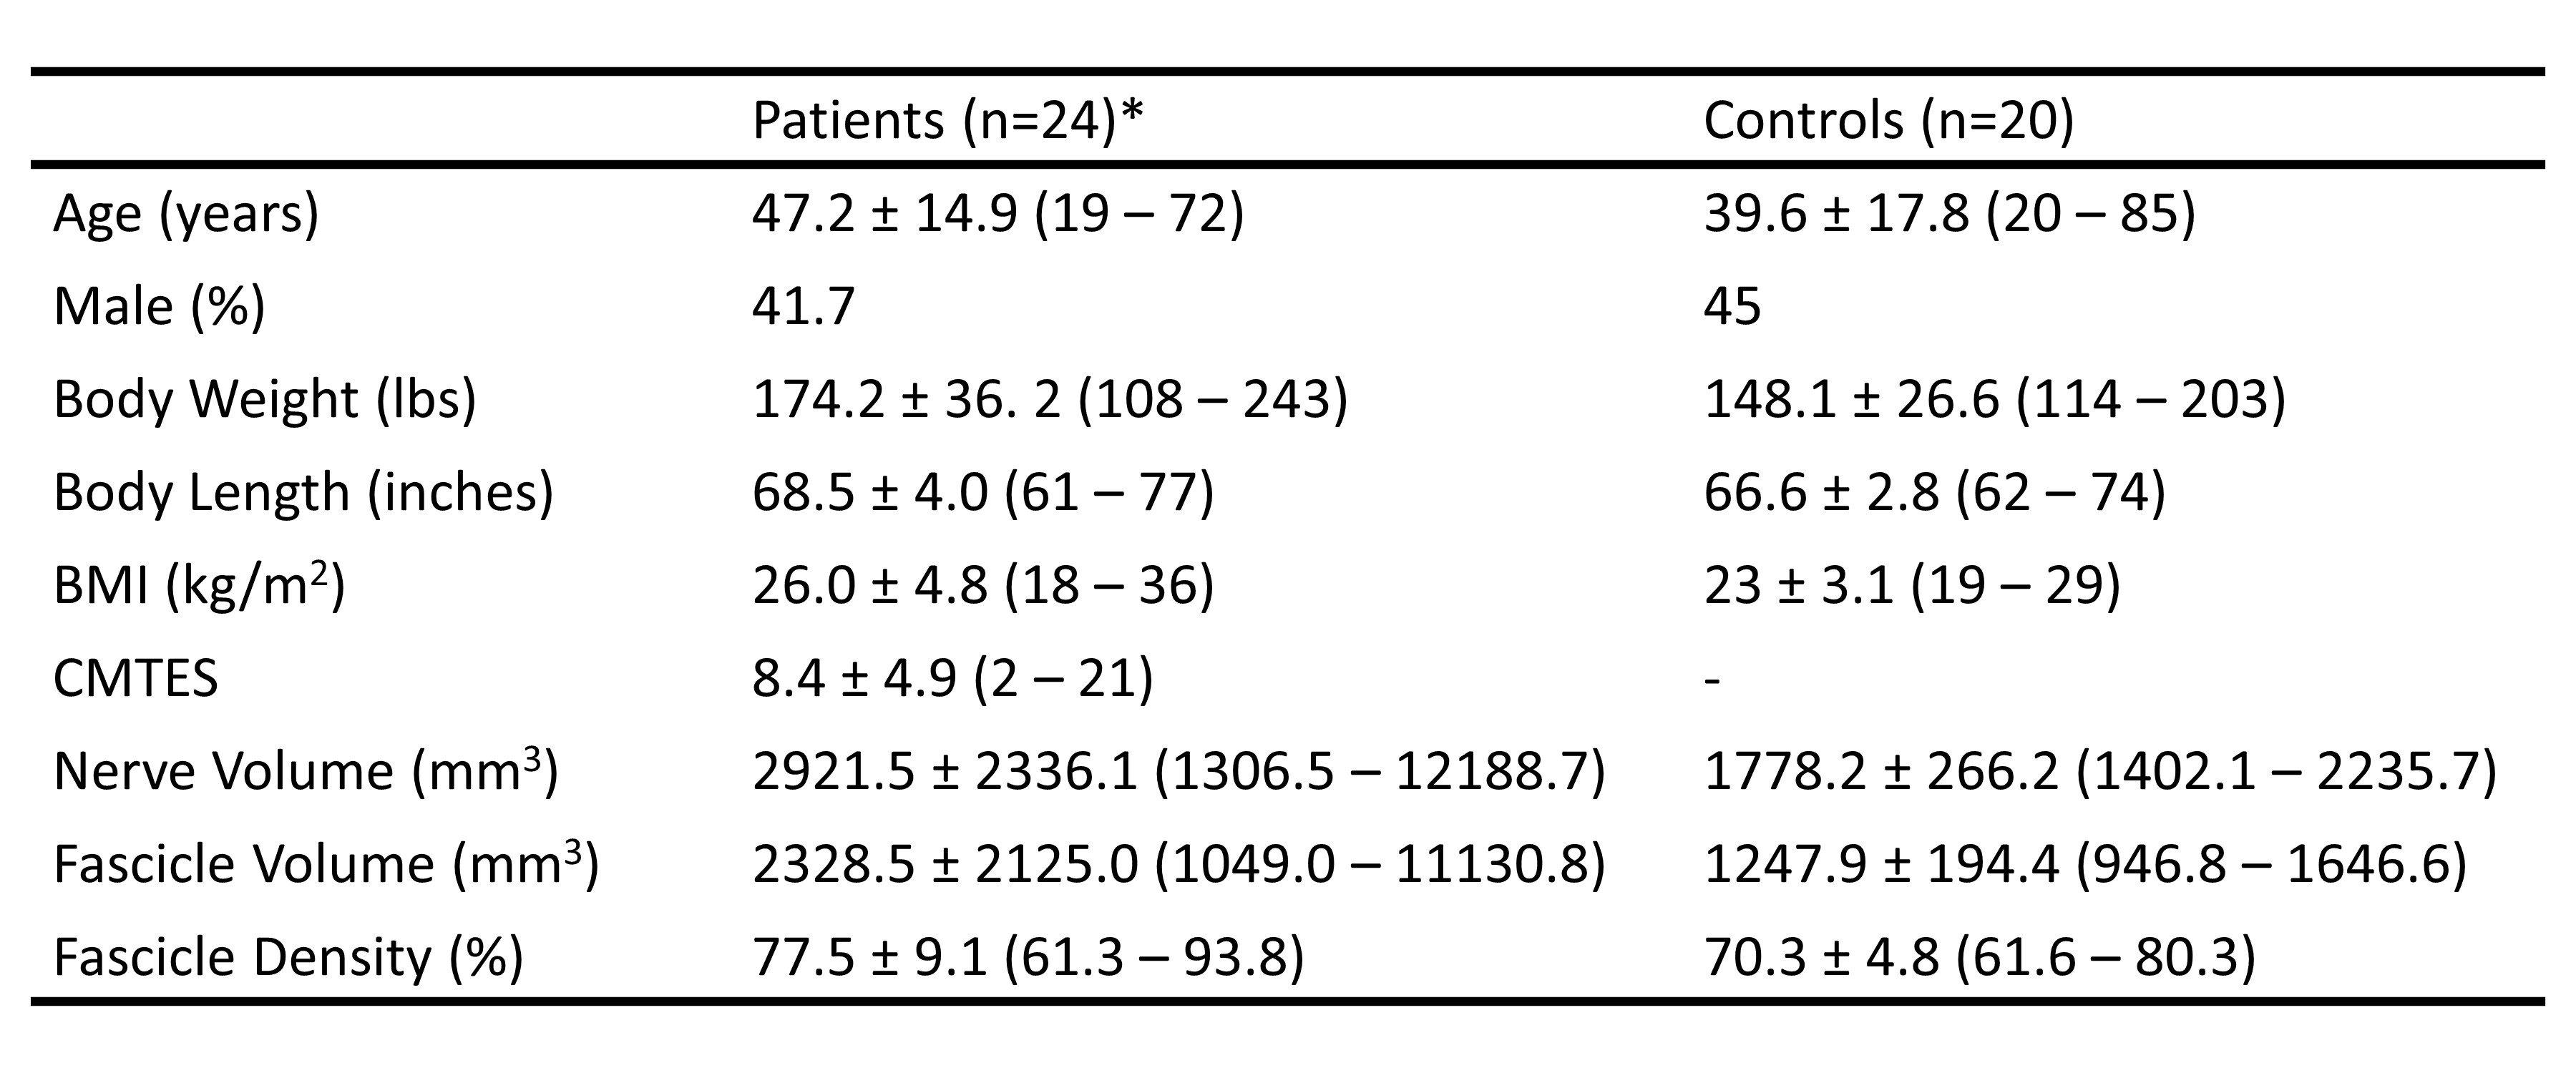
Figure 2. Summary demographic and MRI data. Data are mean ± standard deviation (minimum – maximum). *: The consecutively enrolled patient population was heterogeneous. Genetic and clinical data revealed that the population included persons with CMT1A, HNPP, CMT4J, CMT2O, Hereditary sensory neuropathy type-1C, CIDP, diabetic and idiopathic neuropathies. A subgroup of patients with HNPP (n=9) was analyzed separately.
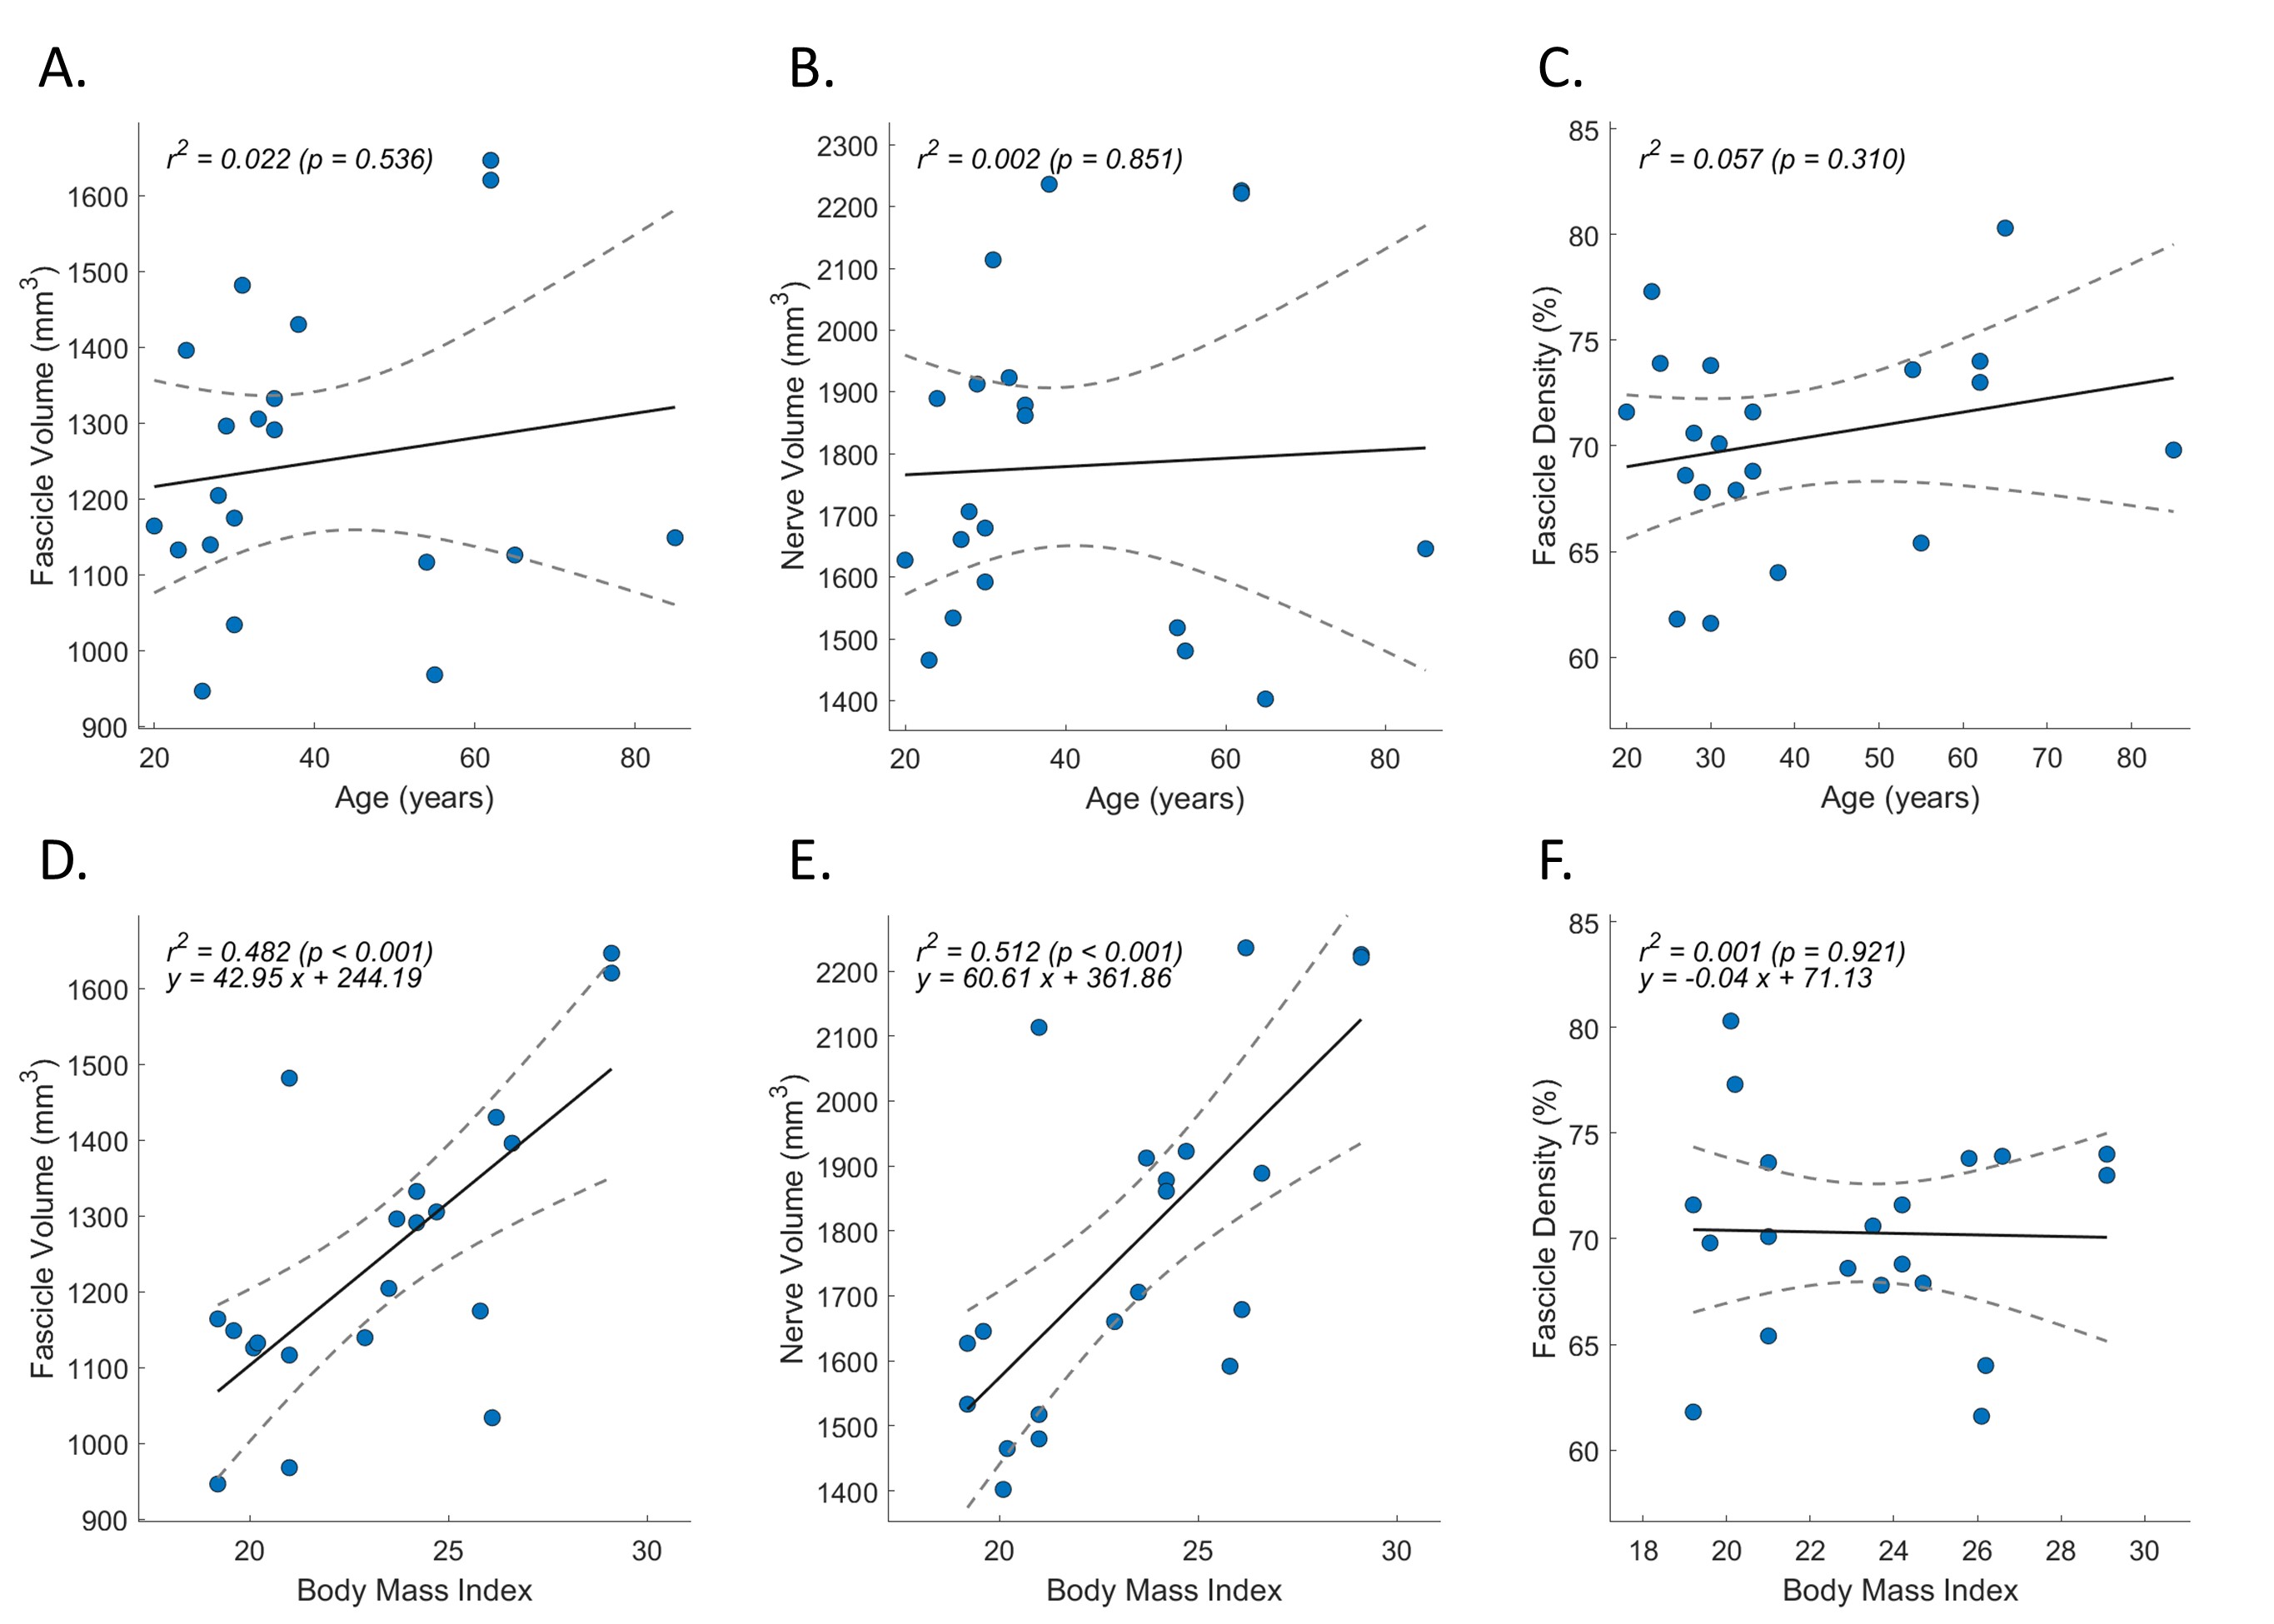
Figure 3. Normative data from healthy controls. Pearson correlations were analyzed for age (A to C) and body mass index (D to F), with fascicle volume (A, D), nerve volume (B, E), and fascicle density (C, F). The simple linear regression was presented as y = ax + b on the plots, where a was the slope and b was the intercept.
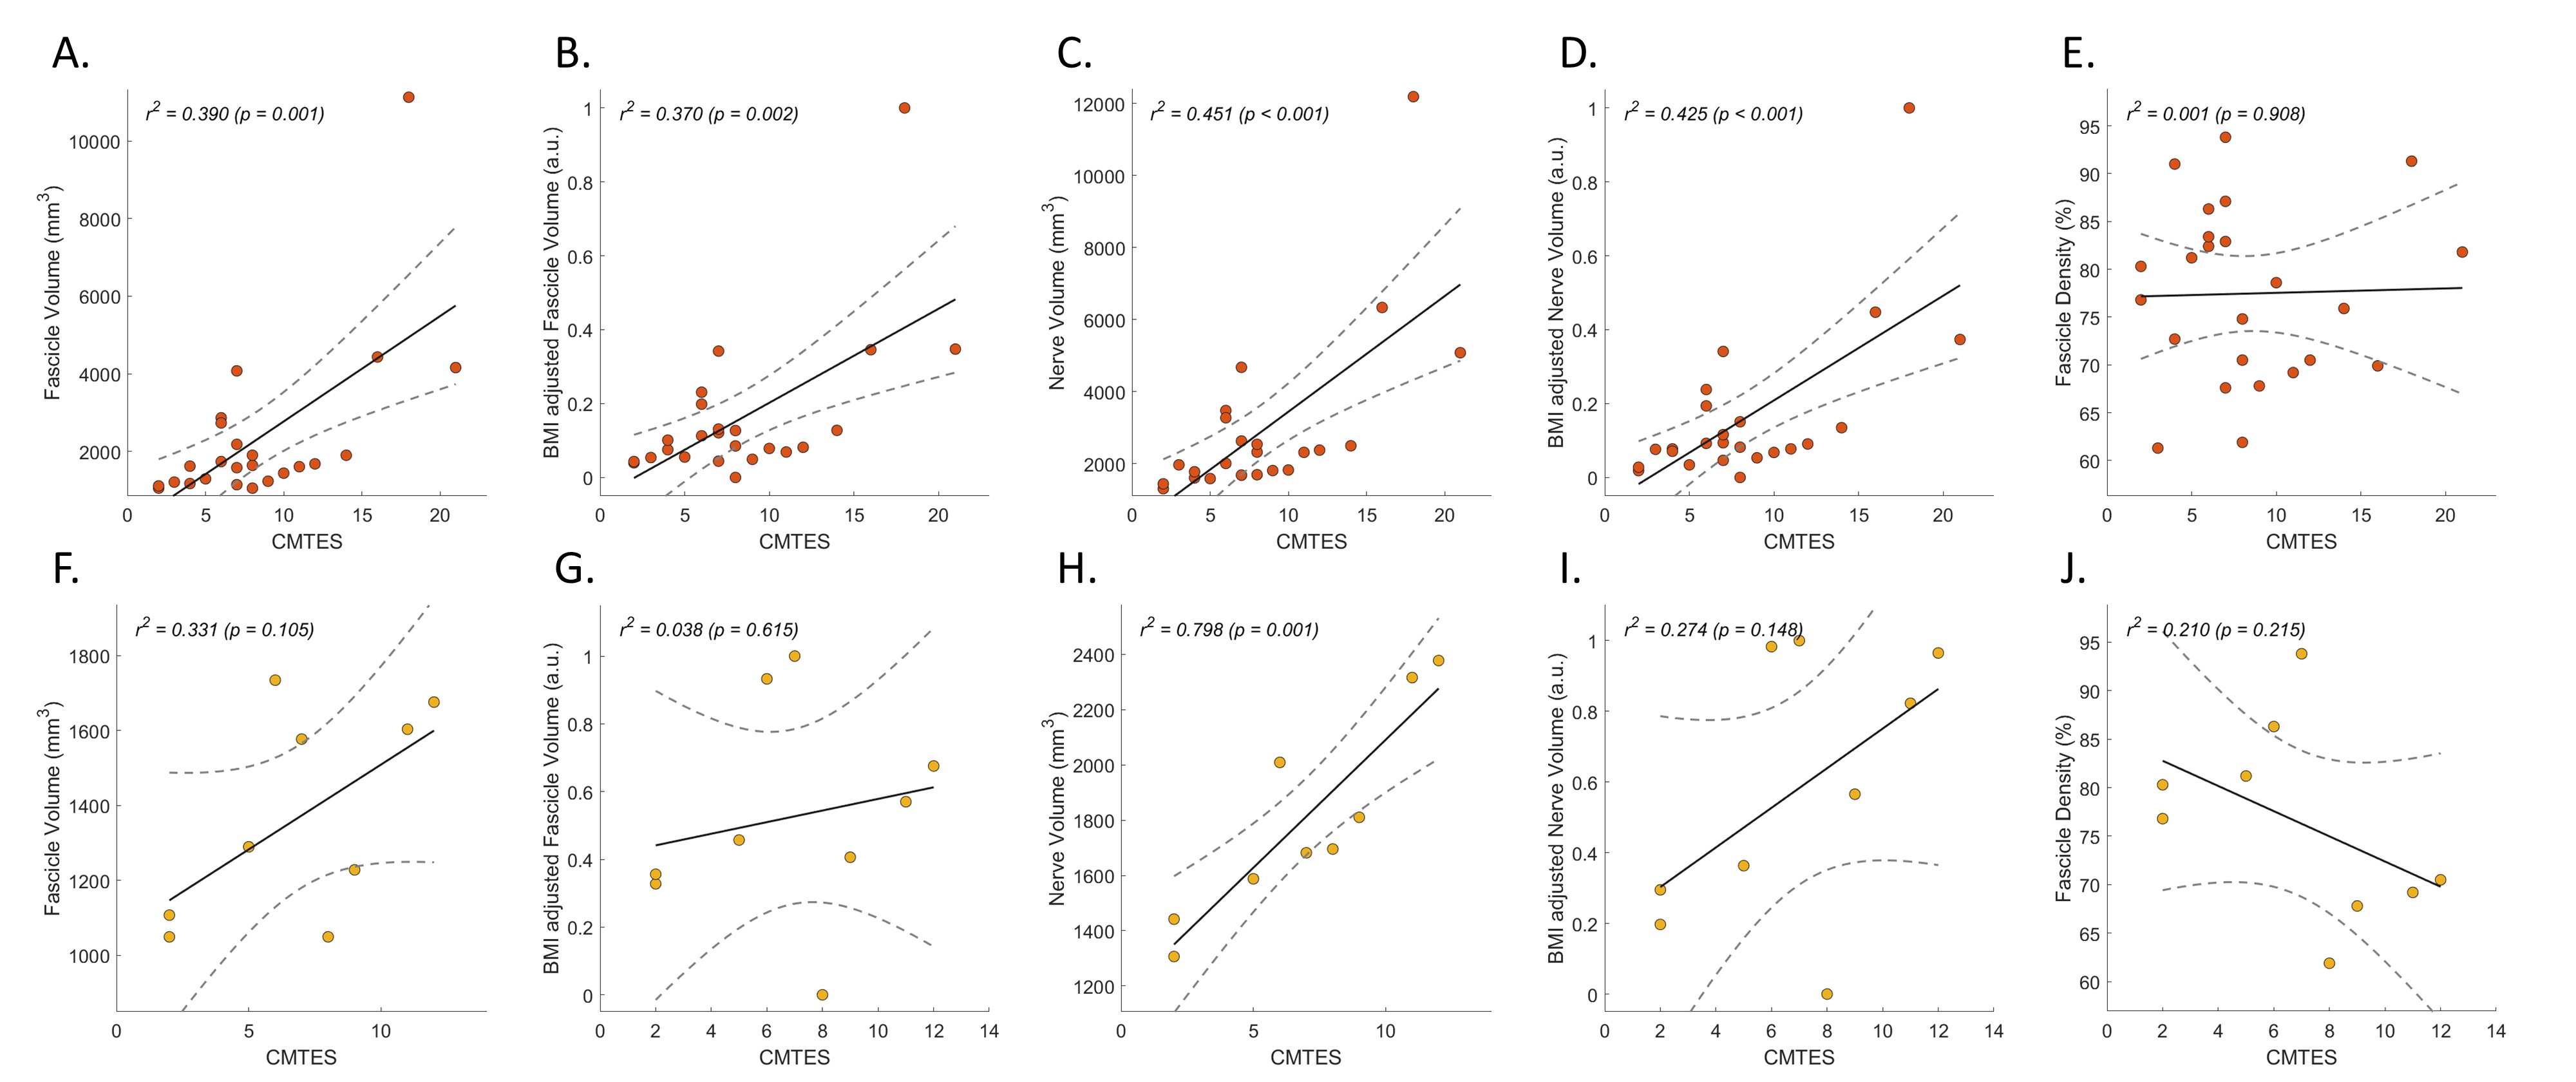
Figure 4. Pearson correlations between disease severity and nerve morphometrics. The clinical disease severity (CMTES) was correlated with nerve morphometrics for all patients’ data (A to E) and a subgroup of patients with HNPP (F to J). Correlation between CMTES and body mass index (BMI) adjusted fascicle volume (B, G) and nerve volume (D, I) were compared with those without BMI adjustment (A, F and C, H).
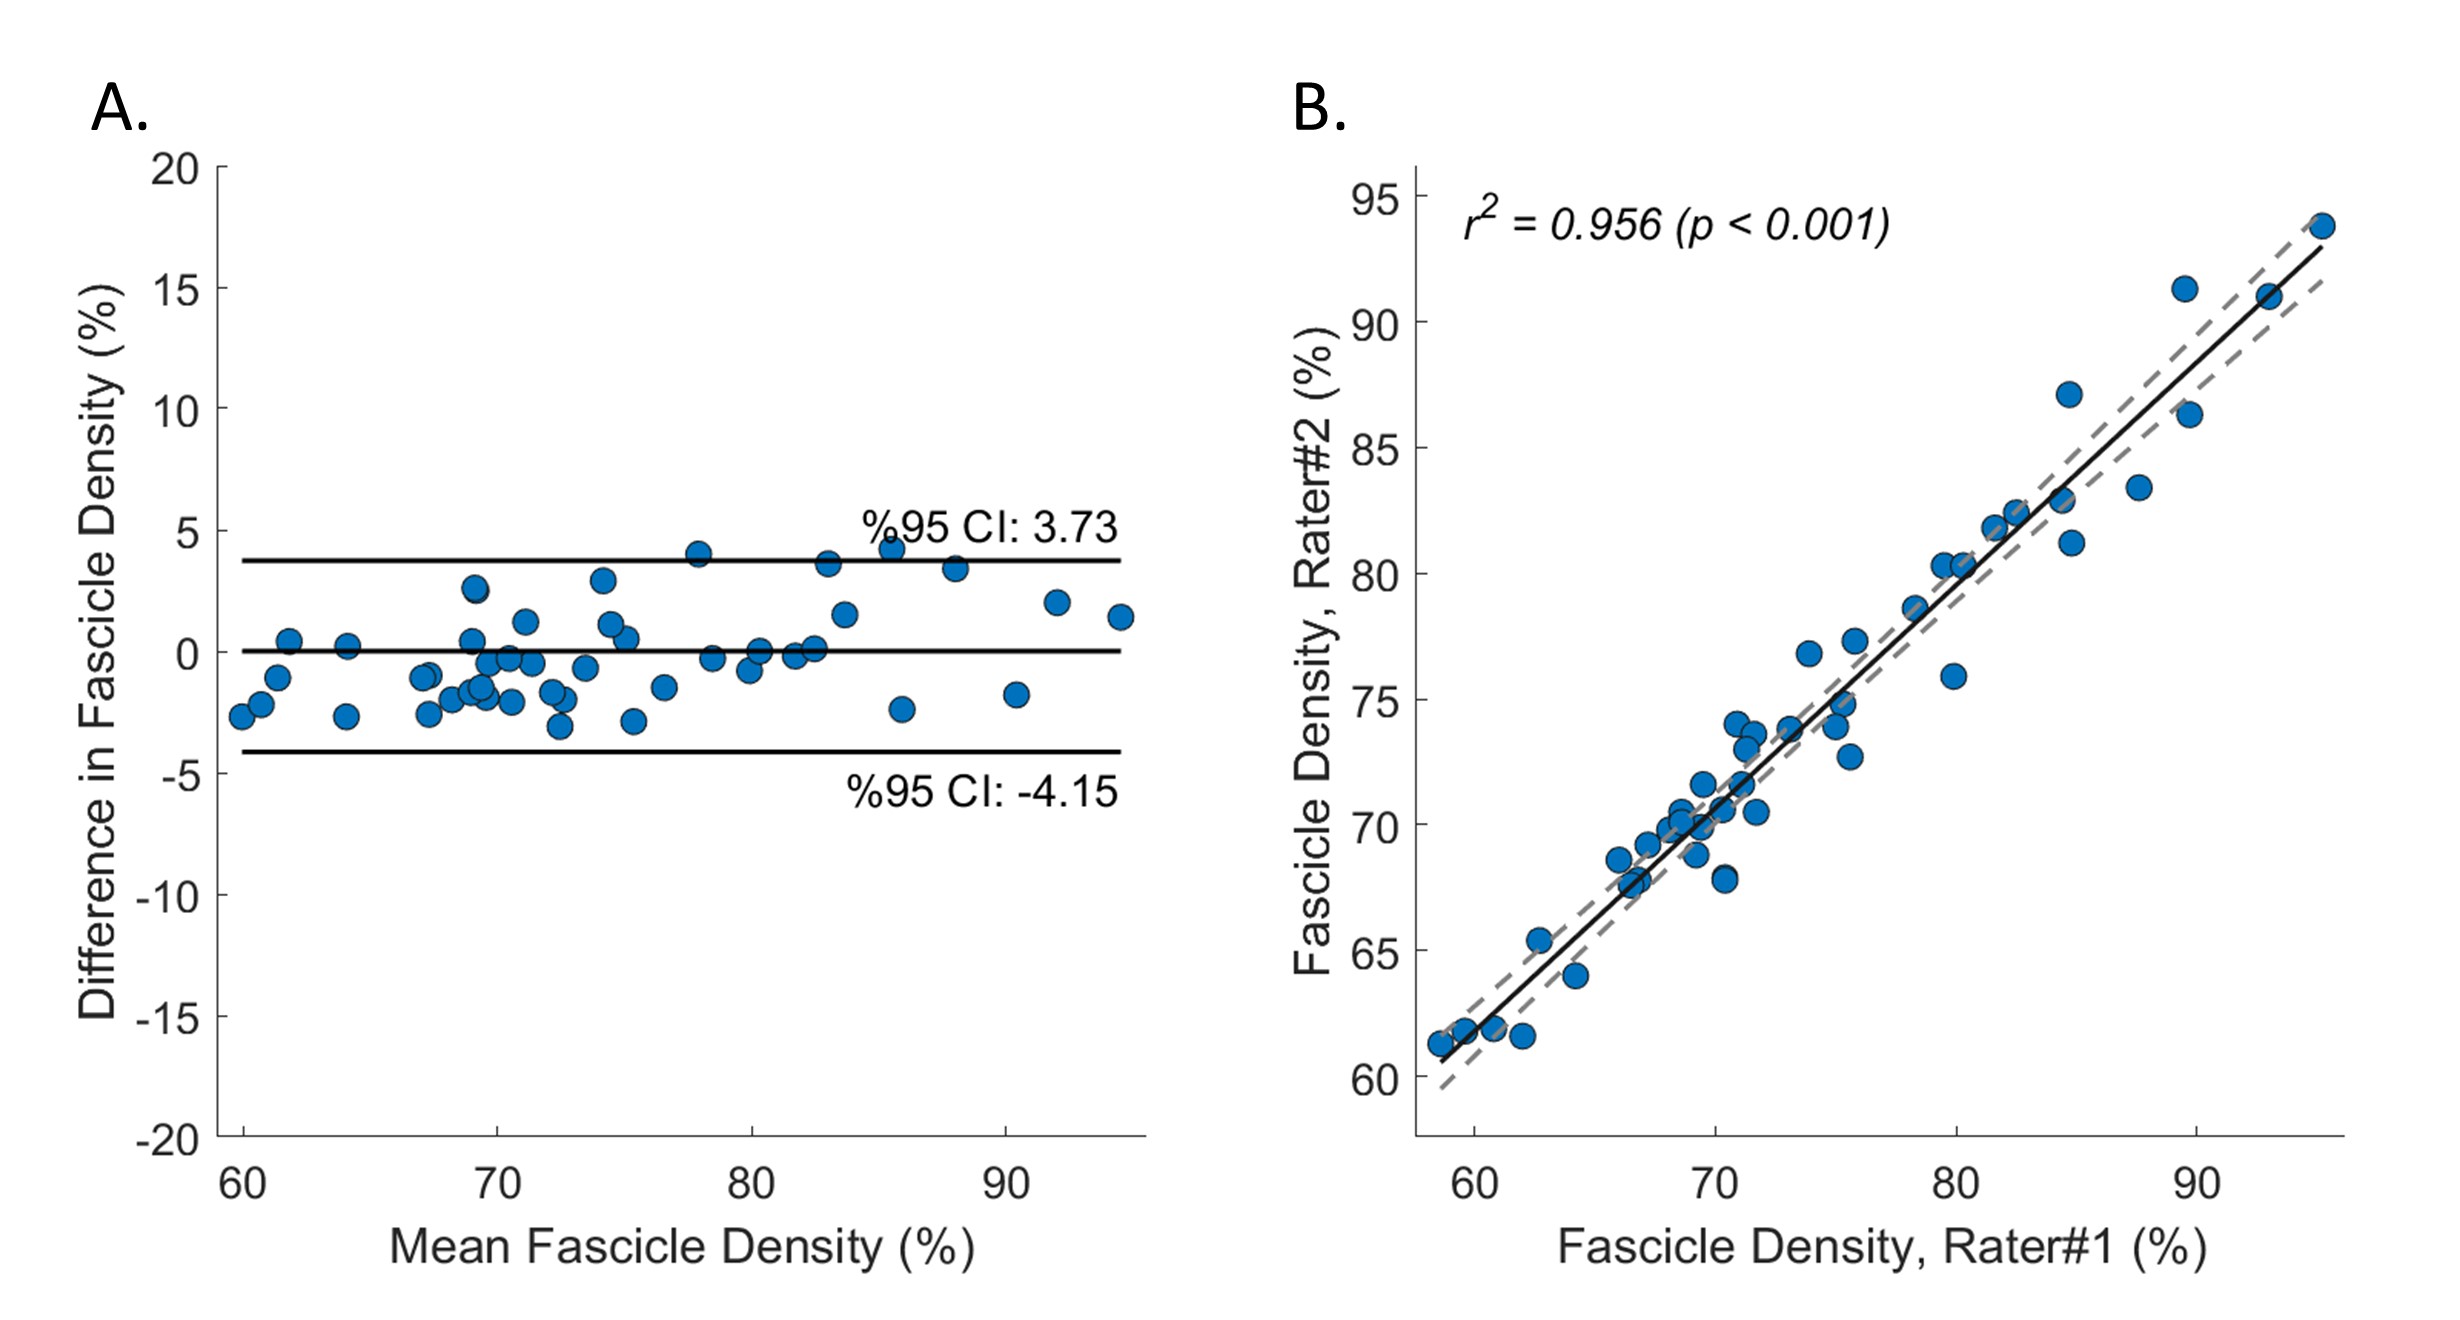
Figure 5. Inter-rater reliability. Two raters (Y.C. and A.B.) manually delineated the nerve boundaries independently. The consensus was made with retrospective review and discussion. Bland-Altman (A) and Pearson Correlation (B) analyses demonstrated excellent inter-rater reliability of the method.