3879
A Learning Method to Estimate Multi-compartmental T2 Distributions with low Data Requirements1Mathematics Department, Universidad de Guanajuato, Guanajuato, Mexico, 2Department of Chemical, Electronic and Biomedical Engineering, Division of Sciences and Engineering, University of Guanajuato, Leon, Mexico, 3Center of Research in Optics, Leon, Mexico, 4Signal Processing Lab 5 (LTS5), Ecole Polytechnique Fédérale de Lausanne, Lausanne, Switzerland, 5Radiology Department, Centre Hospitalier Universitaire Vaudois and University of Lausanne, Lausanne, Switzerland, 6Medical Image Analysis Laboratory, Center for Biomedical Imaging (CIBM), University of Lausanne, Lausanne, Switzerland, 7Institute of Neurobiology, Universidad Nacional Autonoma de Mexico, Juriquilla, Mexico, 8Computer Science, Centro de Investigación en Matemáticas A.C., Guanajuato, Mexico
Synopsis
The estimation of intravoxel distributions of T2 values based on multi-echo MR data is a challenging task. Interestingly, the information above is quite useful to detect damage on brain tissue, e.g. to estimate myelin-water-fraction changes associated with demyelination processes. Currently available methods typically require a long train of echoes, which are not always feasible to acquire. In this work we tackle this problem using state-of-the-art supervised learning convolutional networks to build a robust prediction model on very limited data ( 5 echoes and 4 TR). The methodology identifies myelin abnormalities in a rodent model of a neurological disorder with demyelination.
Introduction
The estimation of multi-compartment T2 distributions P(T2) from multi-echo MR data allows the determination of myelin fraction and therefore the identification of demyelination. The performance of classic inversion approaches has been investigated in recent studies1, as well as for approaches based on supervised learning techniques2. Those techniques require a long train of echoes (e.g. 60 measurements are reported in2). This proposal uses state-of-the-art artificial neural networks (ANN) and T2 decay synthetic signal generators to investigate the feasibility to enable a low-requirement, clinically-feasible acquisition setting for this problem. We use in-vivo data from rats with a genetically-defined neurological disorder named TAIEP3 characterized by mutant tubulin genes, conditioning de- and hypo-myelination of the CNS, along with atrophy of basal ganglia and cerebellum4.Methods
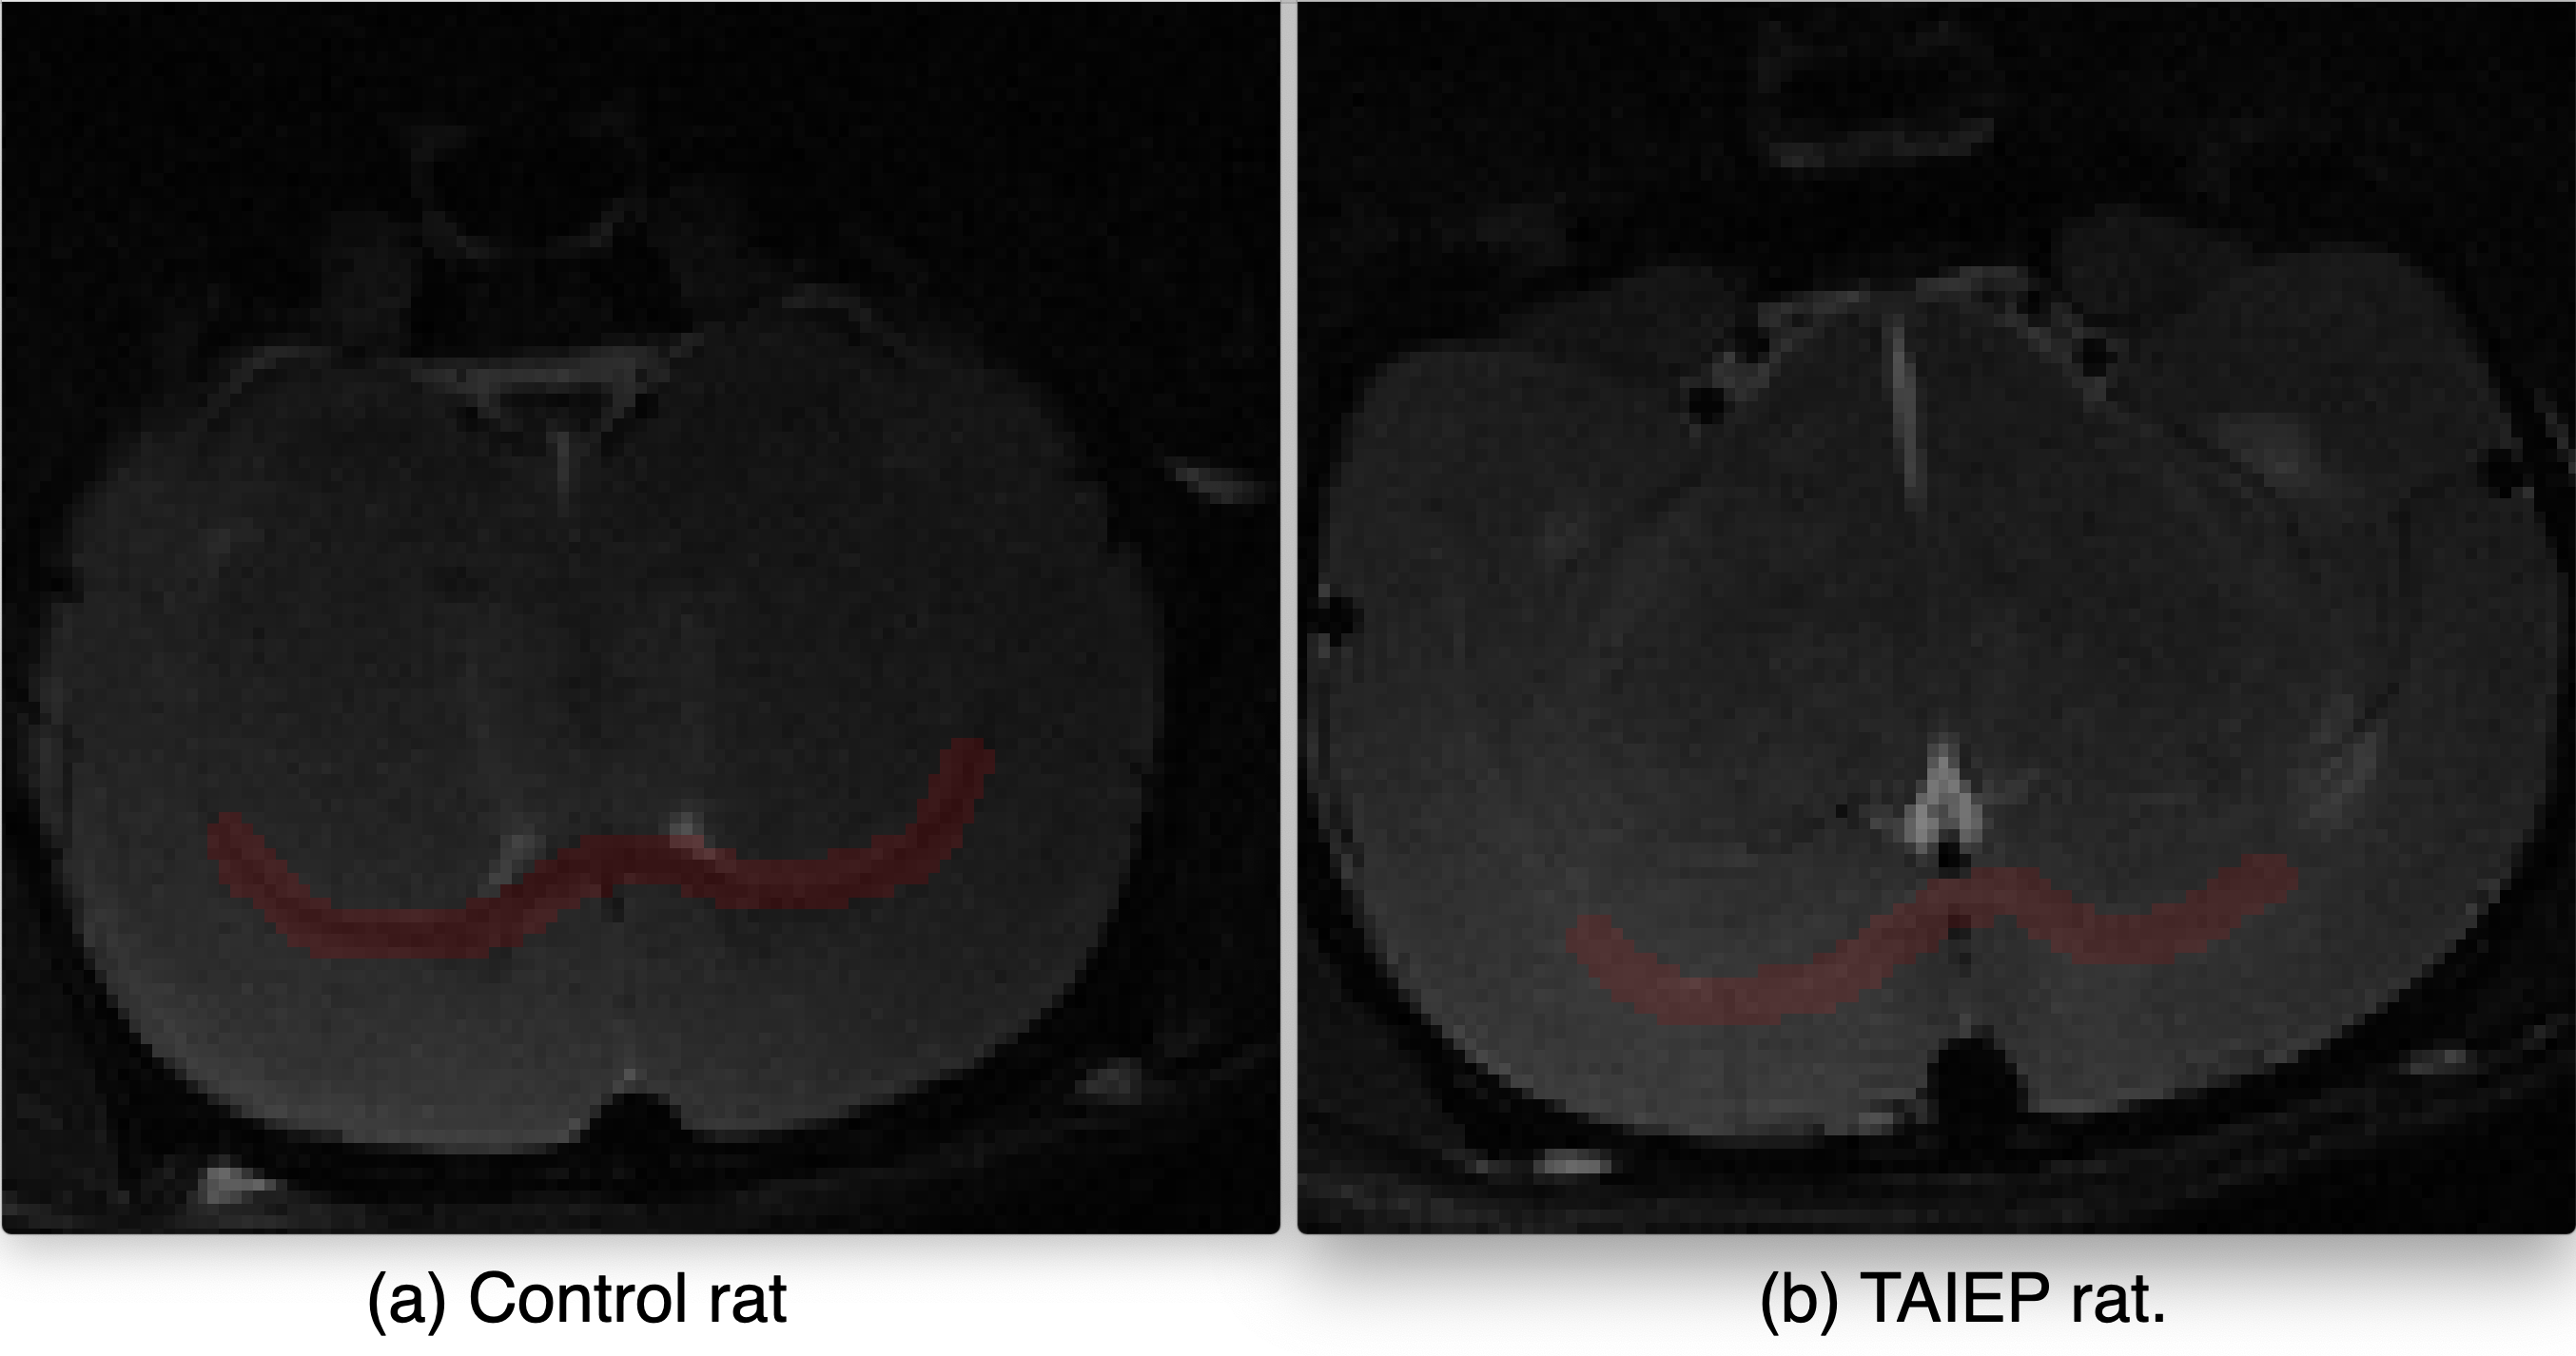
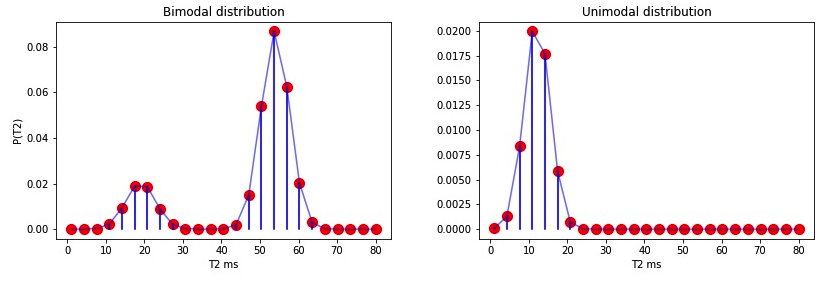
Rats (3 control, 3 TAIEP, all of them with 2 months of age) were scanned on a 7 T Bruker 70/16 US scanner, selecting a single coronal slice showing the corpus callosum with a plane resolution of 0.13 x 0.14 mm² and slice thickness of 1 mm. Five echos were acquired (TE = {7,21,35,49,63} ms) for each of 4 different repetition times TR = {800,1500,3000,5000} ms . The white matter analysis was carried out on the corpus callosum of the rats, see Figure 1.The first step is to create a training database of MR signals from multi-echo T2 based on the protocol, we use the function EPG in the toolbox in5 such that the MR signal is defined as $$S(TE_i) = M_0 \int EPG(TE_i, T1, T2, \alpha) P(T2) d T2.$$ T1 values were selected with uniform distribution $$$\mathcal{U}$$$(1500ms,2200ms) as observed on the control rats on gray and white matter. The refocusing angles, $$$\alpha$$$, are generated in $$$\mathcal U$$$(90º,180º)2. In synthetic signals, $$$M_0=1$$$ and the real signals are normalized to their maximum value to eliminate this scaling effect. $$$P(T2)$$$ is parametrized with domain in [1, 80]ms to cover for T2 values associated with myelin and intra/extracellular water spaces at 7 Tesla, see6. A discretization of 25 bins is used for $$$P(T2)$$$, see Figure 2. $$$P(T2)$$$ training samples were generated as one or two (randomly selected) Gaussian modes with mean values in $$$\mathcal{U}$$$(1ms, 80ms) and standard deviation in $$$\mathcal{U}$$$(2,4)ms. We added Gaussian noise with SNR = 40 to all the synthetic signals (the SNR was estimated on homogeneous ROIs in the ex vivo rodent data). We created 500000 synthetic signals to train the learning model by randomly sampling the uniform distributions for the parameters above.
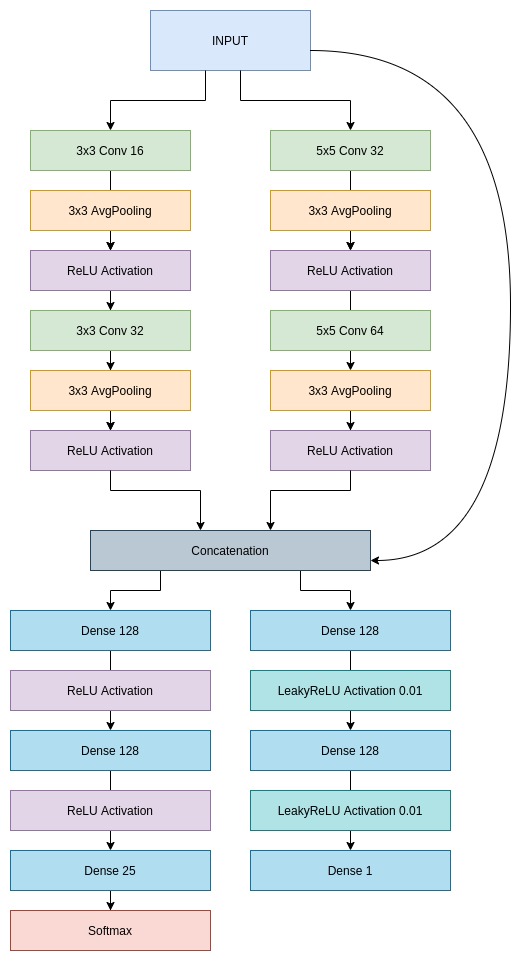
For the inference machine, we propose a novel Deep Learning architecture called ConvMIML, based on a Convolutional Neural Network (CNN) model. This architecture corresponds to a multitask neural network, where only the weights corresponding to the convolution layers are shared between the two tasks (estimation of discrete $$$P(T2)$$$ and $$$\alpha$$$). In the final layers, we have two separate heads, one for each task. The architecture of the ConvMIML model is presented in Figure 3. The network combines the input data with the information obtained from the convolutions to avoid gradient vanishing. To compute the refocusing angle $$$\alpha$$$ we use LeakyReLU activation functions because empirically proved to improve the performance in the estimation of this parameter. For the distribution $$$P(T2)$$$ estimation task, we use half of the artificial neurons in the last layers of the MIML model described in2. The lost function was set as a convex combination (weights equal to 0.55 and 0.45) of the Wasserstein distance and the mean squared error for $$$P(T2)$$$, and the L1 distance for $$$\alpha$$$. 400 epochs were used in the training, the batch size was 100. The optimizer was Adadelta.
Experiments and Results
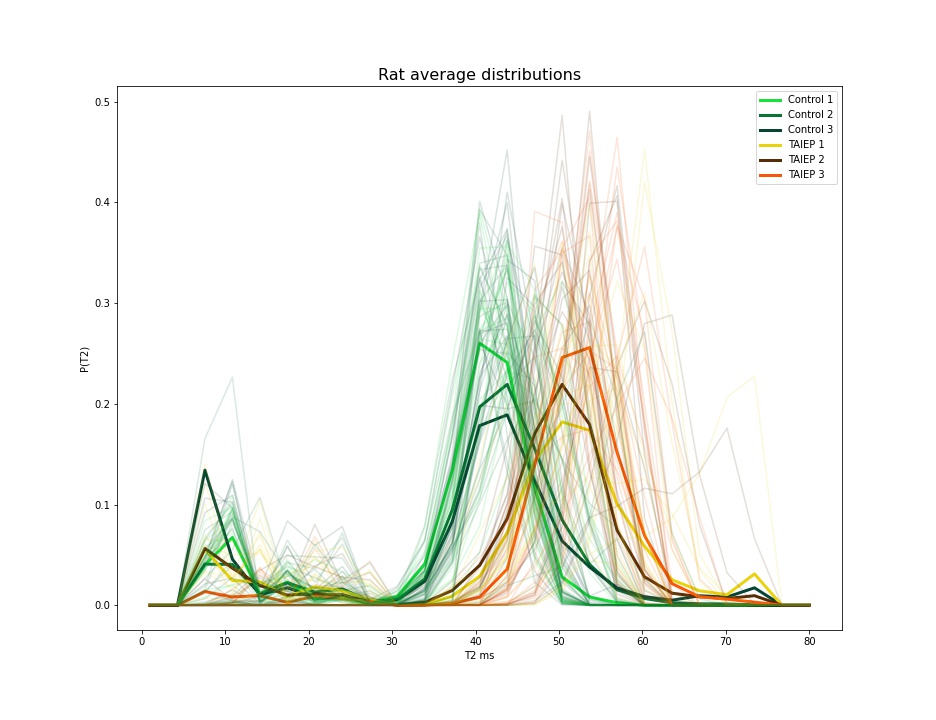
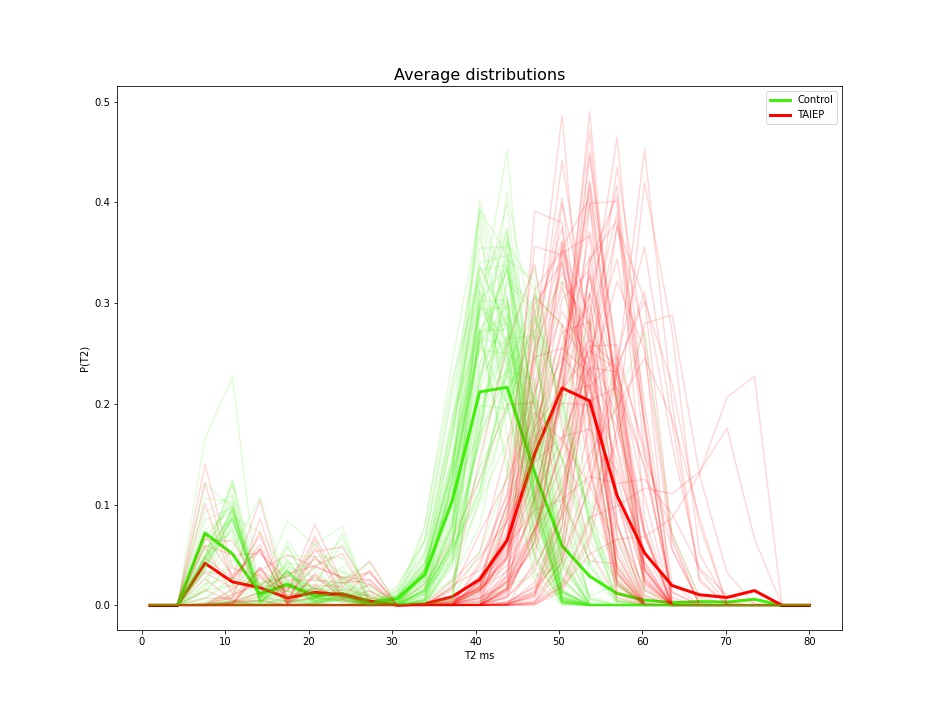
The ConvMIML presented a very well learning efficiency in the synthetic data presenting a small average value for the lost function equal to 7.4, visual inspection of the inferred samples was carried out to evaluate the correct performance of the learning algorithm. Then, the learning method was used to infer the $$$P(T2)$$$ distributions on the rat population, the individual distributions (transparent lines), as well as the average distribution per rat (tick lines), are shown in Figure 4. The averaged distribution (tick colored lines) of the same condition (control or TAIEP) for all the voxels (transparent lines) in the population is shown in Figure 5.Discussion
Figures 4 and 5 indicate that the recovered distributions are quite stable for each one of the two conditions.Control animals present a short-lived T2 component centered around 10 ms (generally associated with myelin8,9,10), and a second component at around 40 ms. Rats with TAIEP consistently present a reduction in the volume of the first component, likely indicating demyelination, and a displacement to the right to the second lobe (shifted to 55 ms, potentially a result of inflammation7). These results are in line with what we expect from a demyelinating disorder, as for instance in multiple sclerosis8,9,10.
Conclusions
Our experiments indicate that the use of state-of-the-art supervised learning methods can reduce the number of images required to estimate multi-compartment T2 distributions. The natural extension of this work is to identify the minimum amount of data required to ensure the robustness of the estimations.Acknowledgements
DVA was supported by a CIMAT A.C. scholarship. ARM was partially supported by CONACyT-Mexico. LC was partially funded by UNAM-DGAPA-PAPIIT (IN204720).References
1. Erick J. Canales-Rodríguez, Marco Pizzolato et al. Comparison of non-parametric T2 relaxometry methods for myelin water quantification. Med. Imag. Analy. 2021. 69(1). 1-13.
2. Thomas Yu, Erick J. Canales-Rodrígueza, Marco Pizzolato et al. Model-informed machine learning for multi-component T2 relaxometry. Med. Imag. Analy. 2021. 69(1). 1-19.
3. Holmgren, B., Urbá-Holmgren, R., Riboni, L., and Vega-SaenzdeMiera, E. C. (1989). Sprague Dawley rat mutant with tremor, ataxia, tonic immobility episodes, epilepsy and paralysis. Lab. Anim. Sci. 39, 226-228.
4. Garduno-Robles A, Alata M, Piazza V, Cortes C, Eguibar JR, Pantano S, et al. MRI Features in a rat model of H-ABC tubulinopathy. Front Neurosci. (2020) 14:555.
5. Erick J. Canales-Rodríguez. Multicomponent T2-toolbox. https://github.com/ejcanalesr/multicomponent-T2-toolbox/ Accessed November 10, 2021.
6. de Graaf R.A., Brown P.B., McIntyre S., et al. High magnetic field water and metabolite proton T1 and T2 relaxation in rat brain in vivo. Magn. Reson. Med. 2006. 56(1).386-394.
7. Ewa E. Odrobina, Toby Y. J. Lam, et al. MR properties of excised neural tissue following experimentally induced demyelination. NMR in Biomedicine. 2005. 18(5). 277-284.
8. C. Laule, E. Leung, et al. Myelin water imaging in multiple sclerosis: quantitative correlations with histopathology. Multiple Sclerosis J.(2006)12 (6).747-753.
9. C. Laule, I. M. Vavasour, et al. Long T2 water in multiple sclerosis: what else can we learn from multi-echo T2 relaxation? J. Neurol. 2007. 254(11).1579-1587.
Figures