3875
White Matter Tract Microstructure Influences Semantic Memory & Emotion Perception Performance in the HCP Dataset1Department of Neurosurgery, Brigham and Women’s Hospital, Boston, MA, United States, 2Speech and Hearing Bioscience and Technology, Harvard Medical School, Boston, MA, United States, 3Department of Radiology, Brigham and Women’s Hospital, Boston, MA, United States, 4Department of Anatomy and Neurobiology, Boston University School of Medicine, Boston, MA, United States, 5Department of Psychiatry and Neurology, A. Martinos Center for Biomedical Imaging, Boston, MA, United States, 6School of Computer Science, University of Sydney, Sydney, Australia, 7Harvard College, Cambridge, MA, United States, 8Department of Neurology, Emory University School of Medicine, Atlanta, GA, United States, 9Department of Pediatrics, Emory University School of Medicine, Atlanta, GA, United States, 10Department of Neurology, University of Washington School of Medicine, Seattle, WA, United States, 11Psychiatry Neuroimaging Laboratory, Department of Psychiatry, Brigham and Women's Hospital, Boston, MA, United States
Synopsis
Using dMRI and behavioral data from 809 participants in the Human Connectome Project, we examined how the microstructure of the white matter (WM) association tracts influences performance on assessments of semantic memory and emotion perception. WM tracts were extracted and measured using an automated WM tract atlas. We found the microstructure of left hemisphere tracts influenced semantic memory, while that of right hemisphere tracts influenced emotion perception performance. Furthermore, the microstructure of the left arcuate fasciculus influenced performance on both assessments. Our findings suggest WM tract microstructure relates to the opposing hemispheric dominance of language and theory of mind processing.
Introduction
Language and theory of mind (ToM) are important cognitive abilities that allow for the successful interpretation and expression of meaning. While functional MRI investigations are able to consistently localize language and ToM to specific cortical regions 1–6, diffusion MRI (dMRI) investigations point to an inconsistent and sometimes overlapping set of white matter (WM) tracts correlated with these two cognitive domains 7–11. Previous studies have utilized small sample sizes that often include neuropsychiatric populations (e.g., patients with epilepsy, psychosis, autism, dementia, etc.). Additionally, most studies have focused on either language or ToM, with very few studies examining both cognitive capacities together 11,12. In this study, we examine which WM tracts may work to support the language network and which WM tracts may support the ToM network using a large neuroimaging and behavioral dataset of healthy adults, the Human Connectome Project (HCP).Methods
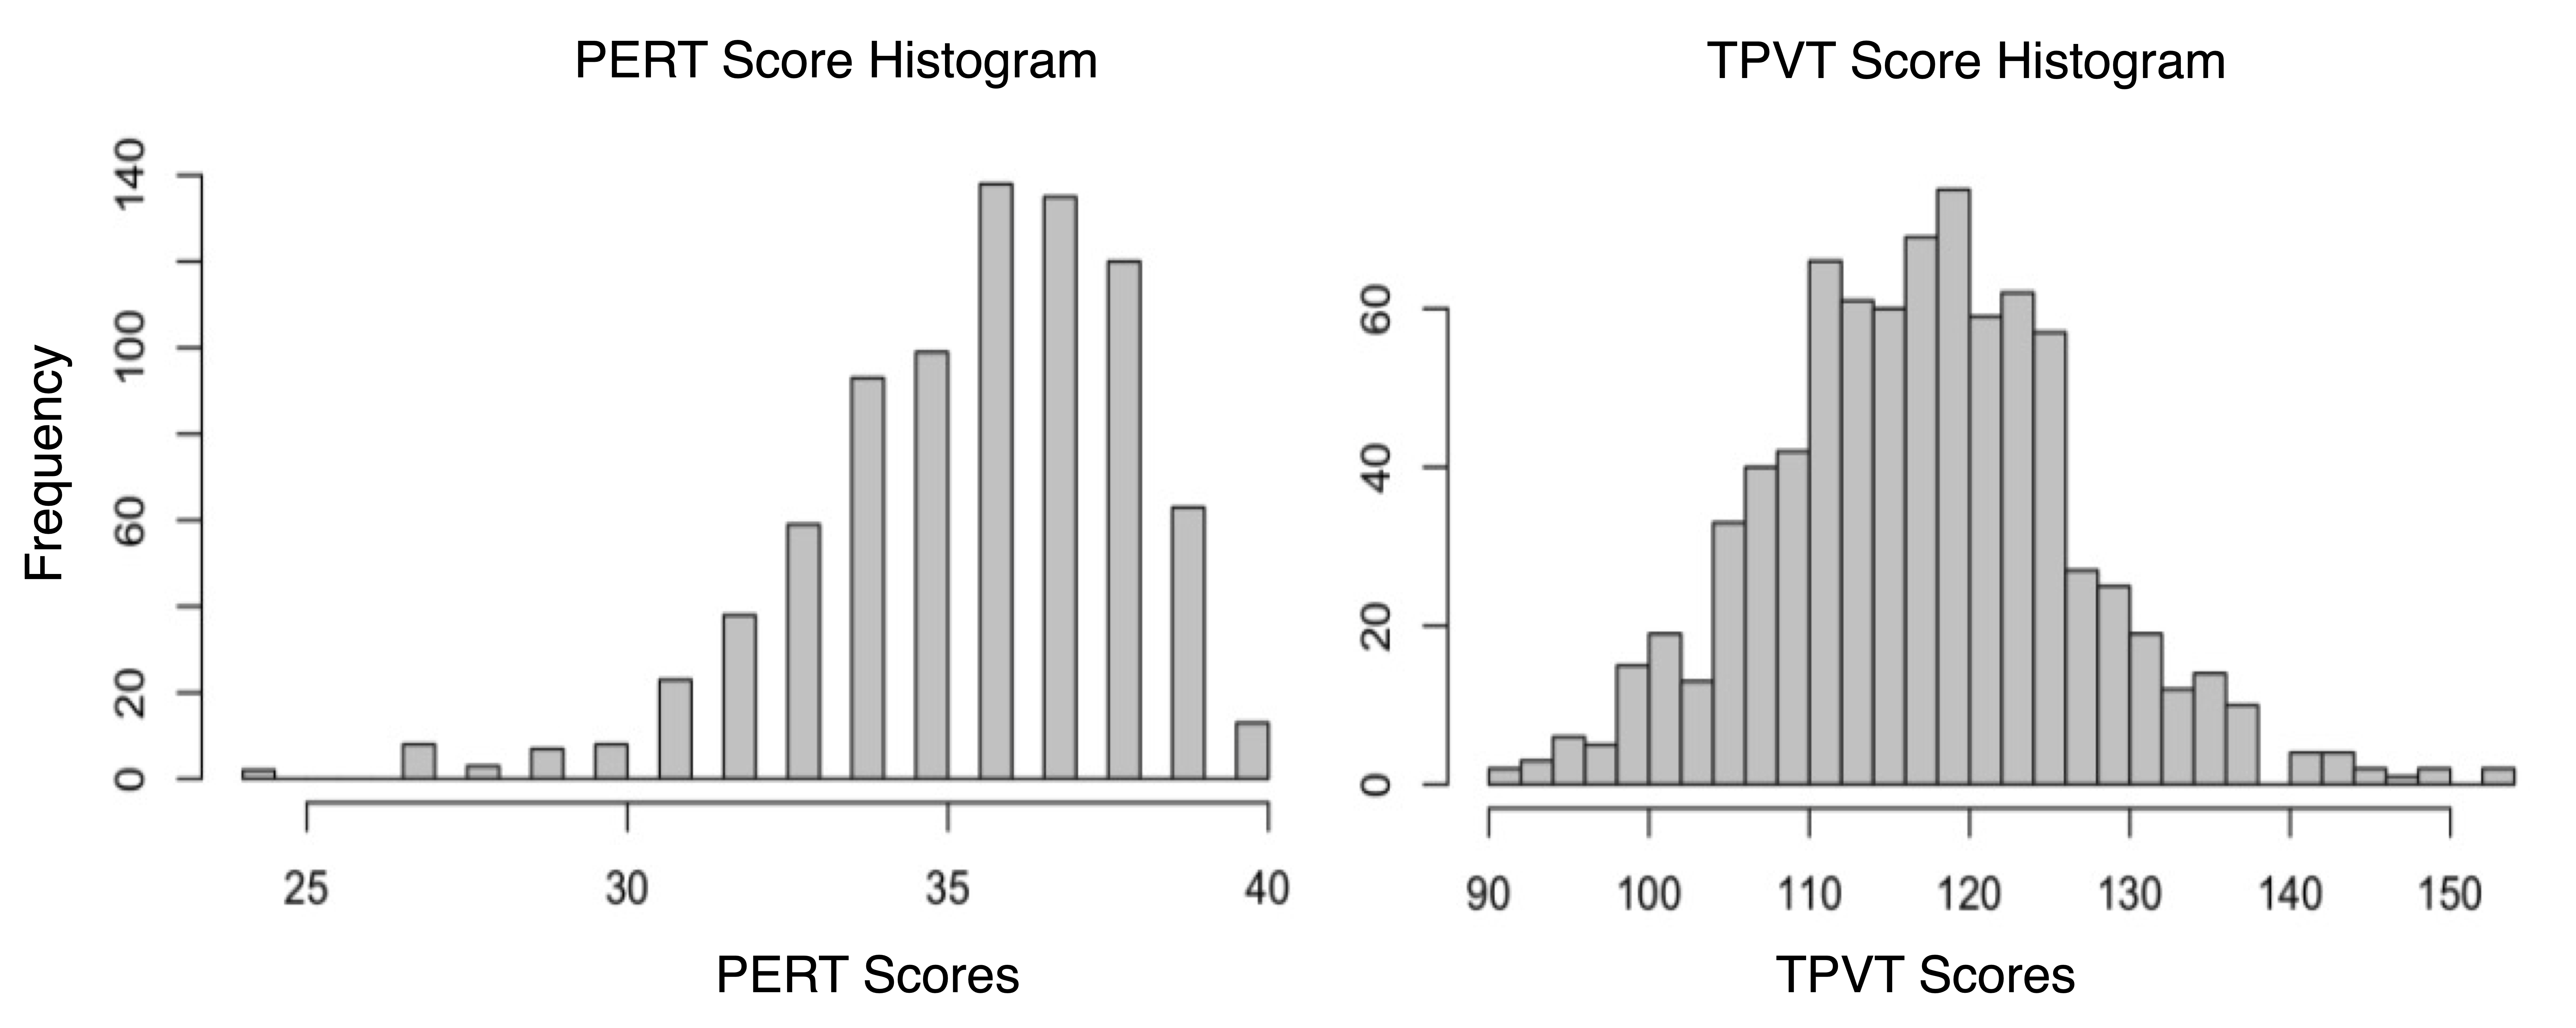
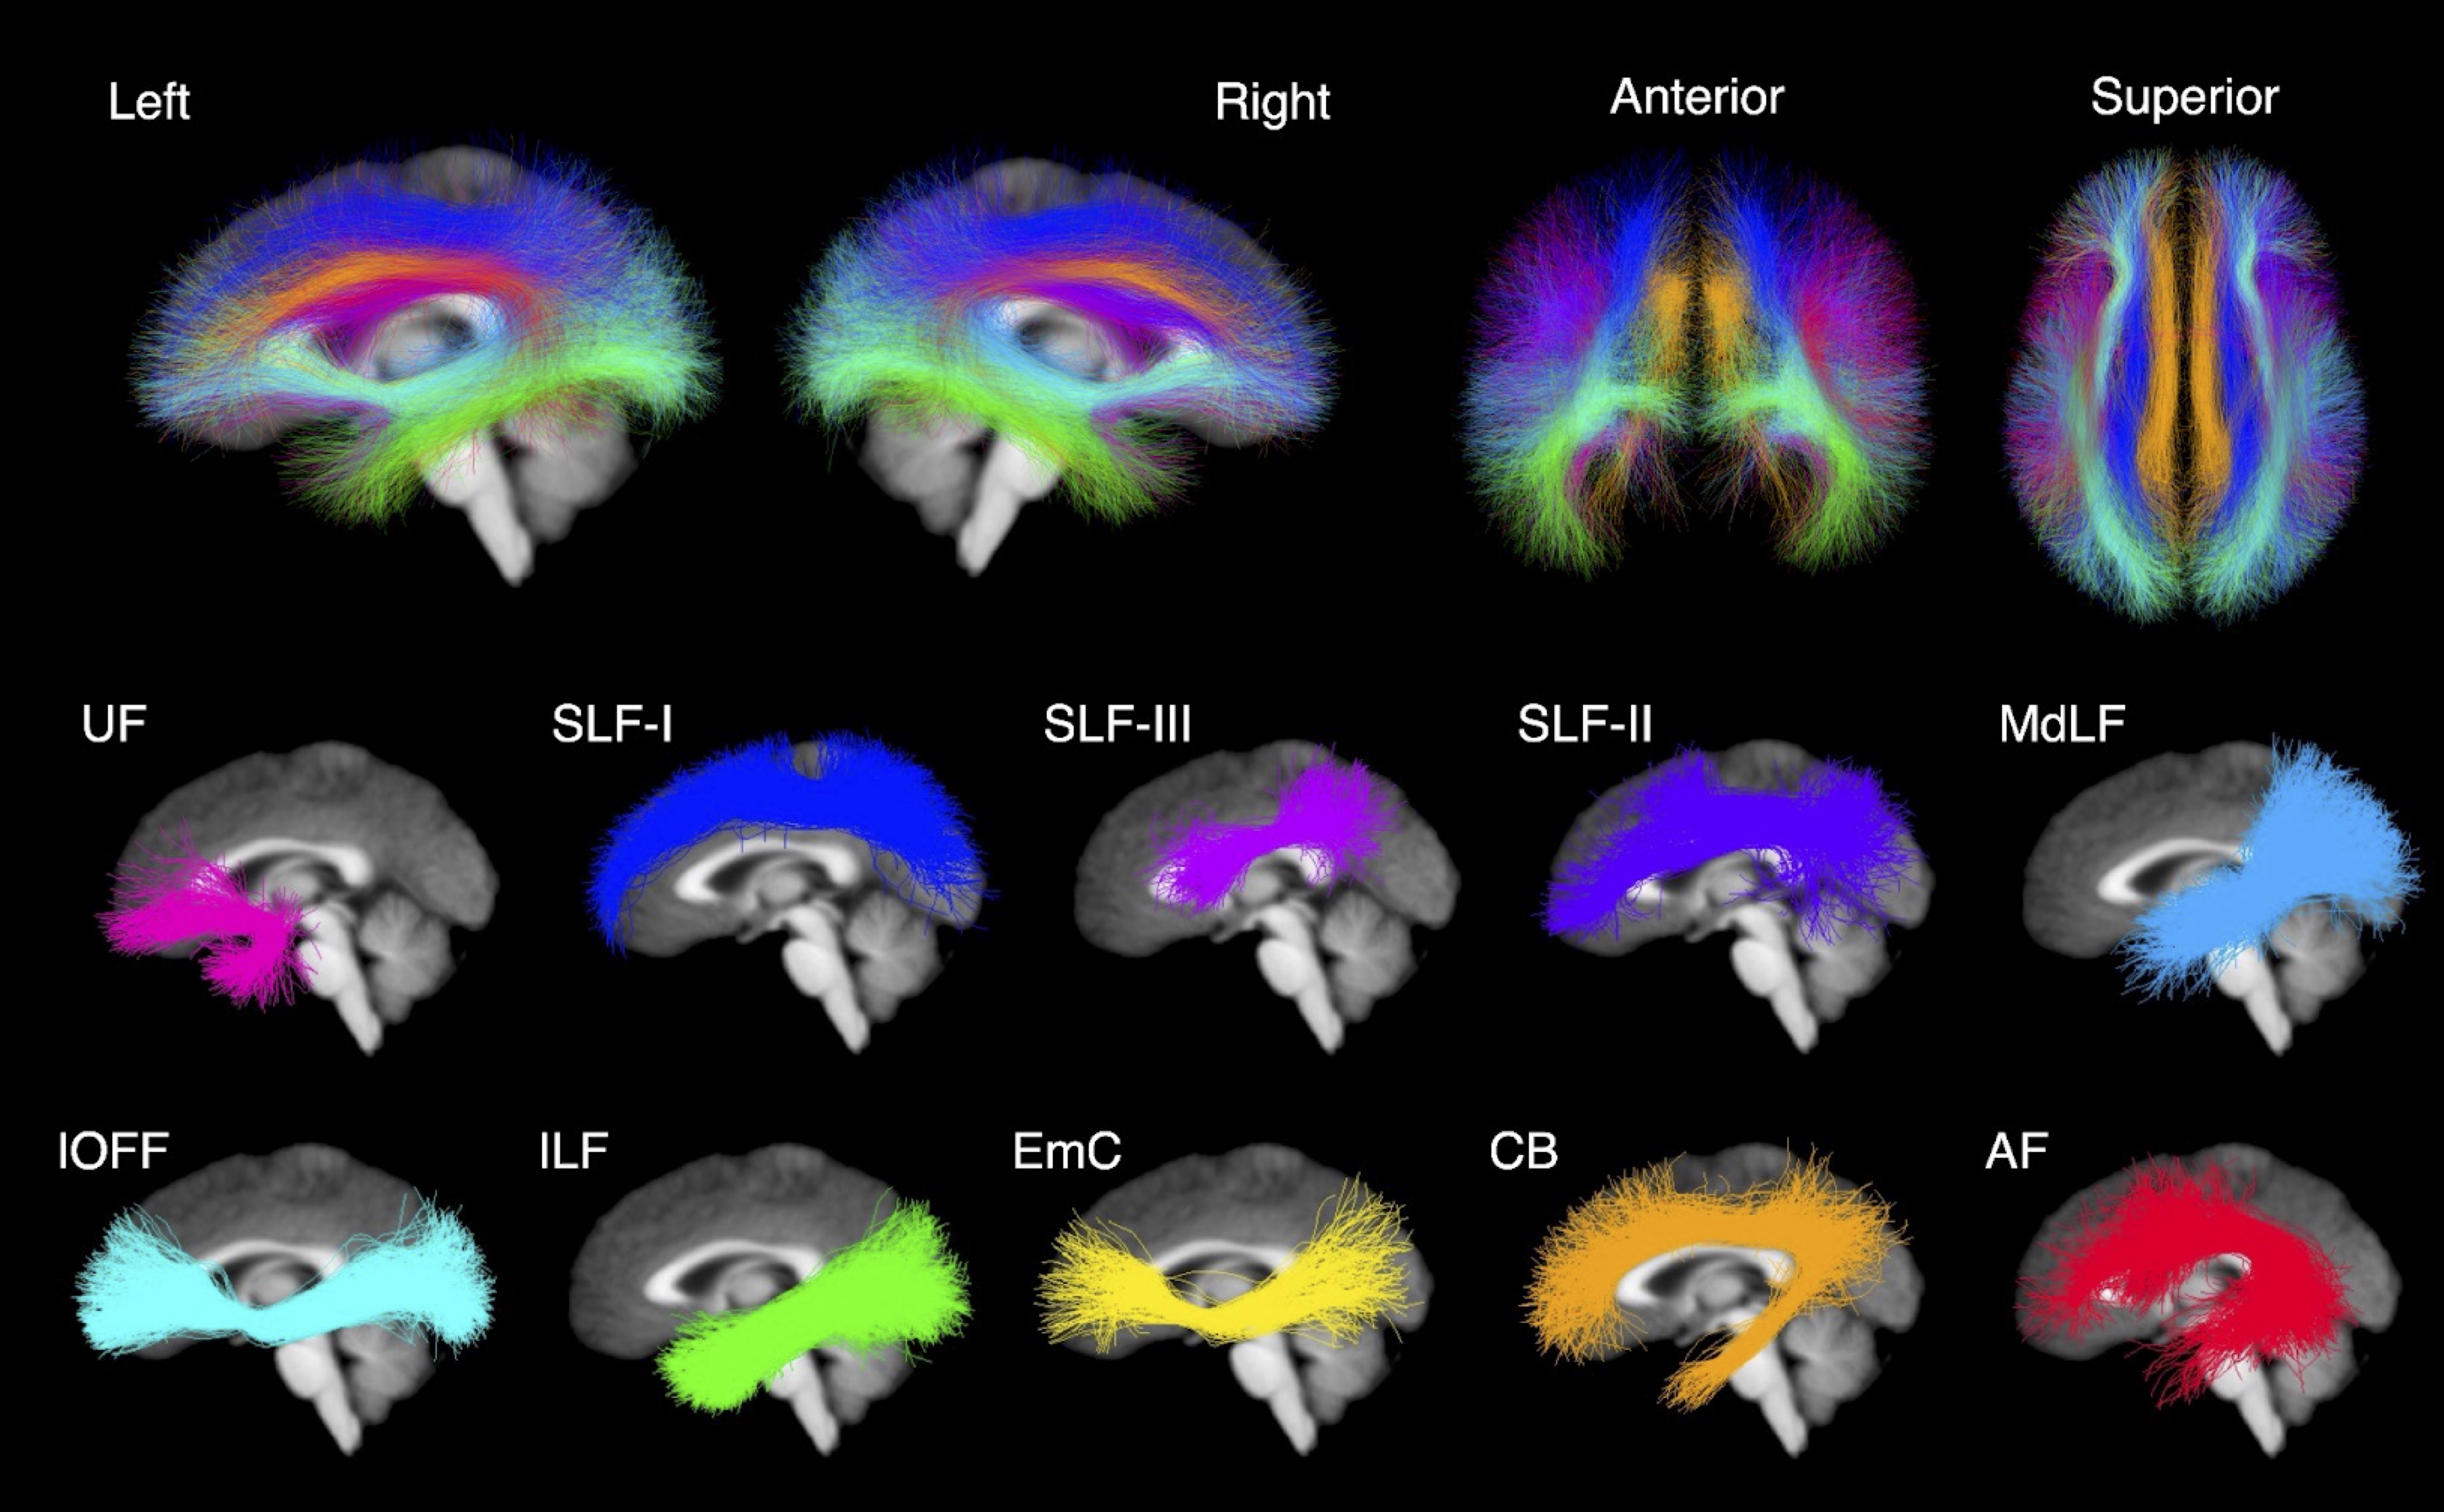
The HCP is a large open access dataset of healthy adults aged 22 to 36 years 13. This dataset contains both neuropsychological behavioral assessments and diffusion MRI data collected on a customized Siemens Skyra 3T scanner, TE/TR = 89.5/5520 ms, isotropic voxels (1.25 mm3). The dMRI data was collected for 1065 participants. 256 participants were excluded from this analysis because they were used to develop the employed white matter atlas 14, had nearly identical genetics (i.e., monozygotic twins), or were missing neuropsychological data. The final study dataset was composed of 809 participants with minimally preprocessed dMRI data and scores from two neuropsychological behavioral assessments. To understand how the WM microstructure may relate to the language network, we used scores from the NIH Toolbox Picture Vocabulary Test (TPVT) which measures semantic memory performance. Likewise, to understand how the WM microstructure may relate to the ToM network, we used scores from the Penn Emotion Recognition Test (PERT) which measures emotion perception performance. The distribution of the TPVT and PERT scores are depicted in Figure 1.To process the HCP dMRI data, we extracted the b = 0 and b = 3000 shell of 90 gradient directions to provide the highest angular resolution for tractography 14. We used a two-tensor whole brain tractography approach 15,16 to account for the many crossing fibers in the architecturally complex WM association tracts. To identify the WM association tracts of each individual brain, we used a neuroanatomically curated WM tract atlas 14. Figure 2 depicts the investigated WM association tracts including the left and right arcuate fasciculus (AF), cingulum bundle (CB), extreme capsule (EmC), inferior longitudinal fasciculus (ILF), inferior occipito-frontal fasciculus (IOFF), middle longitudinal fasciculus (MdLF), superior longitudinal fasciculi I, II and III (SLF-I, SLF-II, SLF-III), and uncinate fasciculus (UF). Three tract measures were measured from each of the 10 bilateral association tracts in every participant. Namely, the number of streamlines (NoS), the average fractional anisotropy (FA) and mean diffusivity (MD) were measured.
To investigate the relationship between the behavioral performance measures and tract microstructural measures, we created multiple linear regression models. TPVT and PERT scores were used as dependent variables, while the left and right tract microstructure measures were used as independent variables. To control for the effects of age and sex, these variables were included in each model as covariates. Multiple comparisons across each tract measure were corrected using the False Discovery Rate.
Results
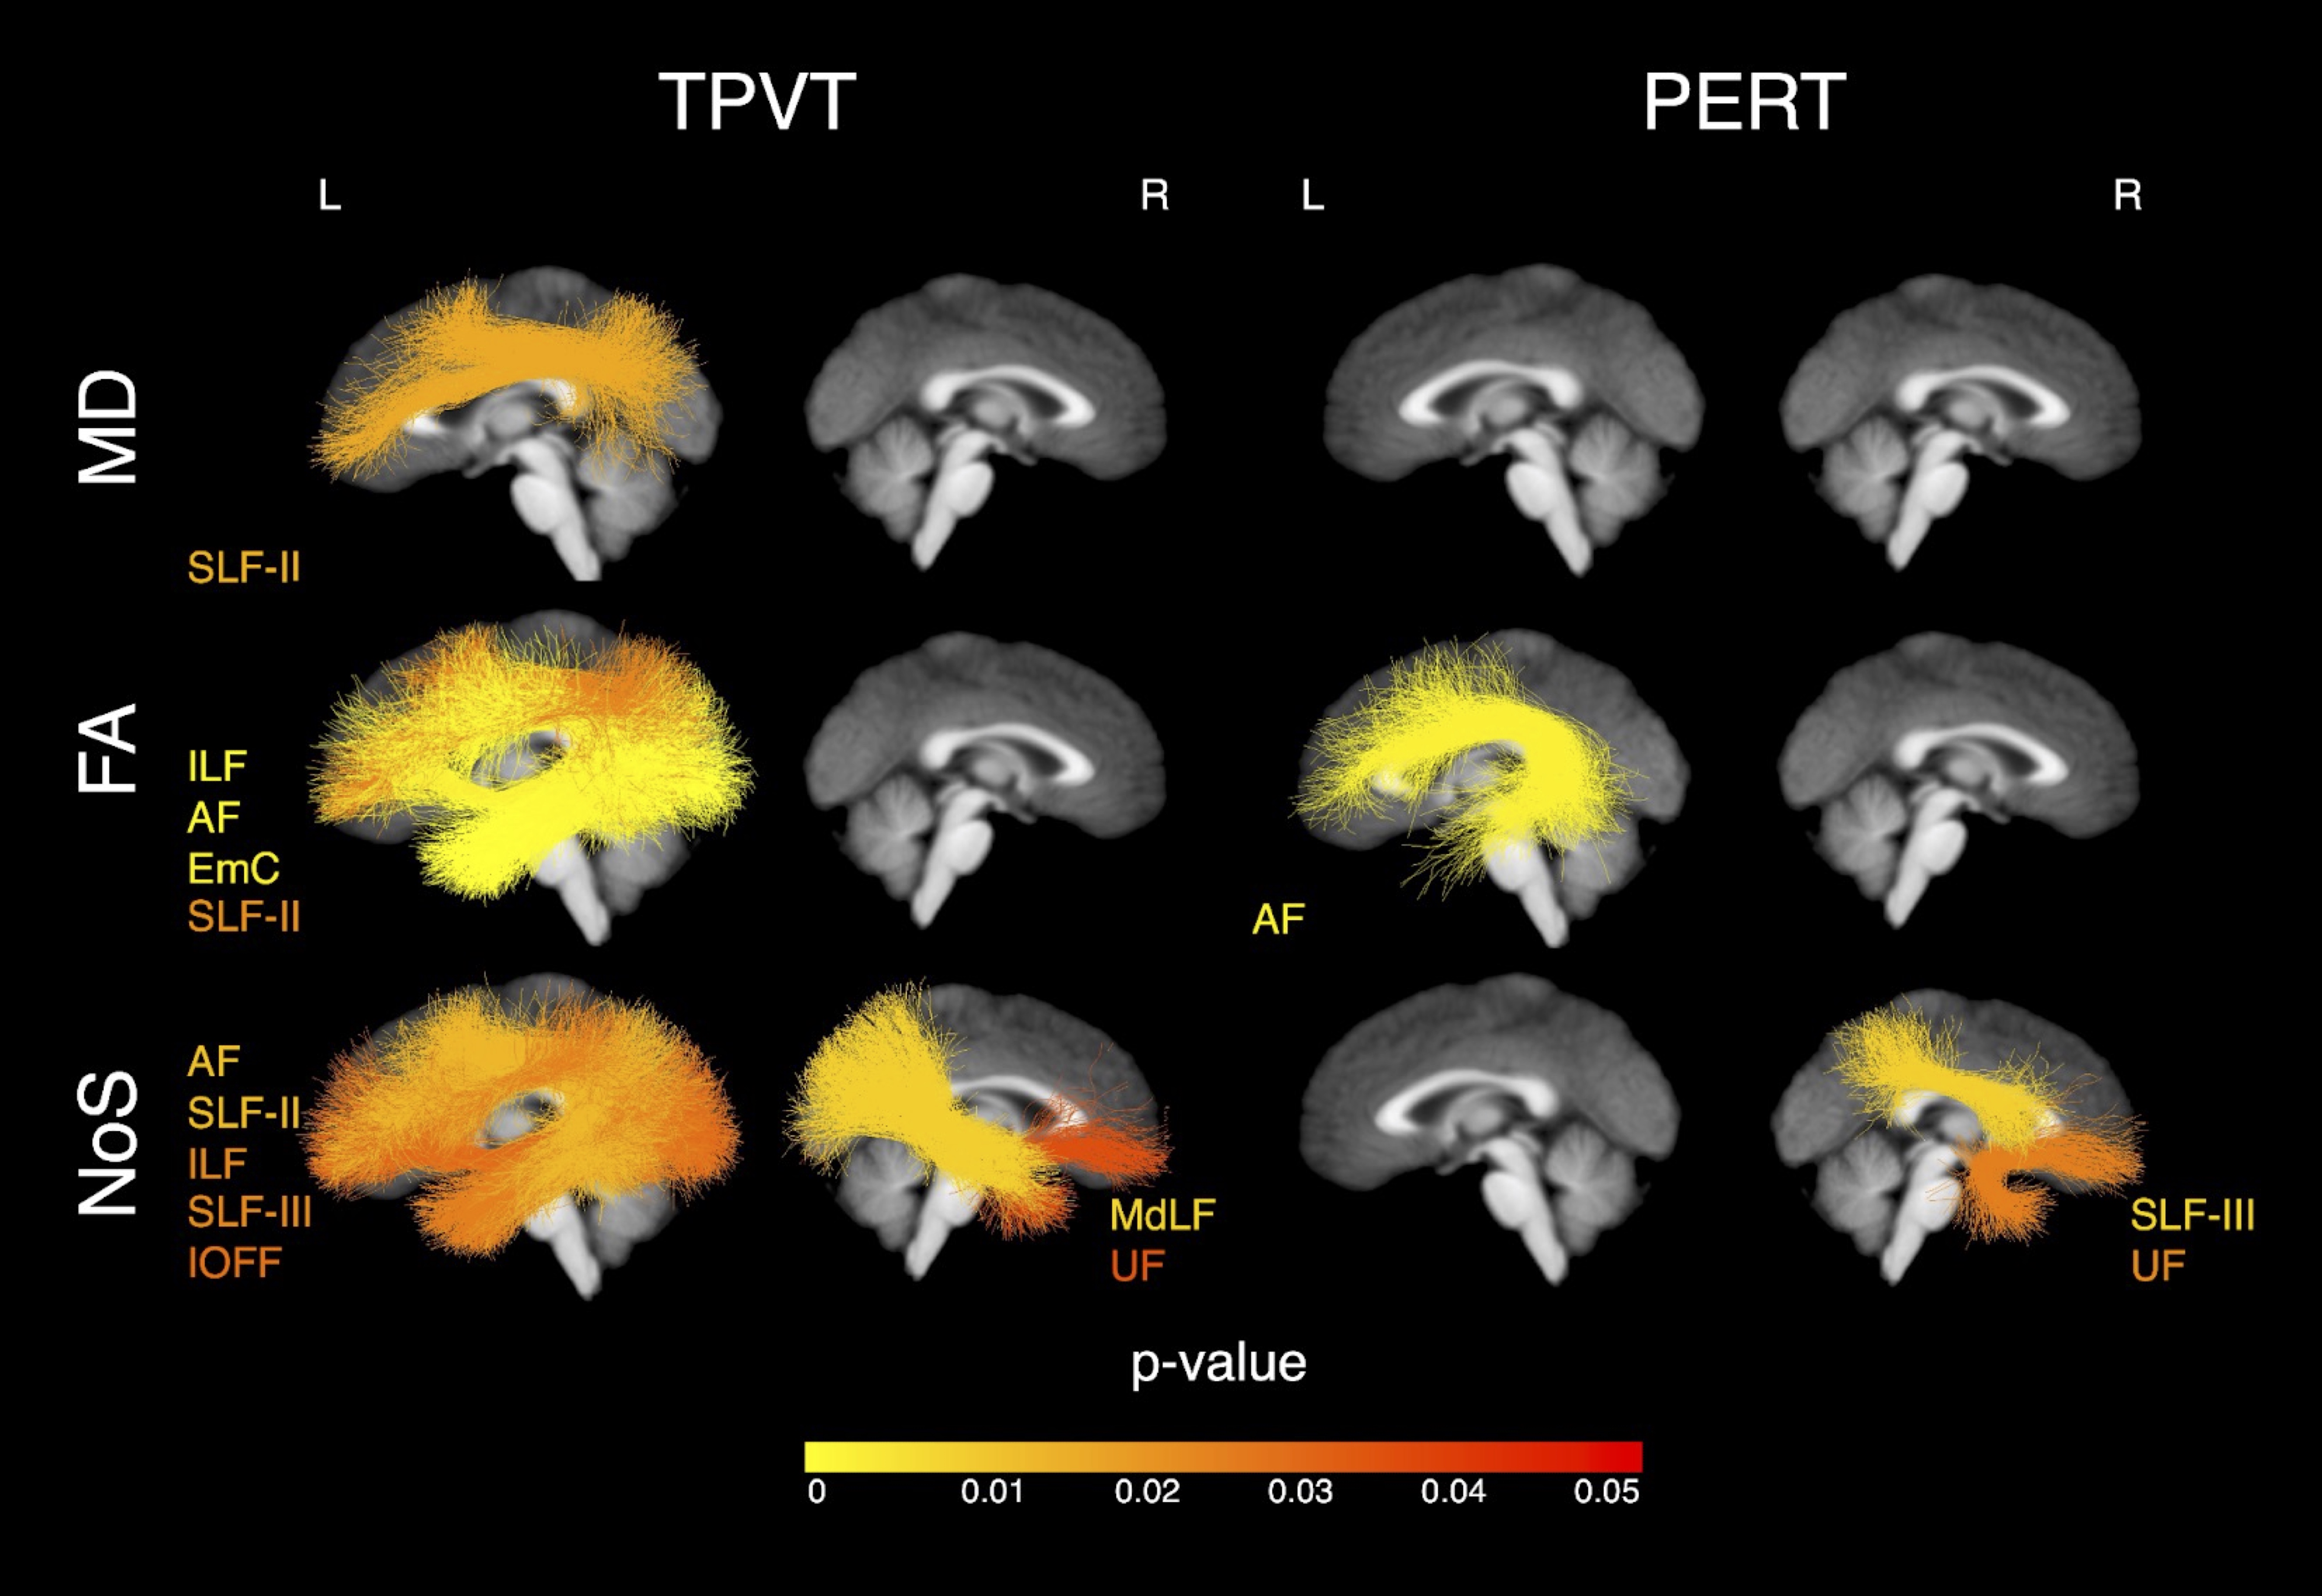
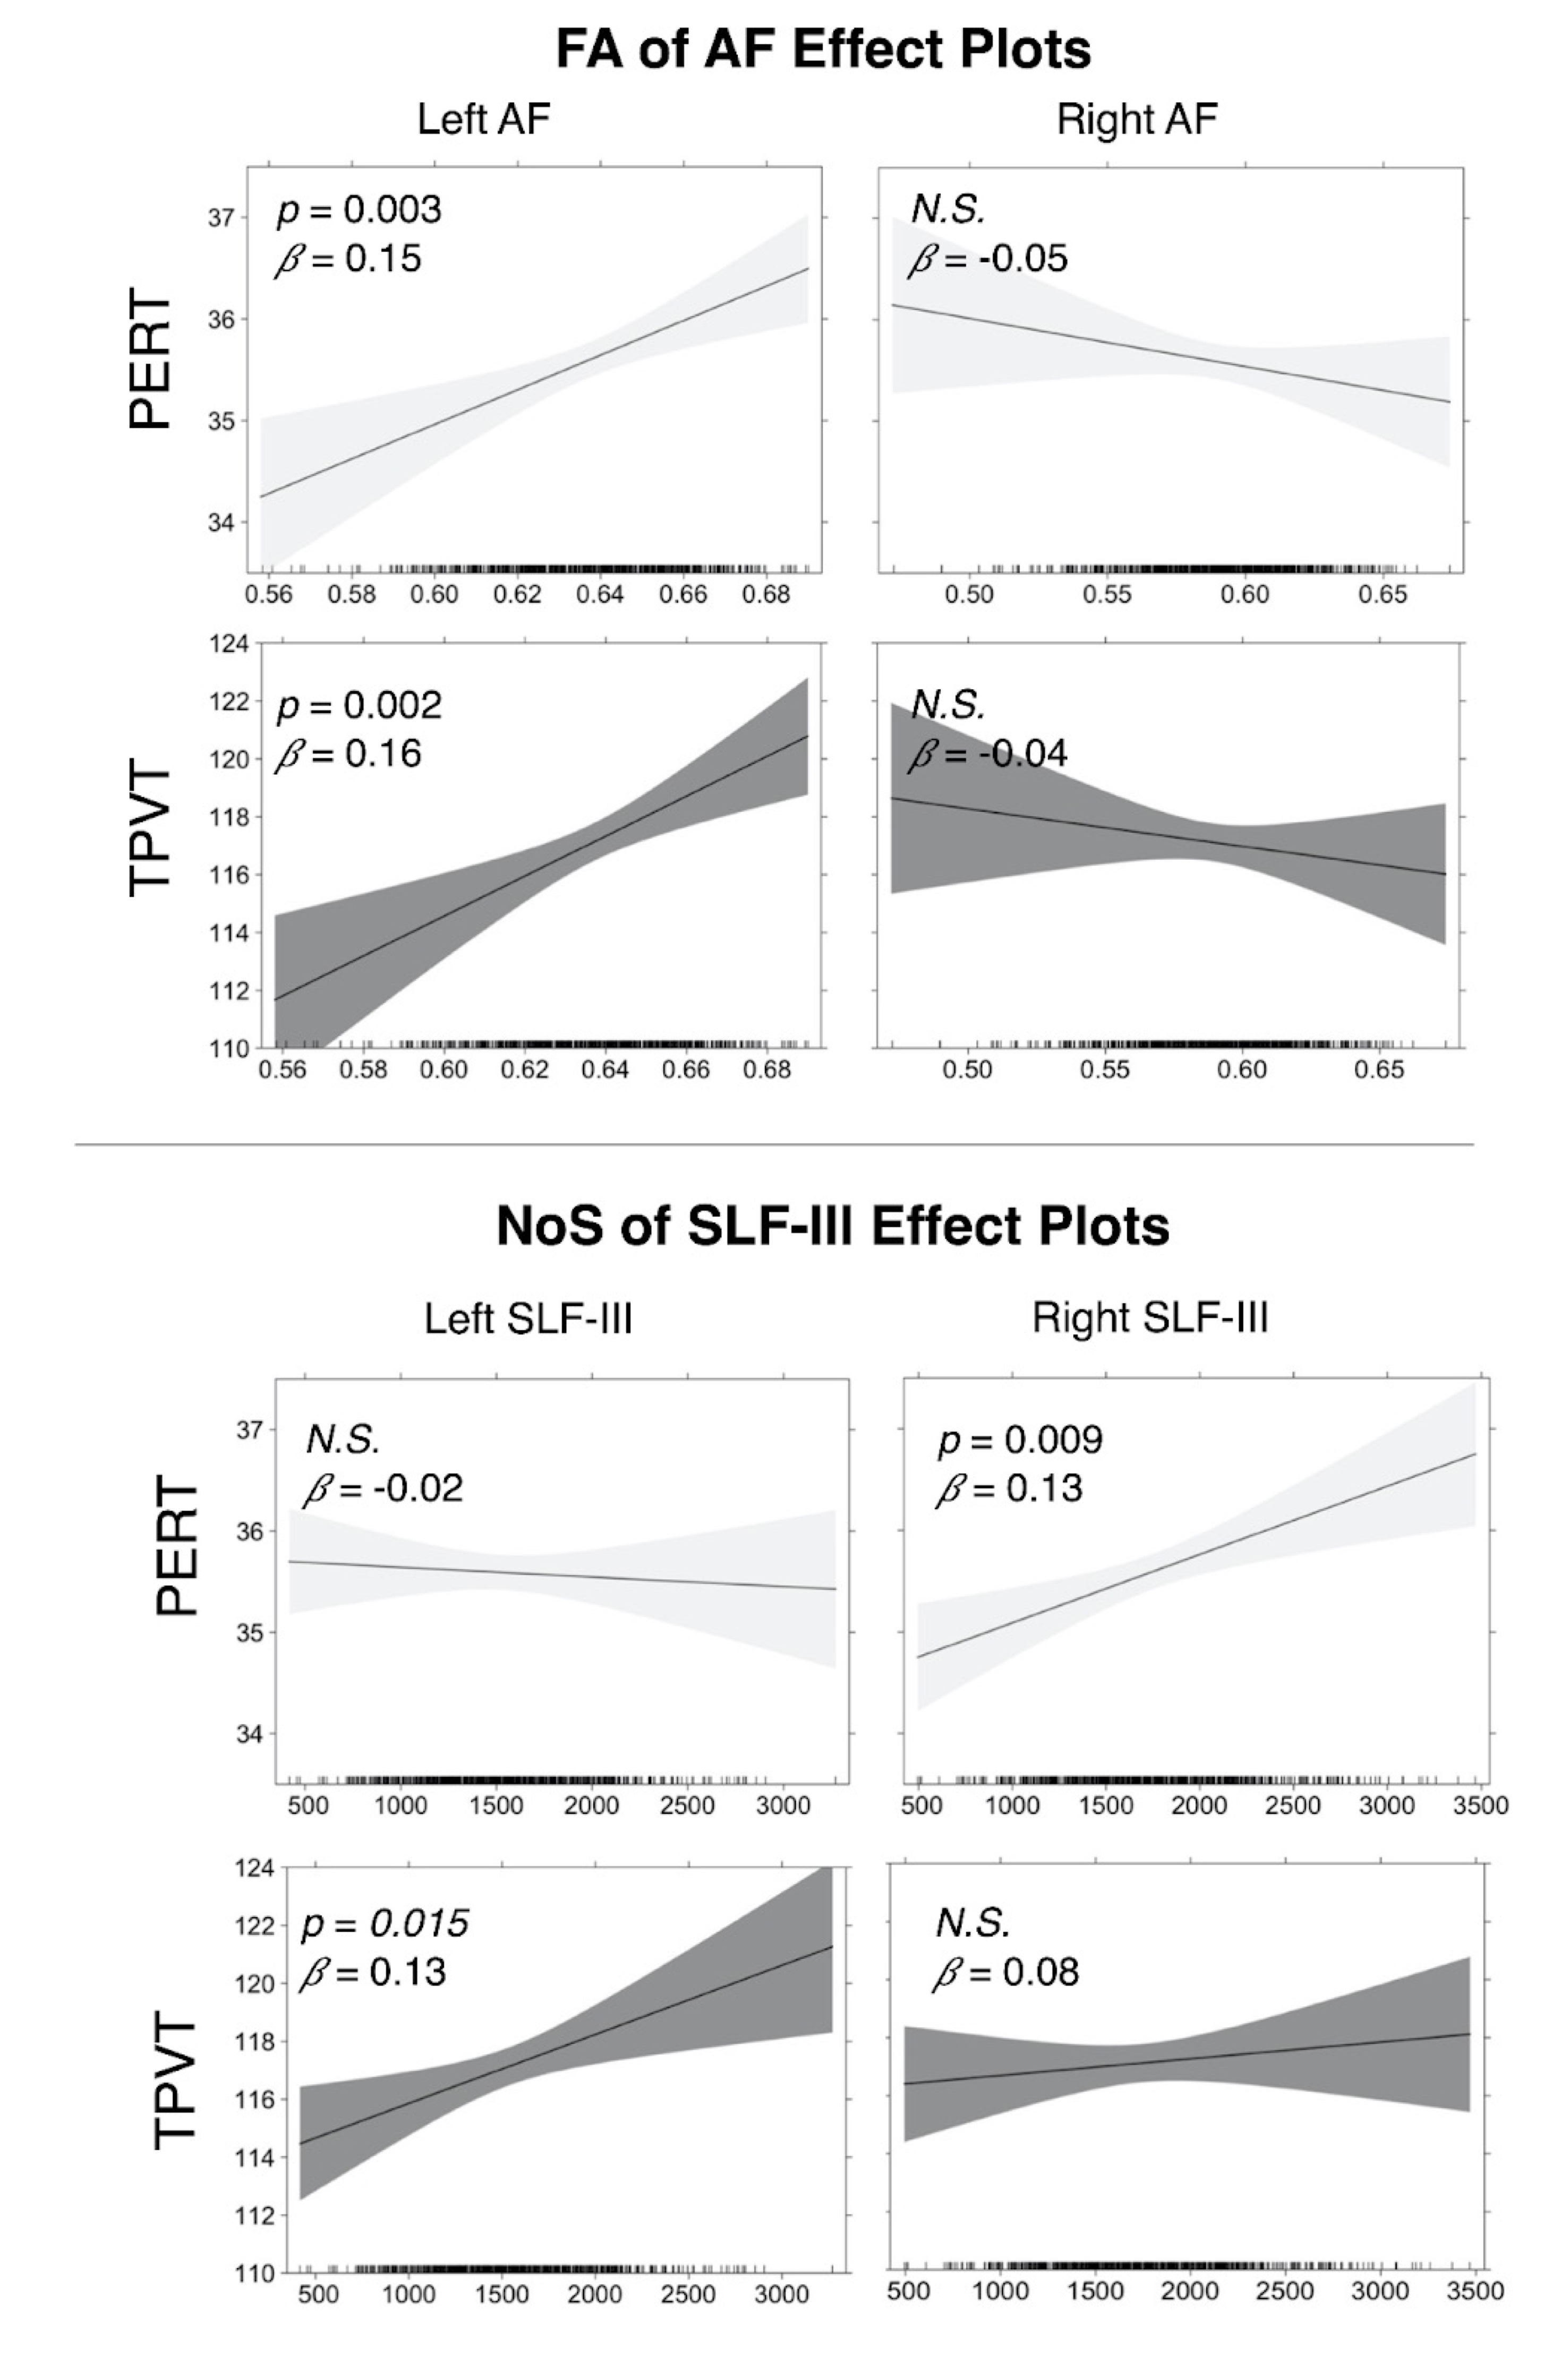
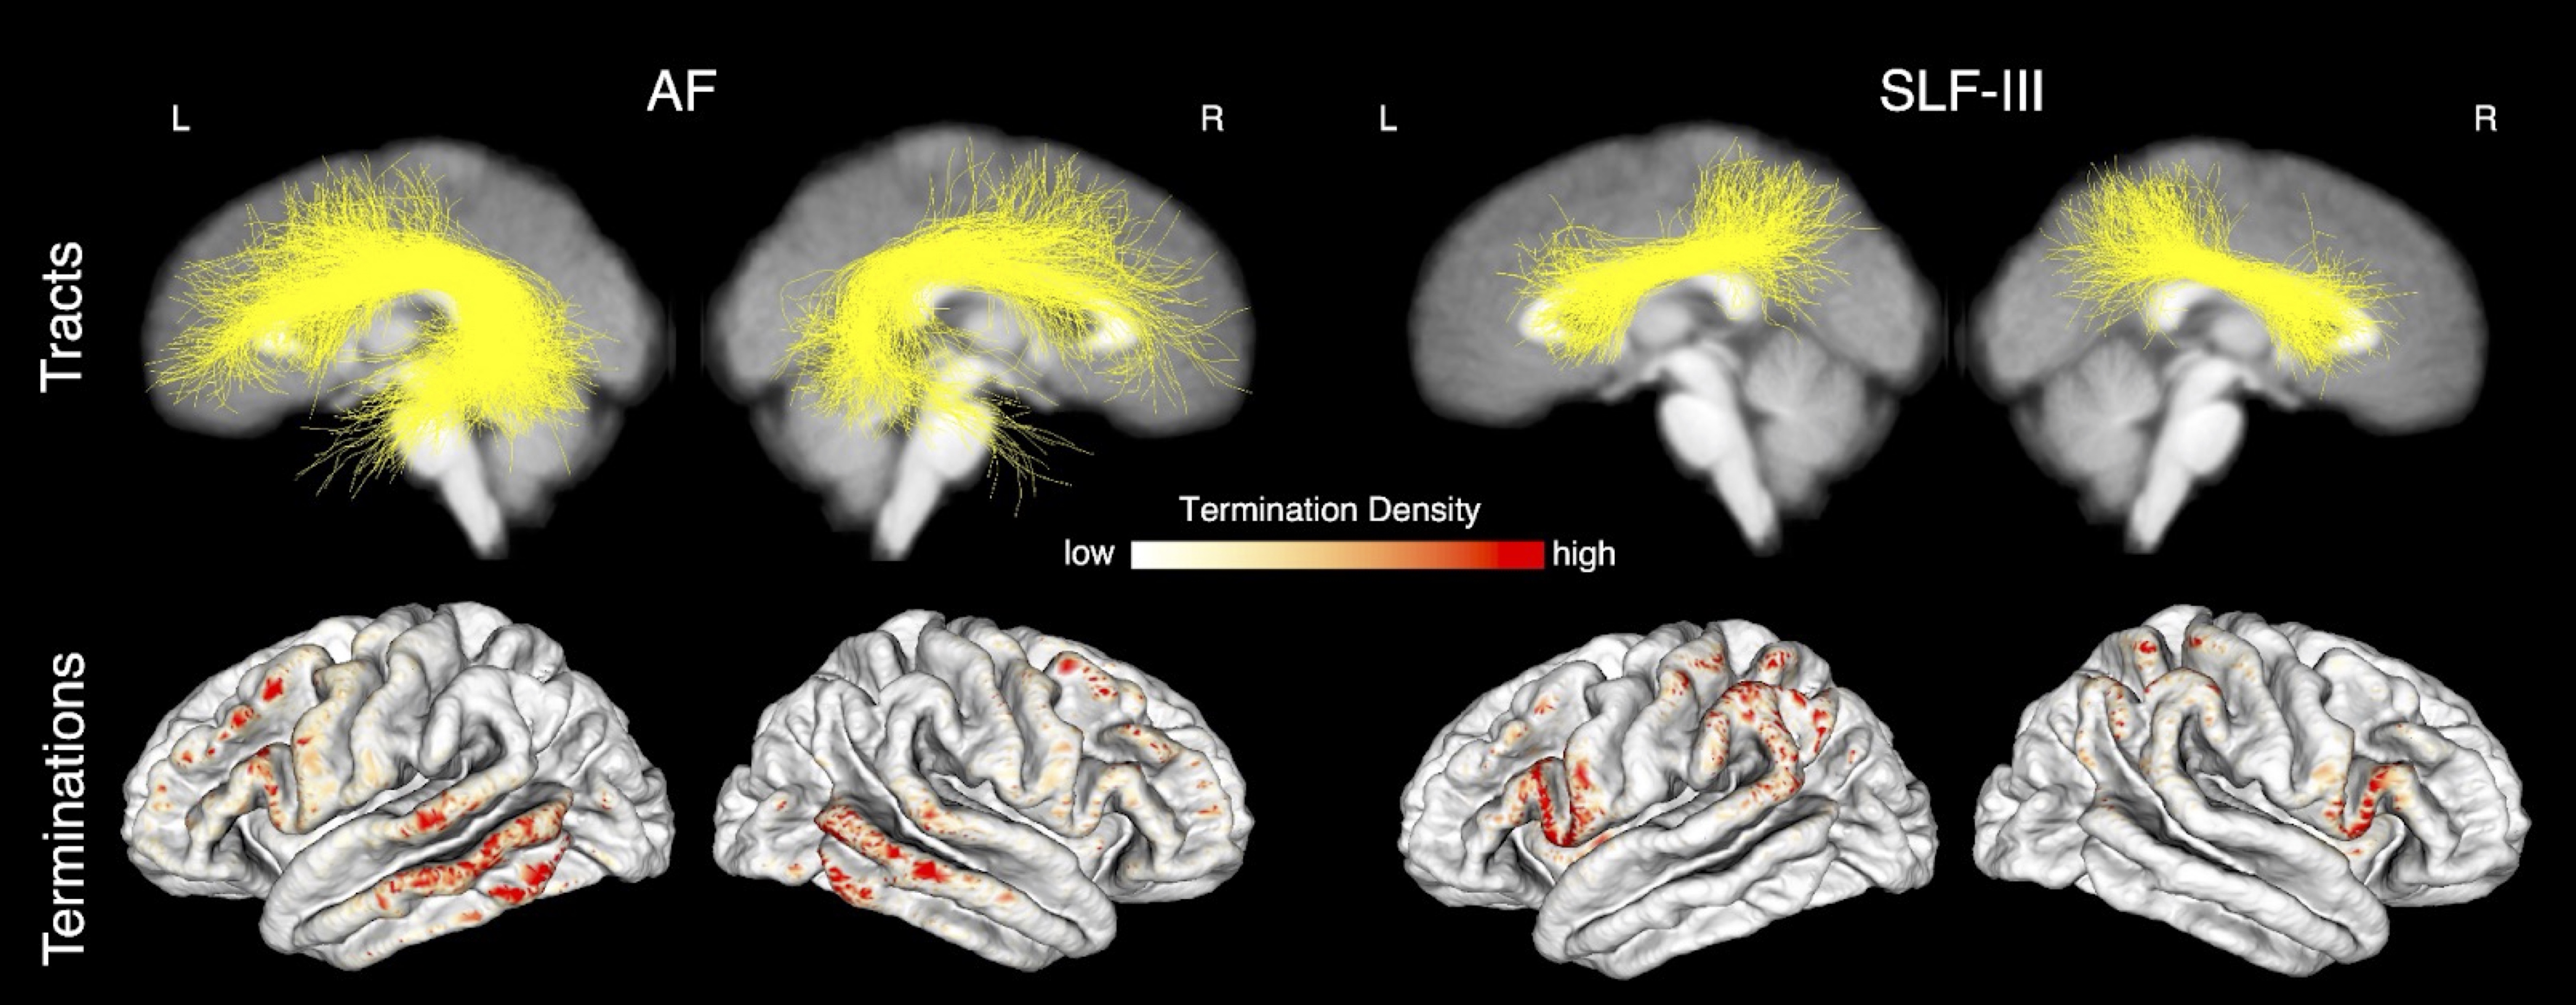
Overall, we found that the microstructure of multiple WM tracts significantly influenced performance on the investigated semantic memory (TPVT) and emotion perception (PERT) measures (see Figure 3). In particular, we found the microstructure of the left SLF-III influenced performance on TPVT, while the microstructure of the right SLF-III influenced performance on PERT (Figure 4, bottom panel). Conversely, the microstructure of the left AF influenced performance on both TPVT and PERT (Figure 4, top panel). Finally, to visualize how the AF and SLF-III relate to the broader language and ToM networks, the cortical regions these tracts connect are depicted in Figure 6.Discussion
Our results are relevant to the hemispheric dominance and lateralization of language in the left hemisphere and ToM in the right hemisphere. We found that semantic memory tended to be influenced by tracts in the left hemisphere and emotion perception tended to be influenced by tracts in the right hemisphere. Additionally, our results suggest the SLF-III may be involved in opposite hemispheric dominance and lateralization, while bringing into question the role the AF may play. Finally, our atlas demonstrates that the SLF-III connects frontal and temporal regions that are often associated with language and ToM processing in the left and right hemispheres, respectively.Conclusions
This study maps language and ToM subcomponents in the WM association tracts using noninvasive measures and a large sample size (n = 809). We demonstrate that the WM microstructure is able to influence performance on assessments of semantic memory and emotion perception, two critical subcomponents of the language and theory of mind networks. Our results suggest that multiple, overlapping WM tracts underlie the cognitive domains of language and theory of mind. As this study demonstrates, cognition is not only situated within the association cortex but is also reflected in the microstructure of the underlying WM association tracts.Acknowledgements
We acknowledge our funding from the Jennifer Oppenheimer Cancer Initiative. Additionally, we acknowledge funding provided by the following National Institutes of Health (NIH) grants: P41EB015902, P41EB015898, P41EB028741, R01MH074794, R01MH119222, R01MH125860, R01MH097979. FZ also acknowledges a BWH Radiology Research Pilot Grant Award. NM was a Fellow at the Hanse-Wissenschaftskolleg Institute for Advanced Study, Delmenhorst, Germany while working on this study. JH acknowledges support from the China Scholarship Council (CSC) and National Natural Science Foundation of China provided through grants: 61976190, 61903336. DLD’s efforts are partially funded by the NIH/NINDS R01NS088748.References
1. Carrington, S. J. & Bailey, A. J. Are there theory of mind regions in the brain? A review of the neuroimaging literature. Hum. Brain Mapp. 30, 2313–2335 (2009).
2. Hertrich, I., Dietrich, S. & Ackermann, H. The Margins of the Language Network in the Brain. Frontiers in Communication 5, 93 (2020).
3. Fedorenko, E., Hsieh, P.-J., Nieto-Castañón, A., Whitfield-Gabrieli, S. & Kanwisher, N. New method for fMRI investigations of language: defining ROIs functionally in individual subjects. J. Neurophysiol. 104, 1177–1194 (2010).
4. Dodell-Feder, D., Koster-Hale, J., Bedny, M. & Saxe, R. fMRI item analysis in a theory of mind task. Neuroimage 55, 705–712 (2011).
5. Braga, R. M., DiNicola, L. M., Becker, H. C. & Buckner, R. L. Situating the left-lateralized language network in the broader organization of multiple specialized large-scale distributed networks. J. Neurophysiol. 124, 1415–1448 (2020).
6. DiNicola, L. M., Braga, R. M. & Buckner, R. L. Parallel distributed networks dissociate episodic and social functions within the individual. J. Neurophysiol. 123, 1144–1179 (2020).
7. Gierhan, S. M. E. Connections for auditory language in the human brain. Brain Lang. 127, 205–221 (2013).
8. Dick, A. S. & Tremblay, P. Beyond the arcuate fasciculus: consensus and controversy in the connectional anatomy of language. Brain 135, 3529–3550 (2012).
9. Wang, Y. & Olson, I. R. The Original Social Network: White Matter and Social Cognition. Trends Cogn. Sci. 22, 504–516 (2018).
10. Wang, Y., Metoki, A., Alm, K. H. & Olson, I. R. White matter pathways and social cognition. Neurosci. Biobehav. Rev. 90, 350–370 (2018).
11. Forkel, S. J., Friedrich, P., de Schotten, M. T. & Howells, H. White matter variability, cognition, and disorders: a systematic review. bioRxiv (2020) doi:10.1101/2020.04.22.20075127.
12. Grosse Wiesmann, C., Schreiber, J., Singer, T., Steinbeis, N. & Friederici, A. D. White matter maturation is associated with the emergence of Theory of Mind in early childhood. Nat. Commun. 8, 14692 (2017).
13. Van Essen, D. C. et al. The WU-Minn Human Connectome Project: an overview. Neuroimage 80, 62–79 (2013).
14. Zhang, F. et al. An anatomically curated fiber clustering white matter atlas for consistent white matter tract parcellation across the lifespan. Neuroimage 179, 429–447 (2018).
15. Malcolm, J. G., Shenton, M. E. & Rathi, Y. Filtered multitensor tractography. IEEE Trans. Med. Imaging 29, 1664–1675 (2010).
16. Reddy, C. P. & Rathi, Y. Joint Multi-Fiber NODDI Parameter Estimation and Tractography Using the Unscented Information Filter. Front. Neurosci. 10, 166 (2016).
Figures