3874
Local BOLD correlations in white matter measured under constraints of fiber orientation1VANDERBILT UNIVERSITY, Nashville, TN, United States, 2Vanderbilt University Medical Center, Nashville, TN, United States
Synopsis
Correlations between BOLD signals from adjacent voxels in white matter (WM) are anisotropic and appear similar to metrics that describe functional connectivity in gray matter. We propose a method to measure the fiber-oriented correlation (FOC) between BOLD signals in WM. This method was implemented on both resting state and motor task fMRI data across 64 HCP subjects. The FOC map revealed WM areas apparently engaged in default mode network and visual function in both rest and task conditions. The motor task map also delineates the corticospinal tract. The proposed metric FOC may be valuable for investigating functional WM pathways.
INTRODUCTION
Accumulating evidence supports the existence of BOLD fluctuations in white matter (WM) 1, 2. Local correlations between voxels in WM are anisotropic 3-5 and appear to be organized around WM tracts, whose orientations determine the directions of neural information transmission. Here we propose a method to measure the fiber-oriented correlation (FOC) that reflects local synchronization of BOLD signals along anatomical fiber orientations.METHODS
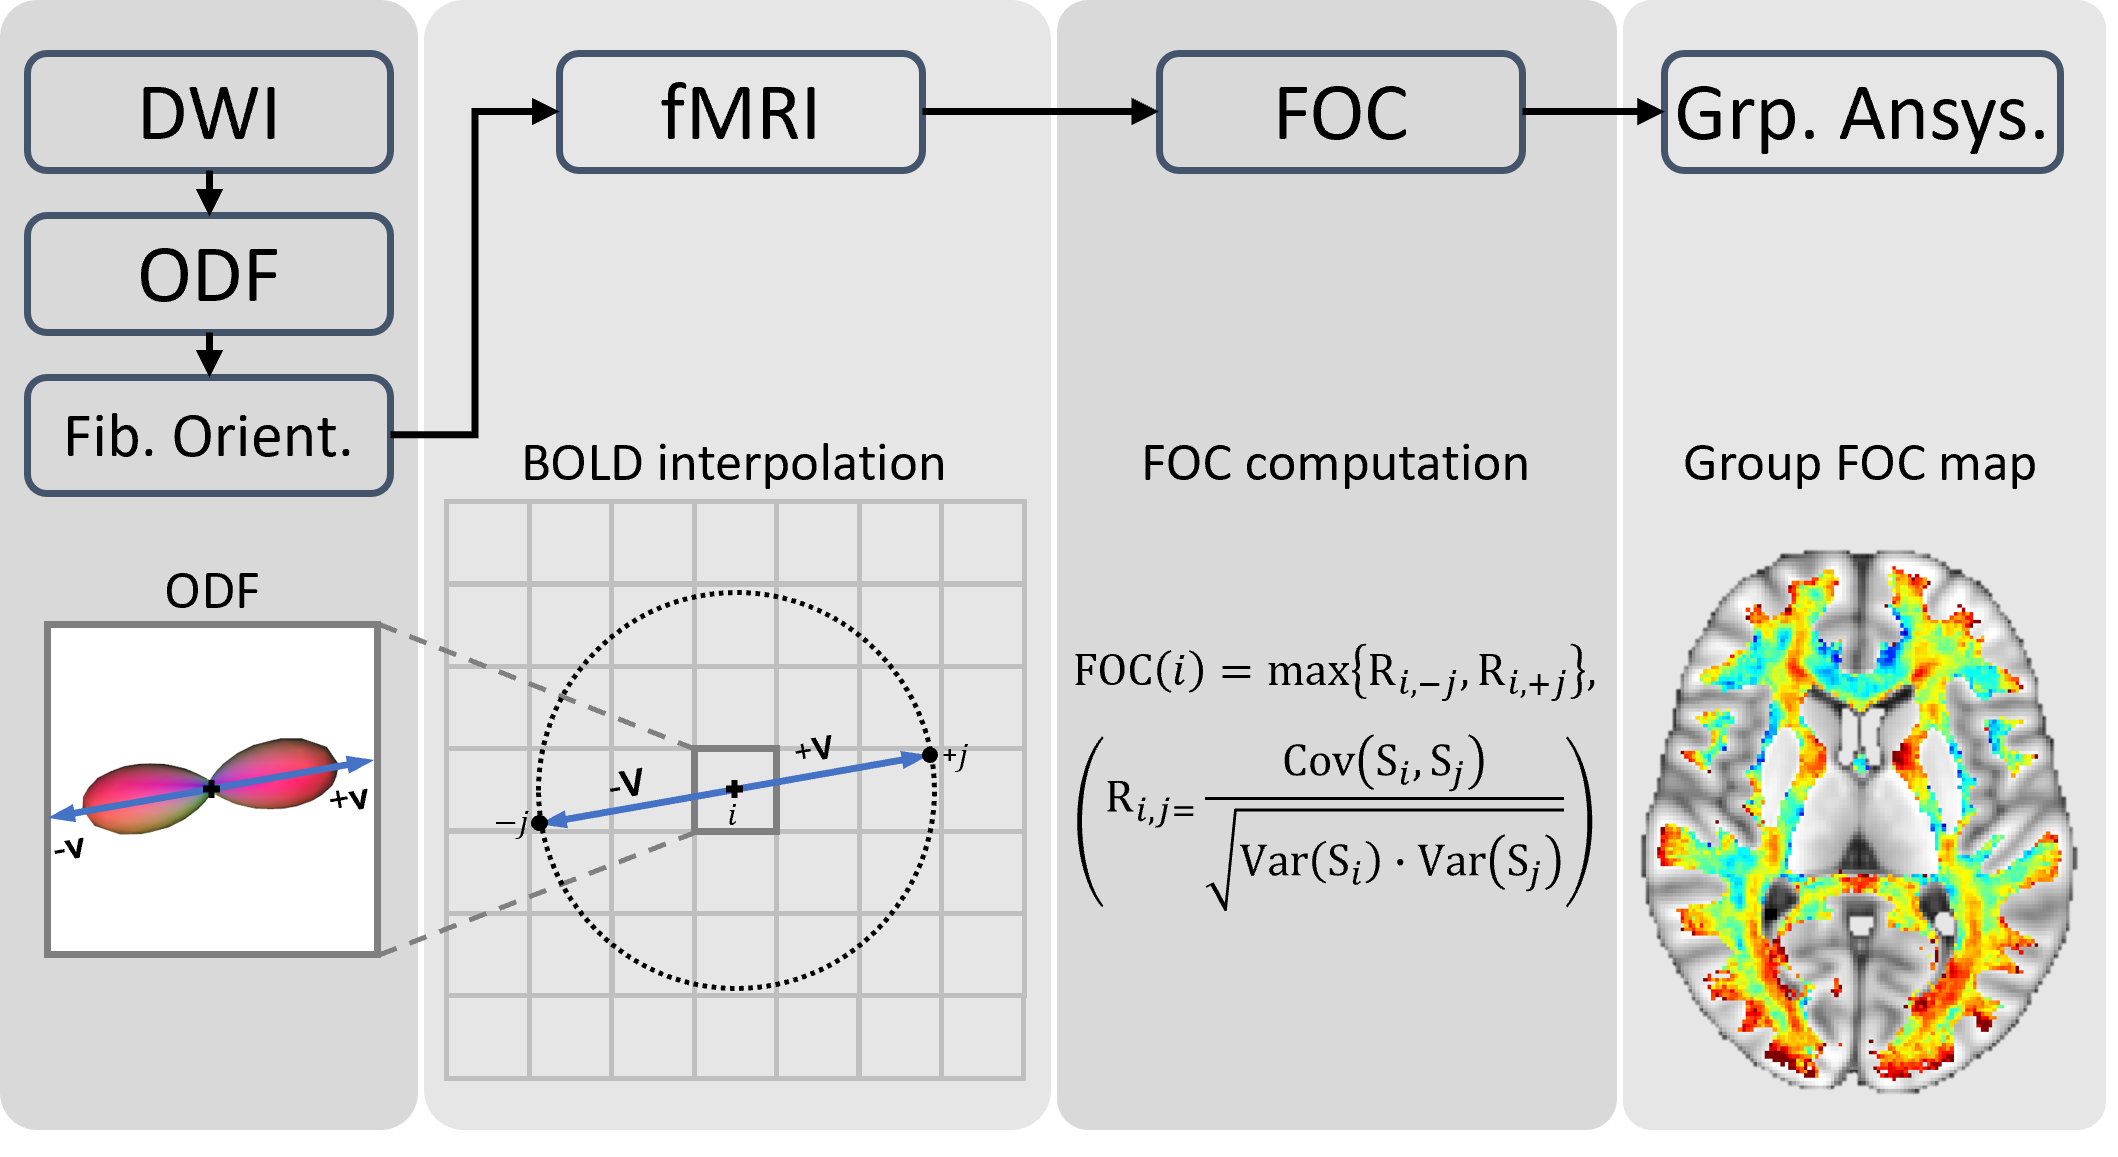
A brief workflow of the proposed method is described below and is summarized in Figure 1.Data
3T MRI images of 64 healthy young adults were obtained from the Human Connectome Project (HCP) database, including T1w (resolution=0.7mm isotropic), diffusion MRI (b=1000, 2000 and 3000 s/mm2, resolution=1.25mm isotropic), resting state fMRI (TR=0.72s, 1200 frames, resolution=2mm isotropic, eyes open) and motor task fMRI (TR=2s, 284 frames, resolution=2mm isotropic, task trial=15s movement of fingers/toes/tongue after 3s visual cue, 10 trials per run). Each fMRI scan has two runs with opposite phase-encoding directions (LR and RL).
MRI preprocessing
In addition to the default HCP preprocessing pipeline, our fMRI preprocessing also included co-registering to individual’s diffusion space, spatial smoothing within WM region (FWHM=2.5mm), regressing-out CSF signal and temporal filtering (passband=0.01-0.12Hz). T1w preprocessing included co-registering to diffusion space and segmenting WM, GM, and CSF.
Fiber-oriented correlation (FOC)
The Orientation Distribution Function (ODF) of each WM voxel was reconstructed based on diffusion MRI data. The orientation corresponding to the maximal amplitude was extracted to represent the primary fiber orientation, V, in the voxel. Then FOC was calculated based on the following equation:
$$
\operatorname{FOC}(i)=\max \{R(i,-j), \quad R(i,+j)\}, \quad\left(R(i, j)=\frac{\operatorname{Cov}\left(S_{i}, S_{j}\right)}{\sqrt{\operatorname{Var}\left(S_{i}\right) \cdot \operatorname{Var}\left(S_{j}\right)}}\right)
$$
where i indicates the central WM voxel, +/-j indicates the interpolated locations along +/-V and R is the Pearson’s correlation between the BOLD time series of the central voxel, Si, and that at interpolated location, Sj (obtained using tri-linear interpolation of BOLD signals at 8 neighboring voxels). The FOC of LR and RL runs were averaged for each voxel. FOC of all WM voxels were calculated for both resting state and motor task fMRI data.
Group analysis (rest vs motor)
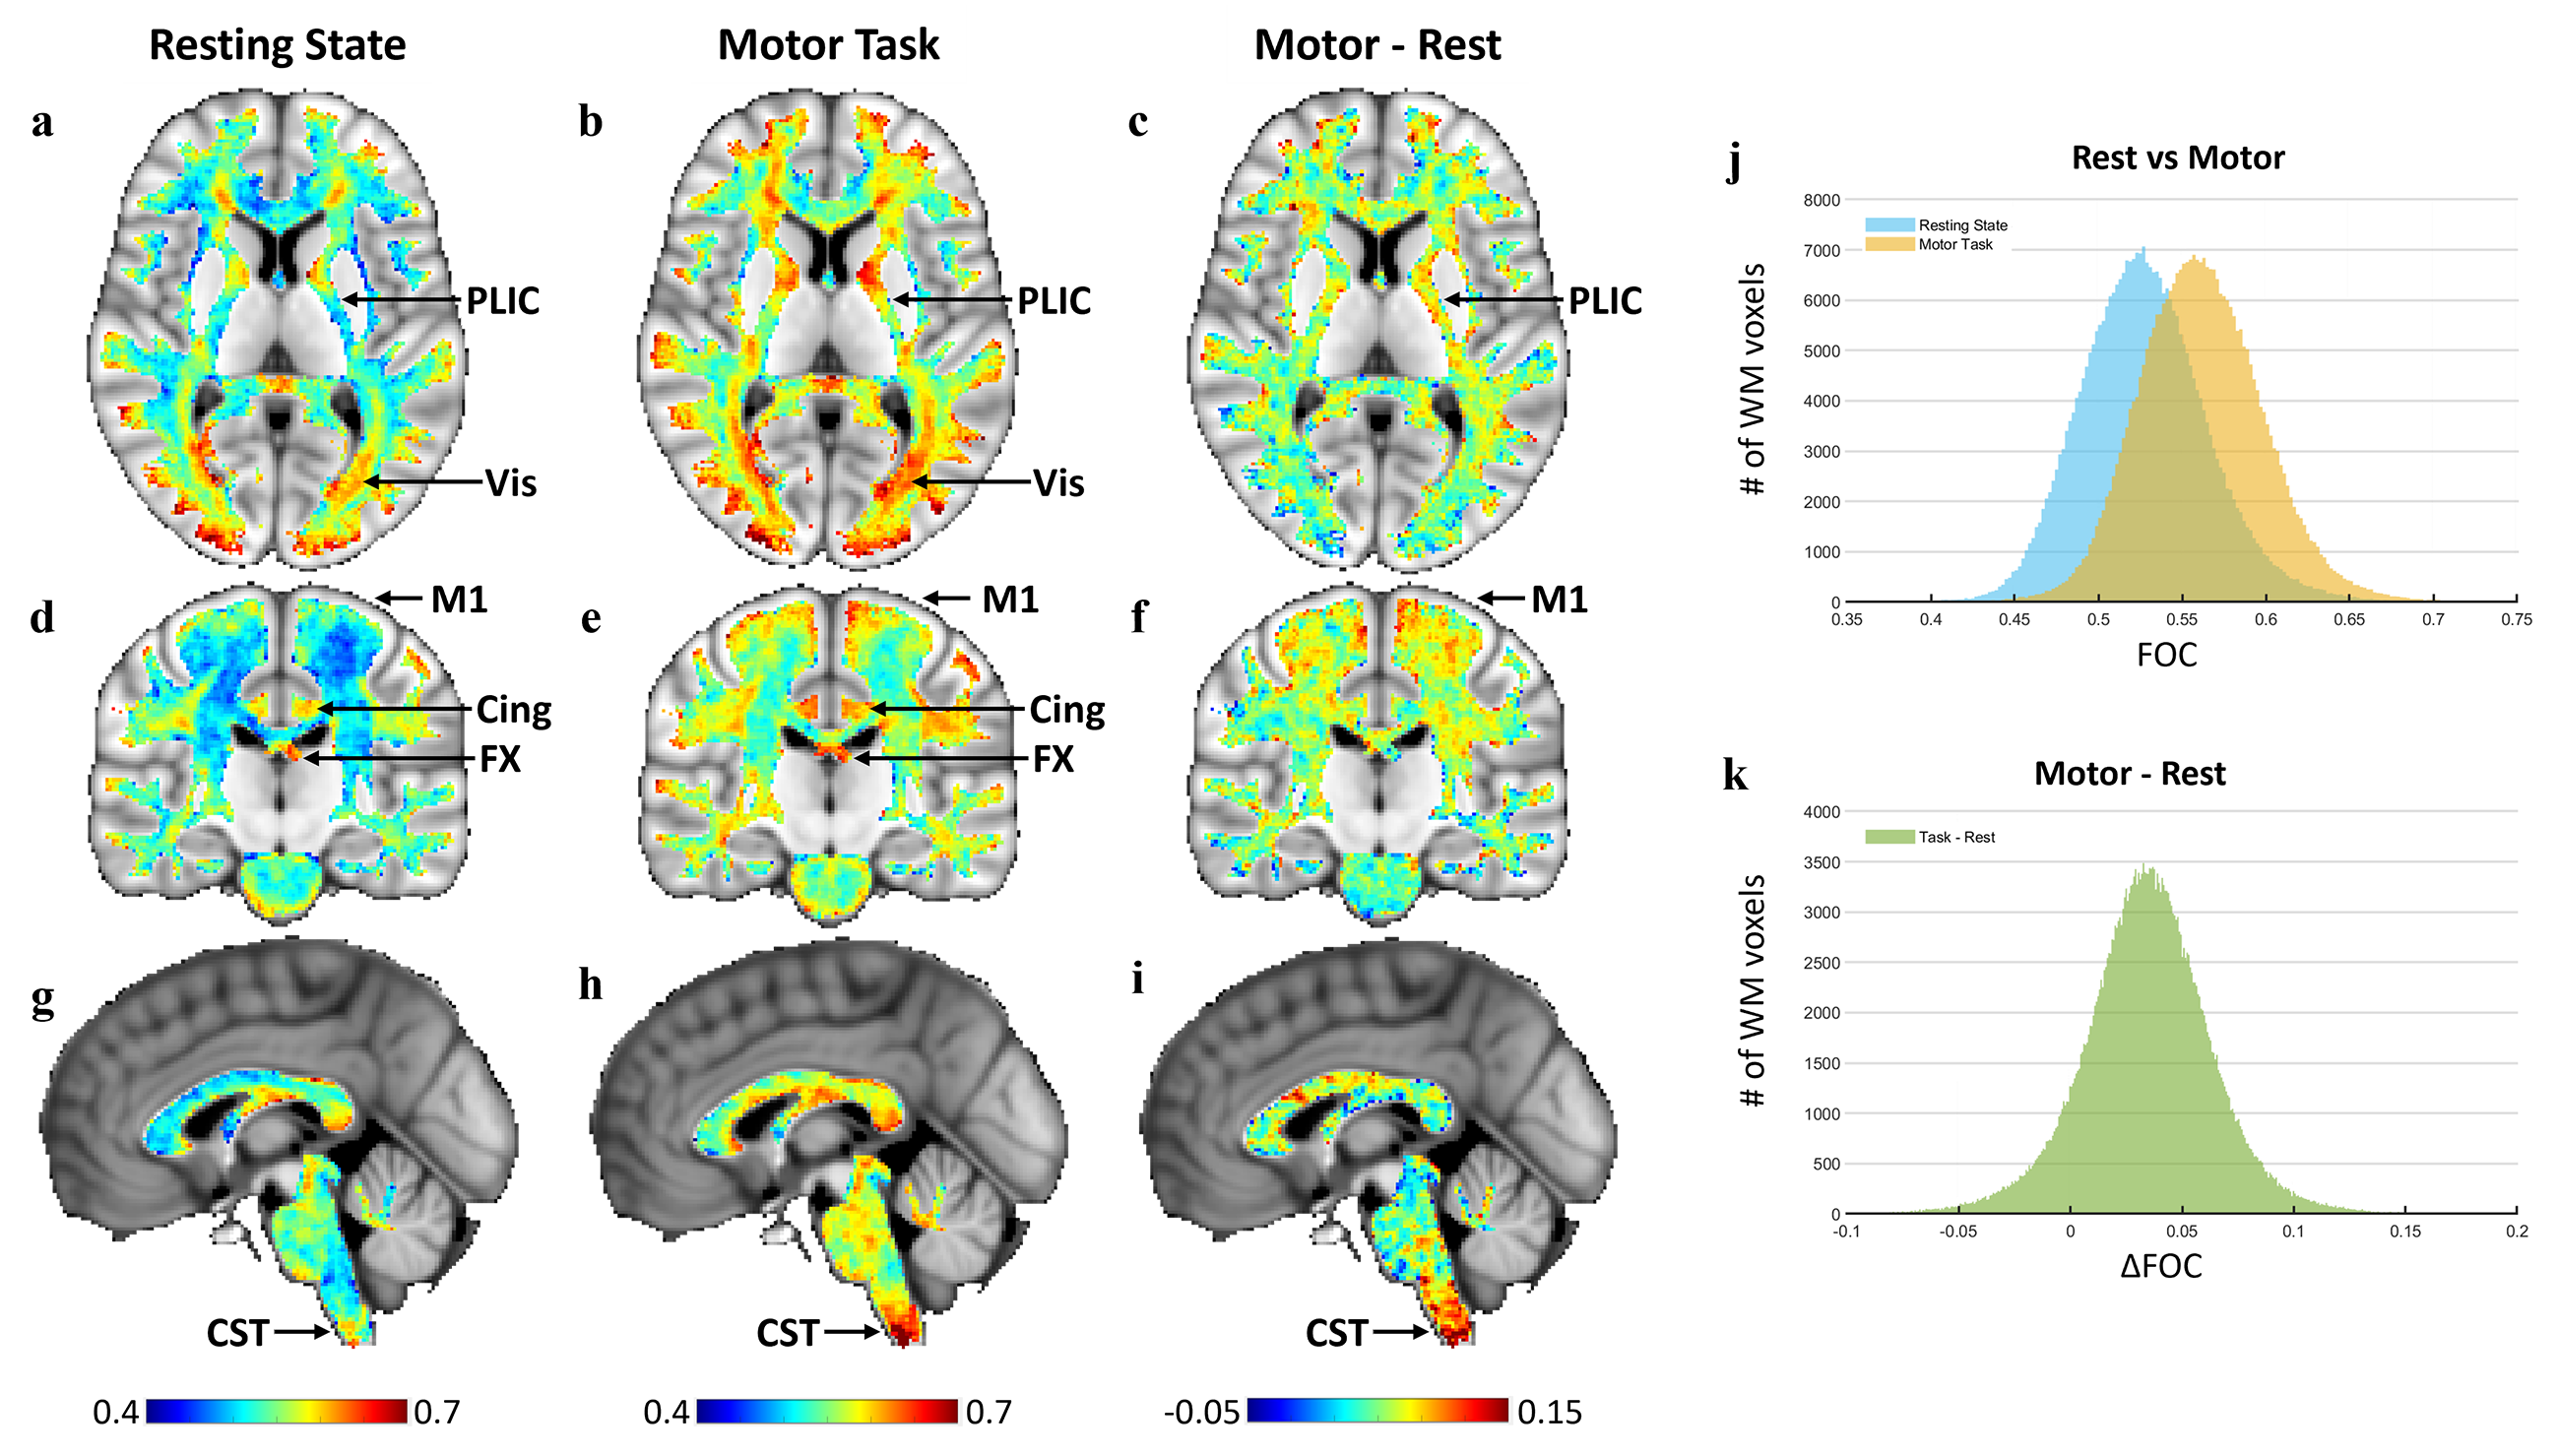
Resting-state and motor-task FOC maps of each subject were transformed into MNI space. The transformed maps across all subjects under the two conditions were averaged respectively and voxel-wise difference of the two averaged maps were calculated.
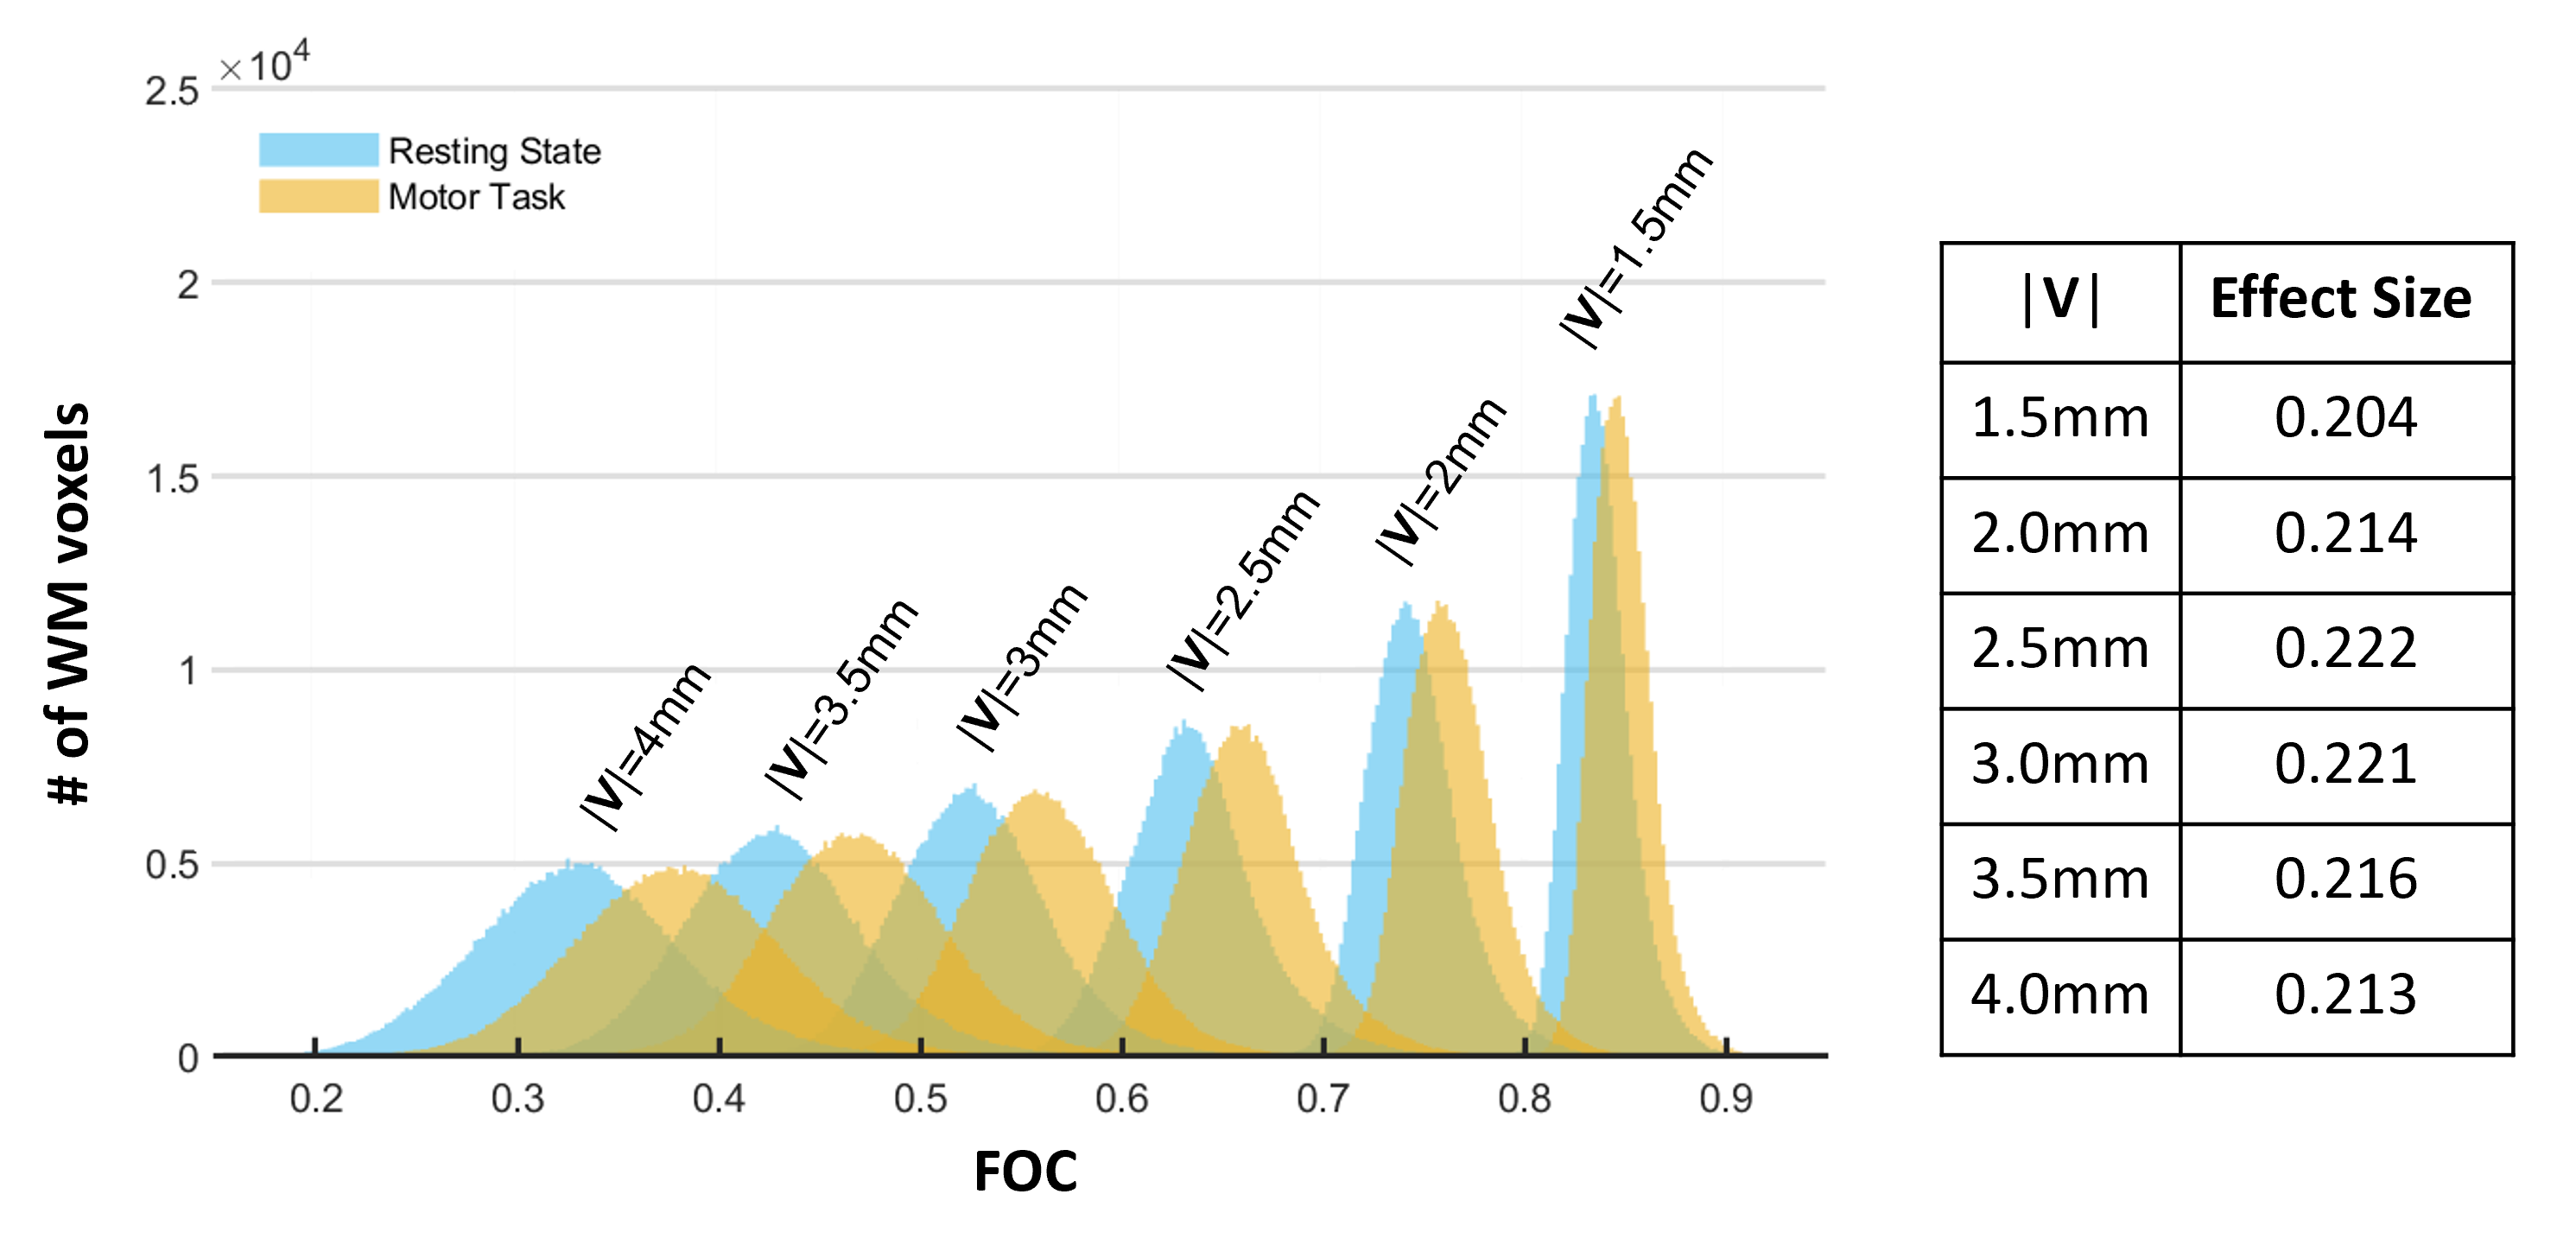
Effect of interpolation radius on FOC
To investigate the effect of interpolation radius, |V|, on FOC, six evenly spaced radii (1.5mm, 2mm, 2.5mm, 3mm, 3.5mm, and 4mm) were used to calculate the FOC on the same 64 subjects for both rest and motor data. The effect size between rest and motor conditions for each WM voxel was calculated and then averaged over the entire WM region.
Repeatability
To evaluate the repeatability of FOC measures, we chose the runs of LR phase-encoding as the test dataset and the runs of RL as the retest dataset. Averaged FOC maps of test and retest datasets under resting state and motor task conditions were computed, respectively, and the correlation between test and retest FOC across all WM voxels was calculated for each condition.
RESULTS and DISCUSSION
The group FOC map with 3mm of interpolation radius across 64 subjects in MNI space is shown in Figure 2. First, both resting state and motor task conditions have higher FOC within several WM regions which engage in default mode network or visual function such as cingulum, fornix (Figure 2d, e) and visual WM pathways (Figure 2a, b). Second, the map of motor task has generally higher FOC compared to the map of resting state (Figure 2j, k). In particular, several WM areas associated with the motor task are highlighted in the map of the FOC difference (motor-rest), such as posterior limb of internal capsule (Figure 2c), region under M1 (Figure 2f), and spinal cord (Figure 2i).As expected, FOC decreases non-linearly as interpolation radius (|V|) increases (Figure 3). Though the FOC difference between task and rest conditions increases as radius increases, the standard deviation increases. The averaged effect size is largest when interpolation radius is 2.5mm or 3mm.
The correlations between test and retest datasets under resting state and task conditions were 0.61(p<0.0001) and 0.52 (p<0.0001).
CONCLUSION
This study indicates that the proposed metric, FOC, reflects synchronization of BOLD signals along local fiber orientations and may be valuable for understanding the nature of the neurovascular coupling and apparent functional connectivity with WM.Acknowledgements
The project is supported by the NIH grant R01 NS093669 and a Vanderbilt University Discovery Grant 600670. We also thank the Vanderbilt Advanced Computing Center for Research and Education (ACCRE) for the support of cluster computation.References
1. Gore, J. C. et al. Functional MRI and resting state connectivity in white matter - a mini-review. Magn. Reson. Imaging 63, (2019).
2. Ding, Z. et al. Detection of synchronous brain activity in white matter tracts at rest and under functional loading. Proc. Natl. Acad. Sci. U. S. A. 115, (2018).
3. Ding, Z. et al. Visualizing functional pathways in the human brain using correlation tensors and magnetic resonance imaging. Magn. Reson. Imaging 34, 8–17 (2016).
4. Ding, Z. et al. Spatio-Temporal Correlation Tensors Reveal Functional Structure in Human Brain. PLoS One 8, e82107 (2013).
5. Schilling, K. G. et al. Functional tractography of white matter by high angular resolution functional-correlation imaging (HARFI). Magn. Reson. Med. 81, (2019).
Figures