3873
Model-free mapping of neural activation in brain white matter based on local fiber architecture1Vanderbilt University Medical Center, Nashville, TN, United States
Synopsis
We propose a model-free method to detect BOLD signal changes in brain white matter (WM) without an assumption of a hemodynamic response function or a linear shift-invariant response as assumed in conventional general linear models. Instead, neural activations are measured by the synchrony of BOLD signals under constraints of the anisotropic architecture of WM fibers. A 60 subject sub-group sourced from the Human Connectome Project database was used to validate the proposed method at a group level. Our results demonstrate that the proposed method can probe neural activations in WM with high sensitivities and high specificities.
Purpose
The detection of changes in BOLD signals in WM in fMRI studies using a general linear model (GLM) for analysis is often not successful. This is partly because the assumption of a linear, shift-invariant response may not apply to WM if it has spatially varying hemodynamic response functions [1, 2] and because of the effects of brain activities that are unrelated to an external stimulus [3, 4]. We propose a model-free approach to map activation in WM using a metric of BOLD signal synchrony which is tailored to the constraints of anisotropic functional connectivity profiles isomorphic to the architecture of WM fibers.Methods
Algorithm of WM activation mappingThe algorithm of the proposed approach consists of two major steps, which are implemented on a voxel-by-voxel basis (Fig. 1). In the first step, a fiber-architecture-informed spatial window is designed for each voxel using orientation distribution functions (ODFs) constructed from high angular resolution diffusion imaging data (HARDI). Specifically, a subject-specific voxel-wise WM graph is first constructed using ODFs [5, 6], where the weighted connection of two neighboring voxels in the graphs is determined by the coherence of diffusion orientations. Based on the fiber-architecture-informed graph, a weighted spatial window Fi(j) is then created for a voxel at a position i by simulating diffusion on the graph [7] from a point source located at the voxel. In the second step, a modified principal component analysis (PCA) is used to estimate the synchrony of fMRI time courses in a neighborhood centered at a voxel based on the spatial window obtained from the first step. Here, we refer to the modified PCA based on the fiber-architecture-informed window as FAIW-PCA. In this step, normalized time courses are rearranged into a matrix (X) of dimension T × M, where T denotes the number of time frames and M the number of voxels within the window Fi(j). A time course in X can be denoted as xi, a column of matrix X. The FAIW-PCA can be derived as an optimization problem, where the first principal component v1 can be obtained by
$$\boldsymbol{v}_{1}=\arg \max _{\|v\|=1}\left\{\sum_{j=1}^{M} \mathbf{F}_{i}(j) \cdot\left(\boldsymbol{x}_{j} \cdot \boldsymbol{v}\right)^{2}\right\}. \ \ \ \ \ \ (1)$$
We further write this optimization in matrix form,
$$\boldsymbol{v}_{1}=\arg \max _{\|\boldsymbol{v}\|=1}\left\{\boldsymbol{v}^{T} \mathrm{X}^{T} \mathrm{QX} \boldsymbol{v}\right\}, \ \ \ \ \ \ (2)$$
where the matrix Q = diag[Fi(1), Fi(2), ...,Fi(M)]. Then, Eq. 2 can be written as
$$\boldsymbol{v}_{1}=\arg \max \left\{\frac{v^{T} \mathrm{H} v}{v^{T} v}\right\}, \ \ \ \ \ \ (3)$$
where H = XTQX. H is a positive-definite matrix so it has a complete set of orthonormal eigenvectors {vλ }λ=1,2, ..., M and associated eigenvalues {σλ }λ=1,2, ..., M that satisfy Hvλ = σλvλ . The quantity to be maximized in Eq. 3 is a Rayleigh quotient. The quotient's maximum possible value is the largest eigenvalue of the matrix σ1, which occurs when v is the corresponding eigenvector v1. Finally, the synchrony of time courses is estimated by $$\text { Synchrony }=\sigma_{1} / \sum_{\ell=1}^{M} \sigma_{\ell} . \ \ \ \ \ \ (4)$$
Validation of WM activation mapping on in vivo data
A 60 subject sub-group sourced from the WU-Minn Human Connectome Project (HCP) database [8] was used to validate the proposed method. The datasets were downloaded from the minimally preprocessed data in the HCP repository, which included four imaging sessions: resting-state fMRI, motor-task fMRI, T1-weighted MRI and diffusion-weighted MRI (i.e. HARDI). The FAIW-PCA was implemented on the HCP datasets after fMRI volumes were co-registered with HARDI images. Spatial patterns of activation were analyzed by referencing fiber structures conveyed by fractional anisotropy maps that are derived from diffusion MRI. Then, influences of task loading on WM BOLD signals are investigated by comparing activation maps estimated from the fMRI data in the two states.
Results and discussions
Results of the in vivo activation mapping are demonstrated and analyzed at a group level. Fig.2 show spatial patterns of synchrony in WM revealed by synchrony maps obtained in a resting state, which agree moderately well with anatomical structures identified in fractional anisotropy maps. In addition, the synchrony maps also reveal subtle variations that are not apparent in the anatomical structures. Then, we compare synchrony maps acquired in resting state with those acquired under motor task loading in Fig.3 with an emphasis on the M1-related region determined by fiber tracking. As demonstrated in the comparison of the two maps and the difference maps, numerous WM regions exhibit task-relevant increases in synchrony. Furthermore, obvious enhancements of synchrony are observed in the M1-related WM region. To further investigate the spatial specificity of the proposed method, we analyzed changes of synchrony in WM regions associated with M1 and the auditory cortex (BA-41&42, Brodmann areas 41 and 42). In Fig. 4, scatter pots show activations of voxels in the whole WM region, the M1-related WM region and the BA-41&42-related WM region, where distances from points to an identity line measure the degree of activations. Activations in the BA-41&42-related region are significant lower than those in the M1-related region and the whole WM region, which demonstrates the results are specific to the motor task.Conclusion
The proposed method can detect neural activations in WM with high sensitivities and high specificities.Acknowledgements
References
[1] Li, M., Newton, A.T., Anderson, A.W., Ding, Z. & Gore, J.C. Characterization of the hemodynamic response function in white matter tracts for event-related fMRI. Nat Commun 10, 1140 (2019).
[2] Courtemanche, M.J., Sparrey, C.J., Song, X., MacKay, A. & D'Arcy, R.C.N. Detecting white matter activity using conventional 3 Tesla fMRI: An evaluation of standard field strength and hemodynamic response function. Neuroimage 169, 145-150 (2018).
[3] Zhang, D. & Raichle, M.E. Disease and the brain's dark energy. Nat Rev Neurol 6, 15-28 (2010).
[4] Laird, A.R., et al. Behavioral interpretations of intrinsic connectivity networks. J Cogn Neurosci 23, 4022-4037 (2011).
[5] Abramian, D., et al. Diffusion-informed spatial smoothing of fMRI data in white matter using spectral graph filters. Neuroimage 237, 118095 (2021).
[6] Iturria-Medina, Y., et al. Characterizing brain anatomical connections using diffusion weighted MRI and graph theory. Neuroimage 36, 645-660 (2007).
[7] Turner, R. How much cortex can a vein drain? Downstream dilution of activation-related cerebral blood oxygenation changes. Neuroimage 16, 1062-1067 (2002).
[8] Van Essen, D.C., et al. The WU-Minn Human Connectome Project: an overview. Neuroimage 80, 62-79 (2013).
Figures
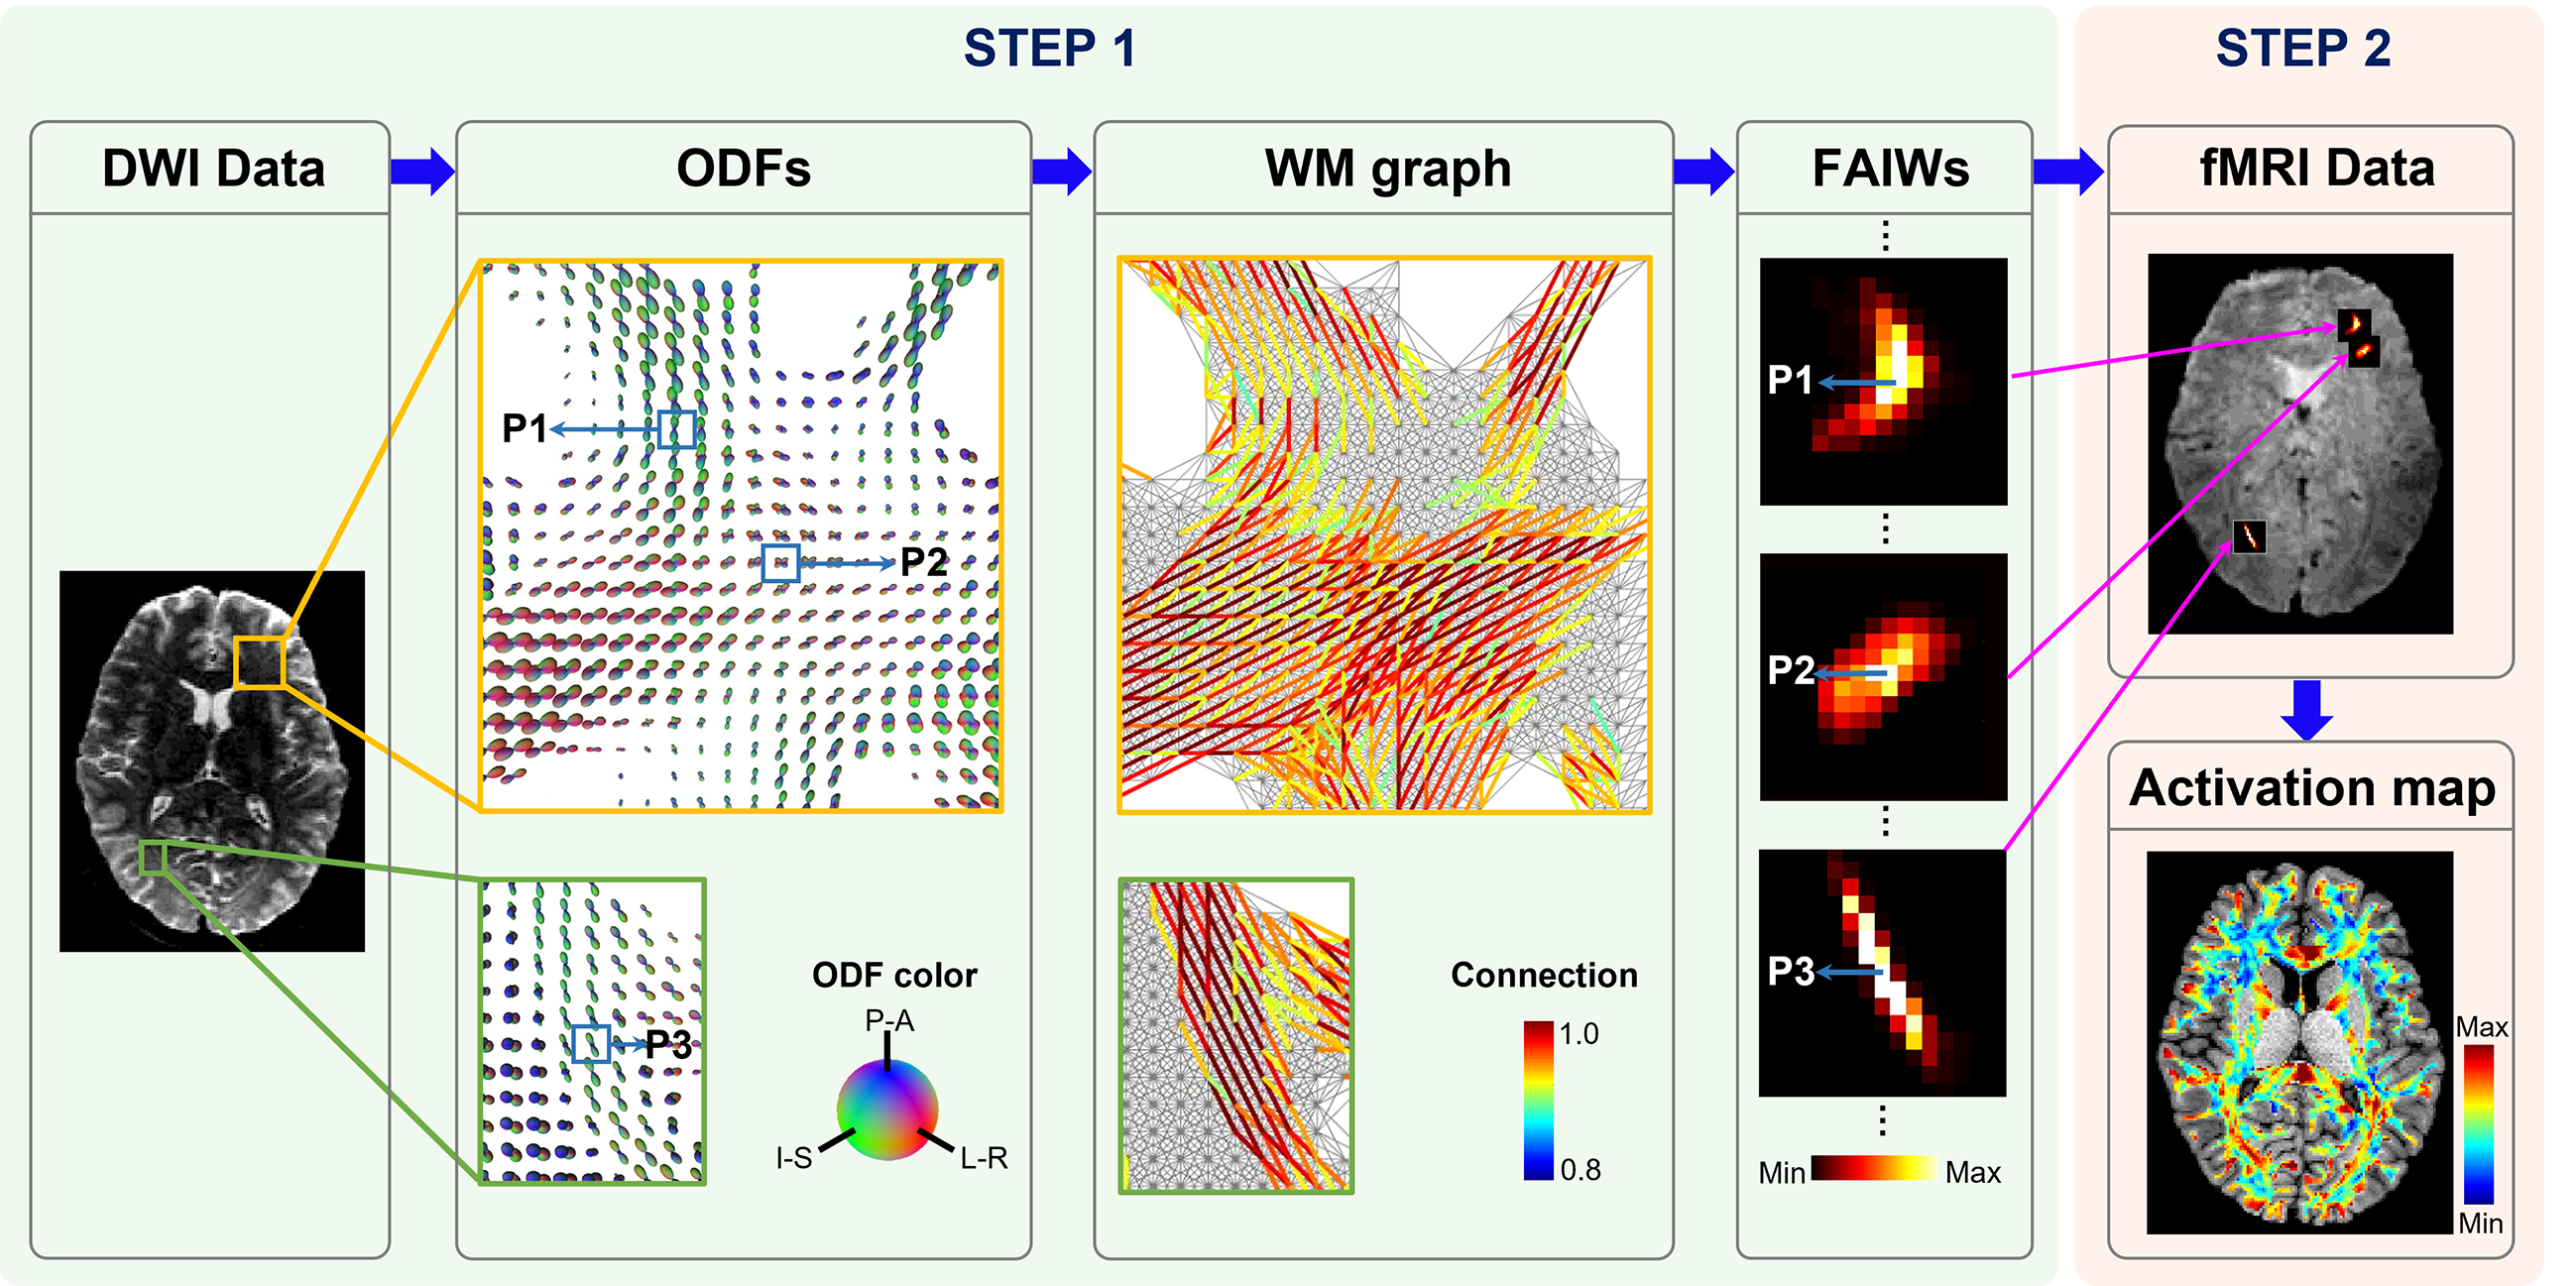
Fig. 1. Schematic of model-free mapping of neural activation in human white matter (WM). First, a spatial window is created for each voxel based on local fiber architectures. In this step, orientation distribution functions (ODFs) provide the information on fiber architectures, which are further used to generate a graph. Then, diffusion on the graph with a point source located at each vertex is simulated to produce a fiber-architecture-informed window (FAIWs). Second, a modified PCA is implemented to estimate the synchrony of fMRI time courses based on the FAIWs.
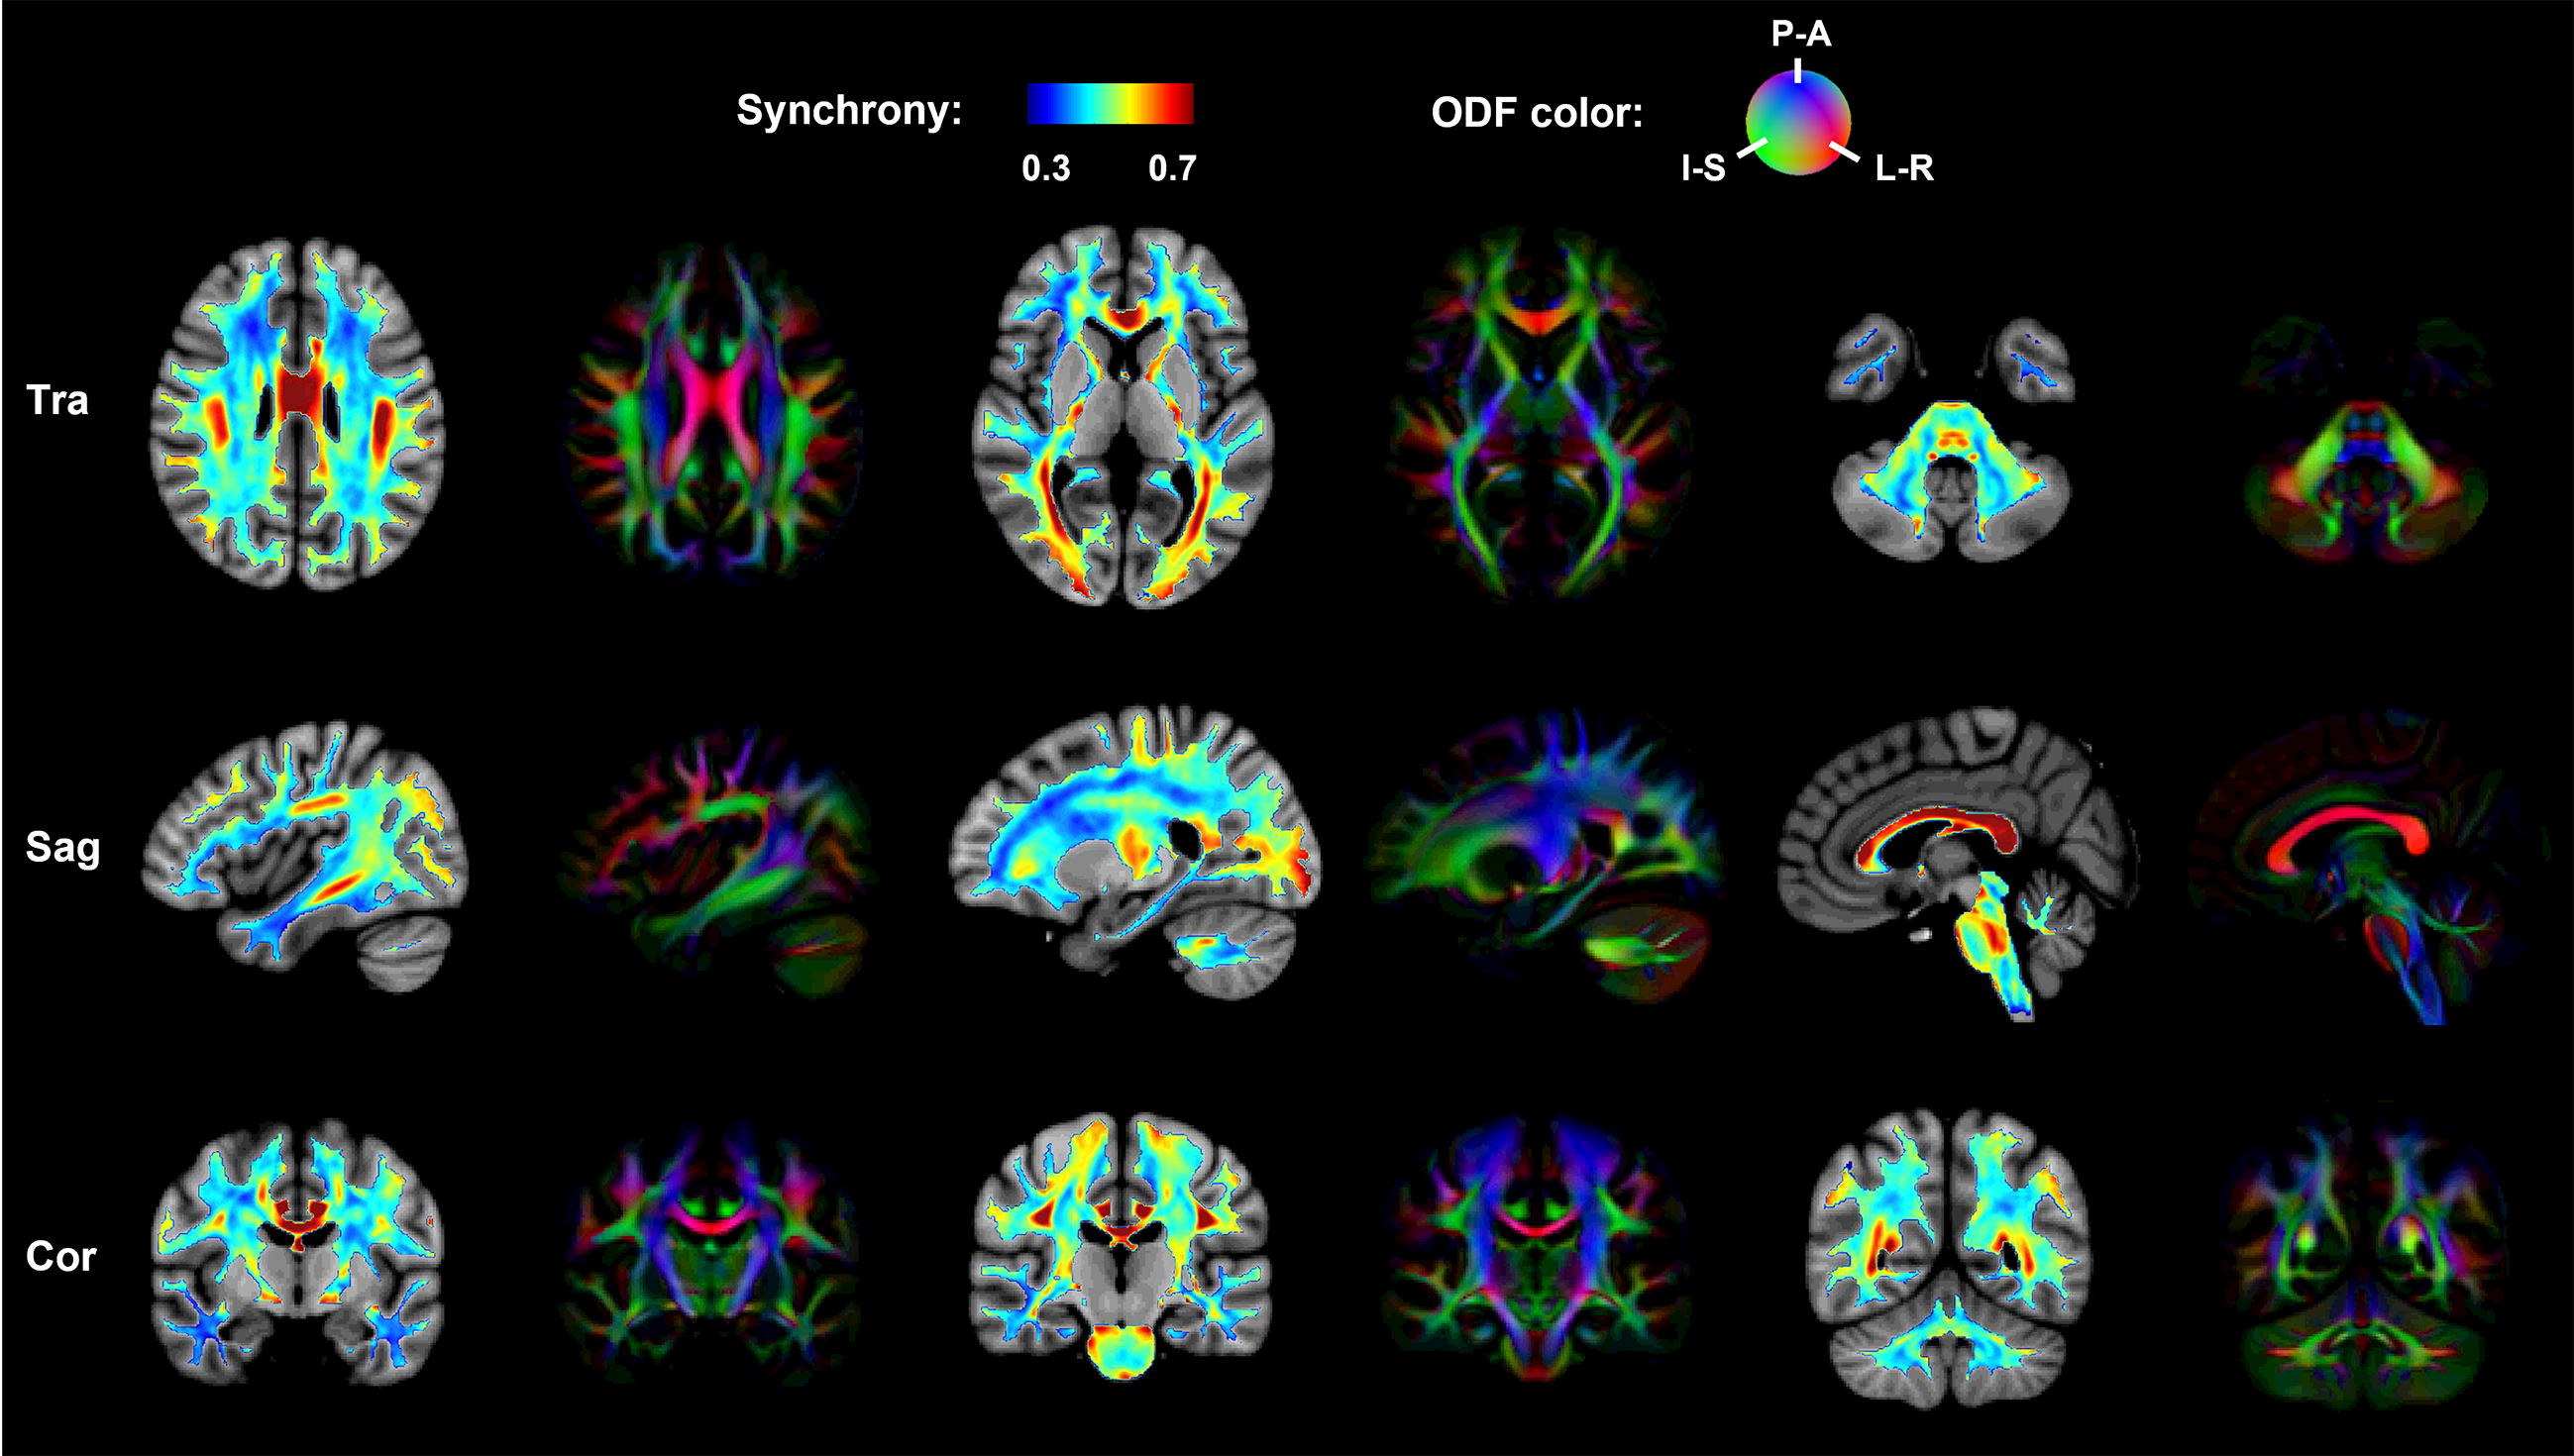
Fig. 2. Group-average activation maps obtained from 60 participants and fractional anisotropy (FA) maps from one representative participant. Spatial patterns of synchrony in WM revealed by the activation maps obtained in resting state agree moderately well with anatomical structures identified in FA maps derived from diffusion MRI. In addition, the synchrony maps also reveal subtle variations that are not apparent in the anatomical structures.
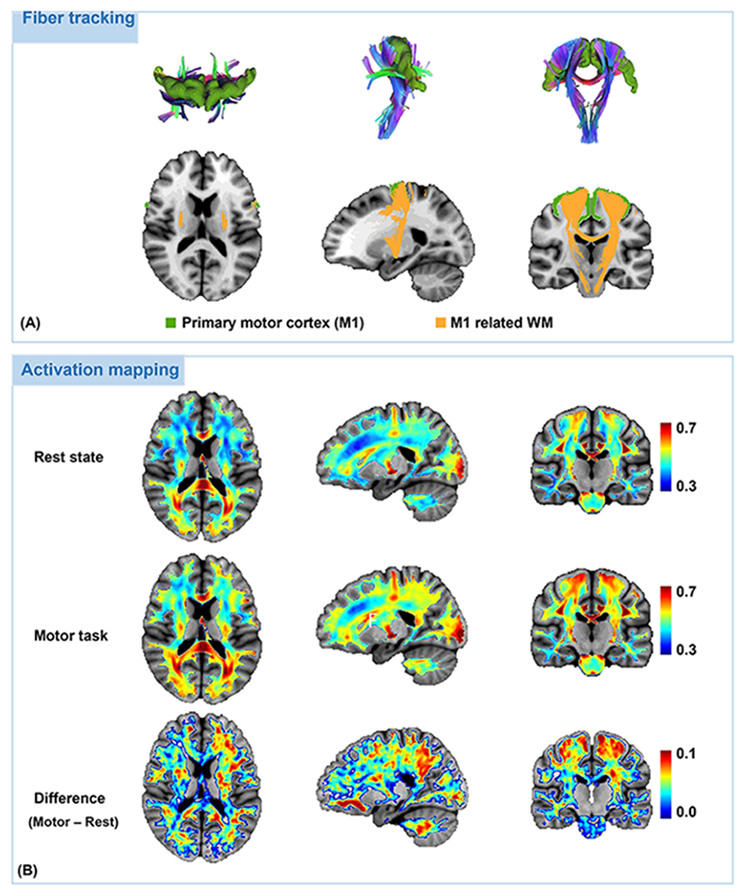
Fig. 3. Fiber tracts associated to the primary motor cortex and comparison of group-average activation maps obtained from resting-state fMRI data and motor-task fMRI data. Fiber tracking was implemented to extracts the WM regions related to the primary motor cortex (M1). As demonstrated in the comparison of the two activation maps and their difference maps, task-relevant enhancements of synchrony exhibit in numerous WM regions, which becomes more pronounced in the M1 related regions determined in A.
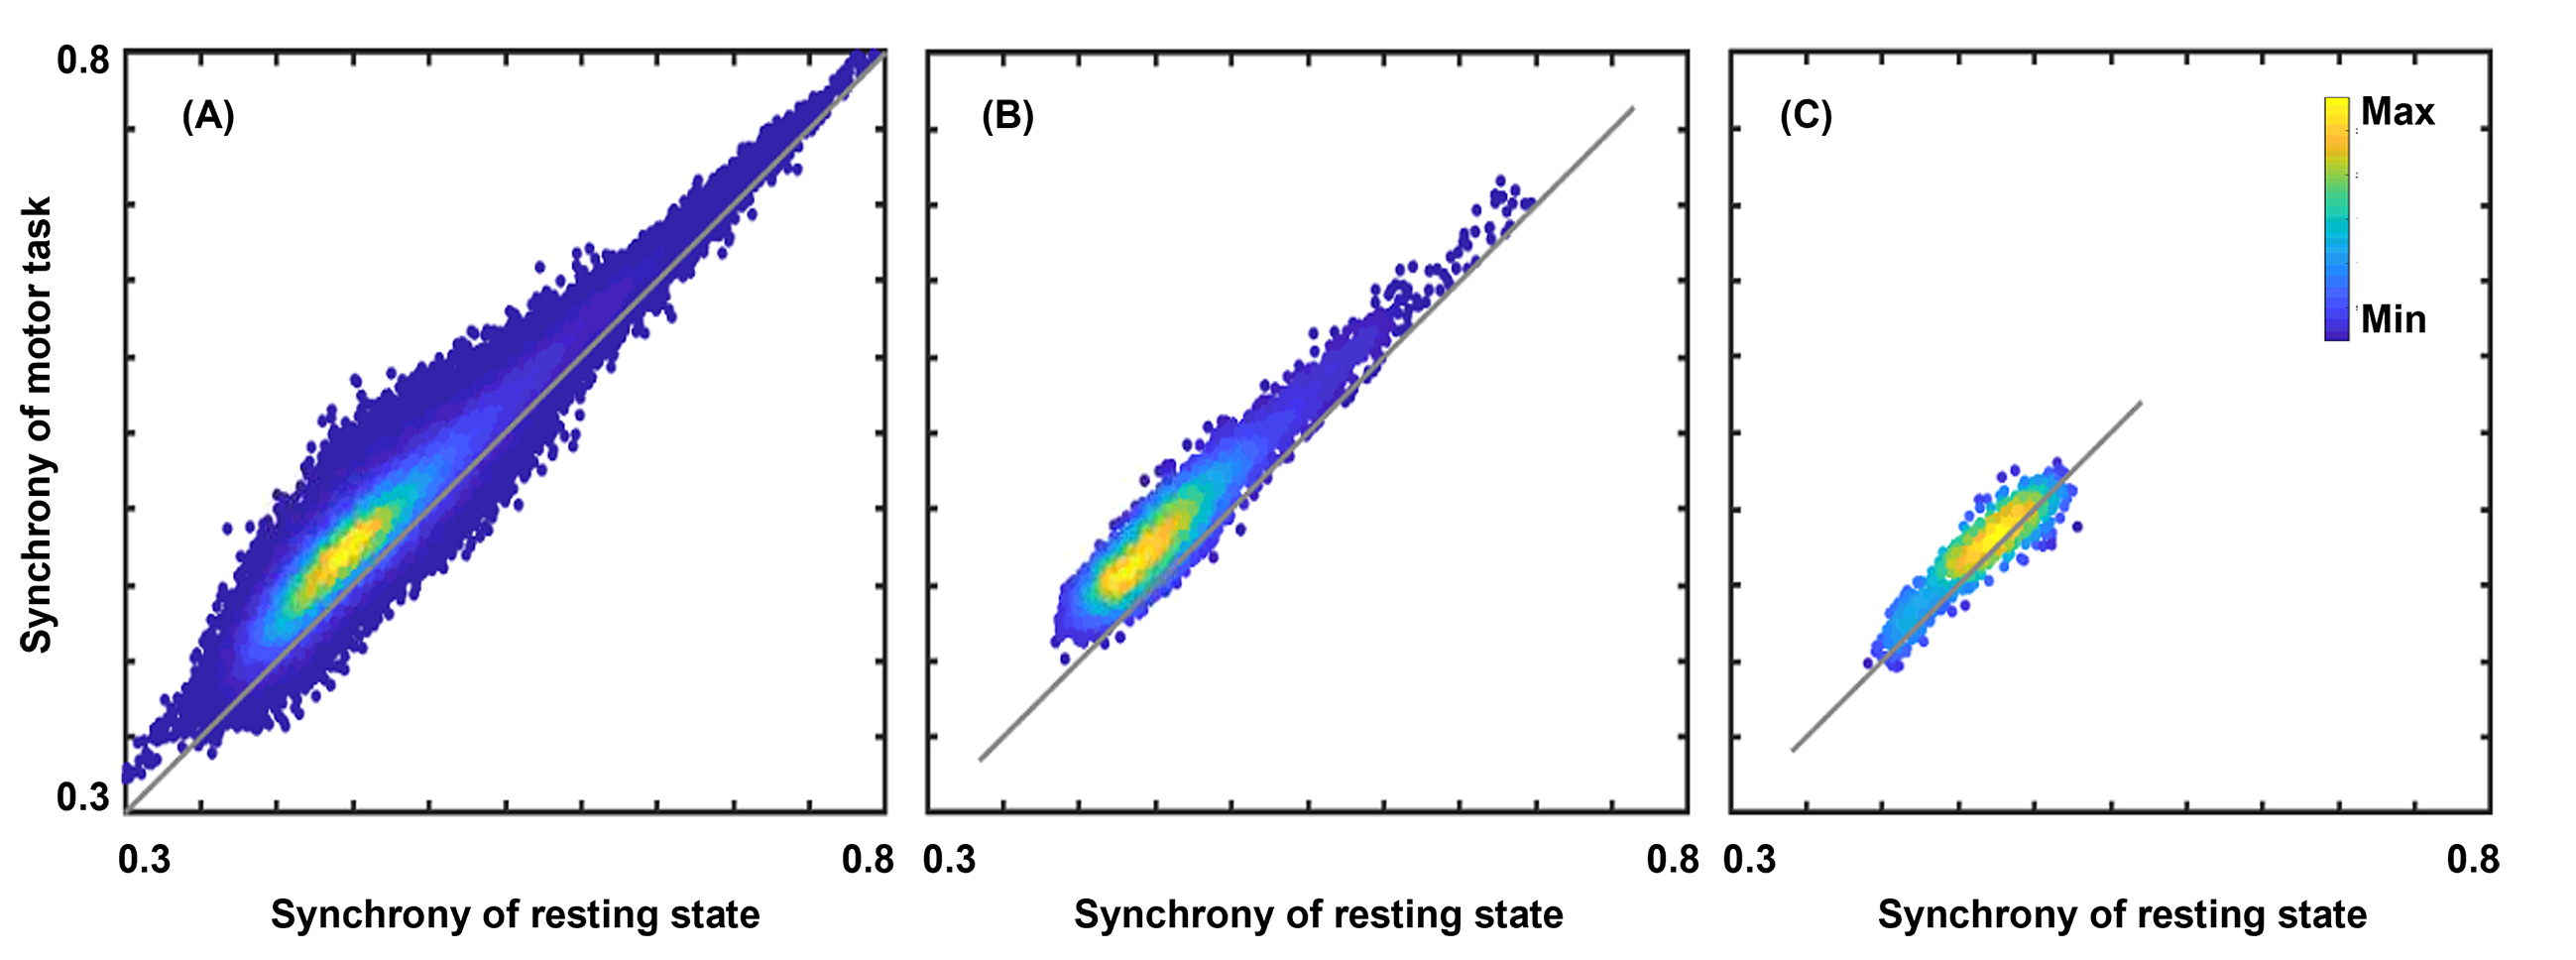
Fig. 4. Scatter pots of activations for the voxels in the whole white matter (WM) region (A), the primary-motor-cortex related WM region (B) and the auditory-cortex related WM region (C). Distances from points to an identity line measure the degree of activations. Activations in the primary-motor-cortex related WM region are significantly higher than those in other two regions, which demonstrates good specificities of the proposed method of activation mapping.