3871
Diagnostic Ultra-low-dose 18F-PI-2620 Tau PET/MRI with Generative Adversarial Network-based Enhancement1National Taiwan University, Taipei, Taiwan, 2Stanford University, Stanford, CA, United States, 3Meharry Medical College, Nashville, TN, United States
Synopsis
With the focal and lower uptake in tau PET imaging compared to other tracers such as amyloid, we aim to use multimodal simultaneous PET/MR imaging combined with training a generative adversarial network (GAN) to enhance ultra-low-dose 18F-PI-2620 tau PET images. We showed that the deep learning-enhanced images greatly reduced image noise as compared to the ultra-low-dose images, outperformed the ultra-low-dose images metrics-wise, and were able to be read clinically for regional uptake patterns of tau accumulation similarly as the full-dose images.
Introduction
The simultaneous spatiotemporally co-registered morphological and functional information acquired from a hybrid PET/MRI provides the opportunity of leveraging the synergy of these two complementary modalities such that one modality could be used to enhance the other1. In neurodegenerative diseases such as Alzheimer’s disease, simultaneous PET/MRI provides a “one-stop shop” to acquire biomarkers such as neurodegeneration provided by MRI and amyloid deposition or pathologic tau as provided by PET2. However, to enable large-scale imaging studies of dementia with frequent follow-ups, a reduction of injected radiotracer dose and the enhancement of the degraded image quality after reconstruction needs to be addressed.With deep learning-based methods, we have previously demonstrated the use of U-Net-based methods that incorporate spatially correlated multimodal MR and PET information to produce high quality 18F-florbetaben amyloid PET images from scan protocols with markedly reduced injected radiotracer dose (as low as ~1% dose)3. However, for tau radiotracers, where the uptake is focal, has greater image noise, and the signal is weaker than that of amyloid, we have also shown in the second-generation tau tracer 18F-PI-26204 that it is important to take data bias stemming from the use of different tracers into account and to either re-train or fine-tune networks using tracer-specific data5. In this project, we aim to investigate whether a generative adversarial network (GAN)6 can enhance ultra-low-dose tau PET images and whether the generated images are of diagnostic quality.
Methods
PET/MR data acquisition44 participants (18 female, 70.2±7.5 years) were recruited to train the ultra-low-dose tau GAN; 221±61 MBq of the tau radiotracer 18F-PI-2620 was injected. T1-weighted and T2-FLAIR MRI were acquired simultaneously with the PET data (60-90 minutes post-injection) on an integrated PET/MR scanner (SIGNA PET/MR, GE Healthcare). The raw list-mode PET data were reconstructed for the full-dose ground truth image; a subset of the list mode consisting of 1/20 of the events (simulating 5% dose and accounting for random events) was also reconstructed to produce an ultra-low-dose PET image.
GAN implementation
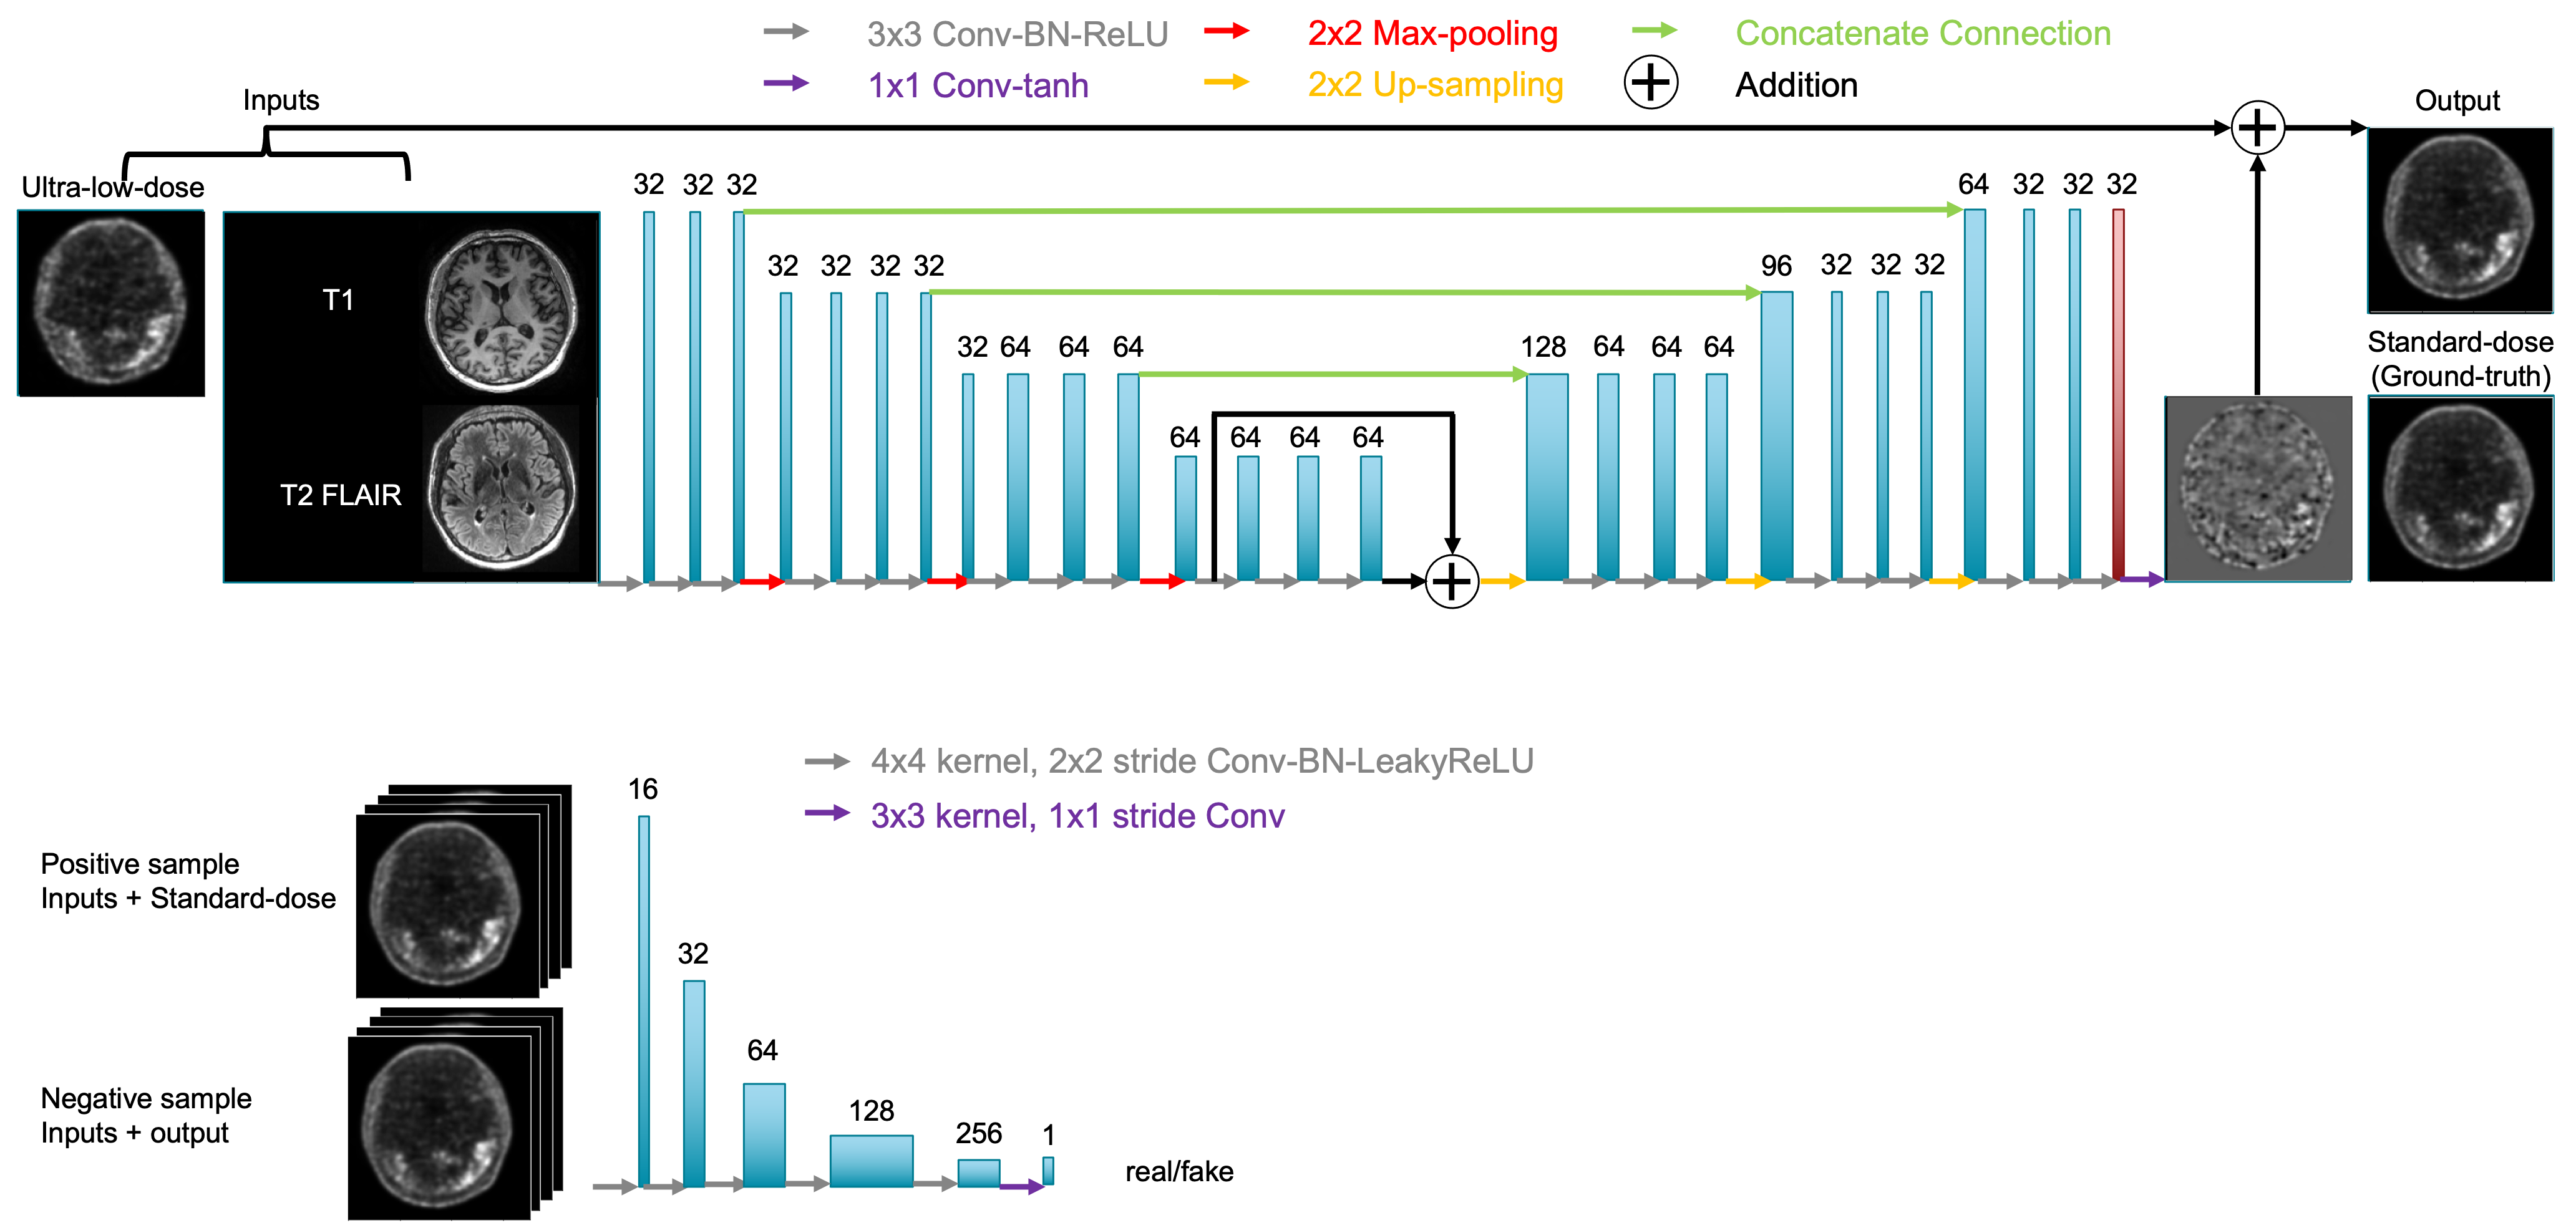
A GAN architecture was trained for the ultra-low-dose tau PET enhancement. The generator portion, based on the structure in Chen et al. (Figure 1, top) was trained with the inputs of the multi-contrast MR images (T1 and T2 FLAIR-weighted) and the ultra-low-dose PET image with the full-dose PET image treated as the ground truth. The discriminator (Figure 1, bottom) was added to distinguish whether the output image was realistic or not. The final loss function for the GAN was the linear combination of a pixel-wise L1 loss and an adversarial loss. The network was trained with an initial learning rate of 0.0001 and a batch size of 16 over 50 epochs; 5-fold cross-validation was used to effectively use all datasets for training and testing.
Data analysis
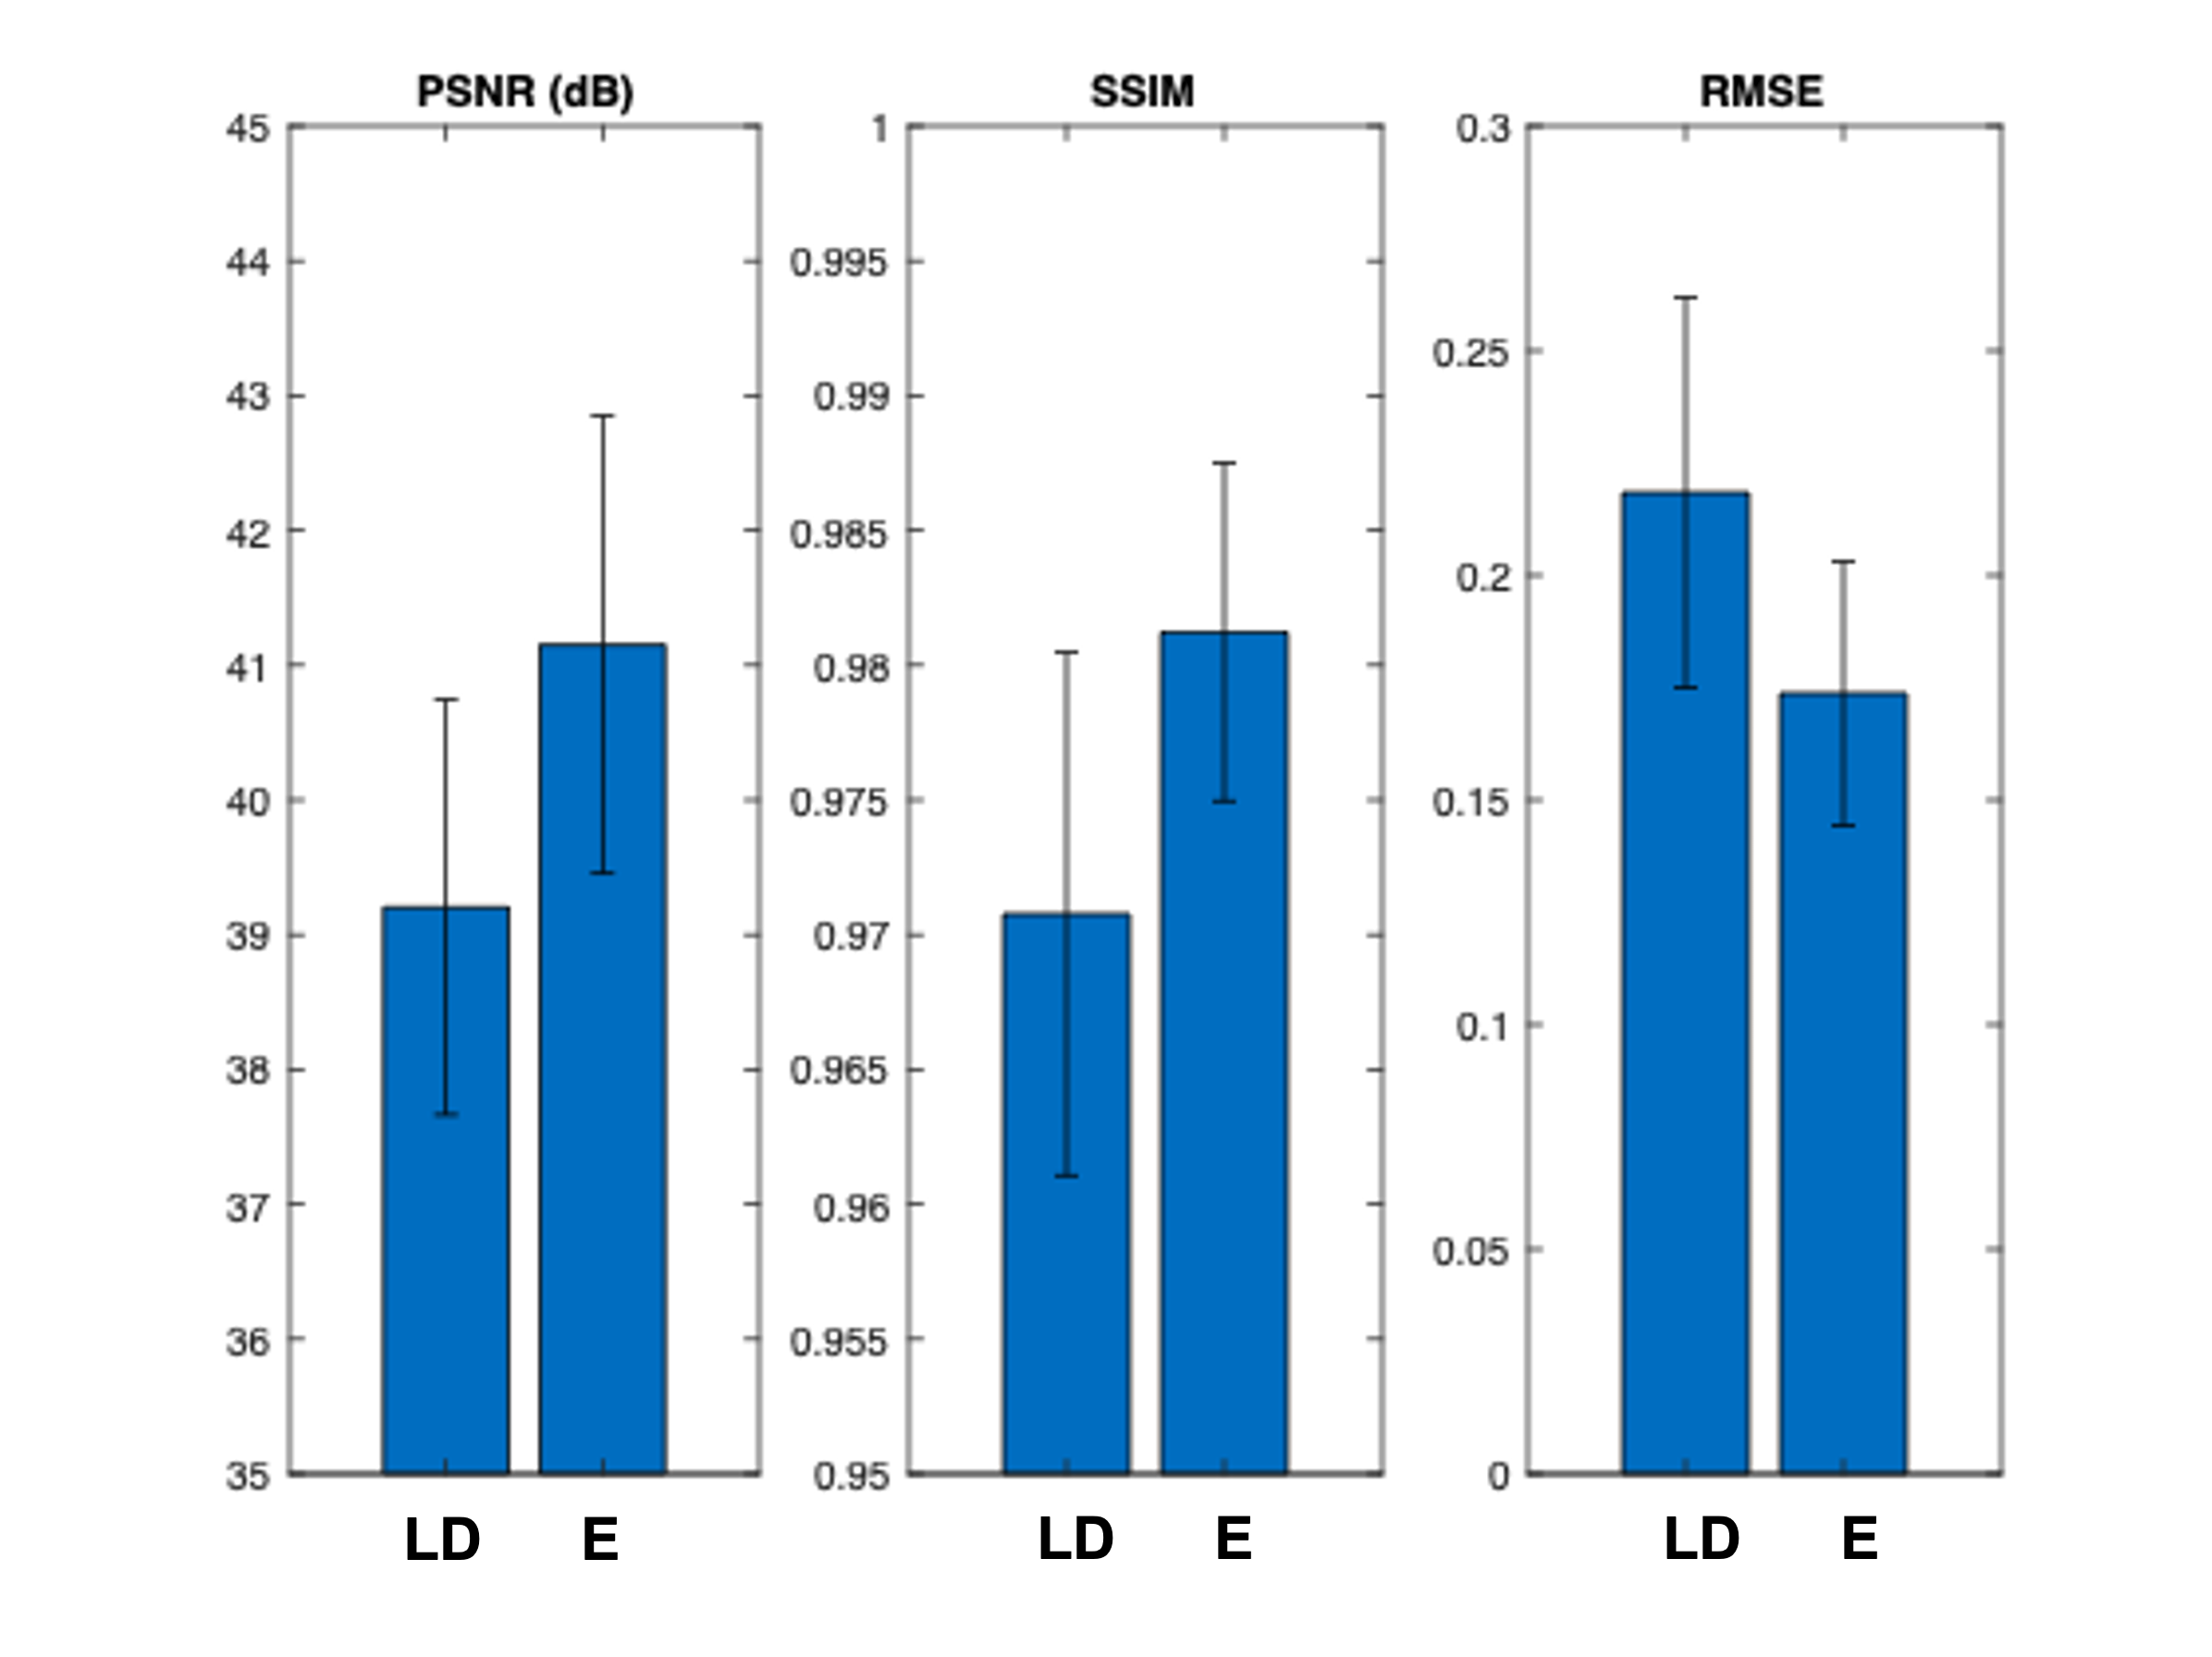
A FreeSurfer-derived brain mask for each participant was used for voxel-based analyses. For each axial slice of the volumes, the image quality of the enhanced PET and the ultra-low-dose PET images within the brain mask were compared to the original full-dose image using the metrics peak signal-to-noise ratio (PSNR), structural similarity (SSIM), and root-mean-squared error (RMSE). The values were weighted by voxel number per slice and averaged to derive a set of metrics per participant. Paired t-tests at the p=0.05 level were used to compare the metrics derived from different image types.
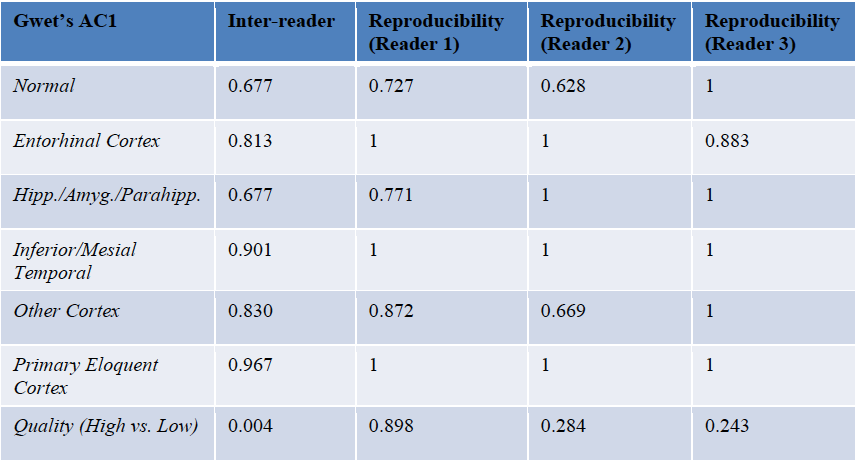
Three clinicians were recruited to perform a reader study on the images, where the full-dose, ultra-low-dose, and enhanced images were randomly presented and evaluated. The tau uptake status was determined by evaluating the uptake in various brain regions. The full-dose image reads of each reader were treated as the ground truth. For each PET image, the readers also assigned an image quality score on a five-point scale: 1=uninterpretable, 2=poor, 3=adequate, 4=good, 5=excellent which was further grouped into “high quality (3-5)” and “low quality (1, 2)” scores. Ten random full-dose images were also read a second time to evaluate intra-reader reproducibility; the intra- and inter-reader agreements were evaluated with Gwet’s agreement coefficient 1 (AC1)7.
Results and Discussion
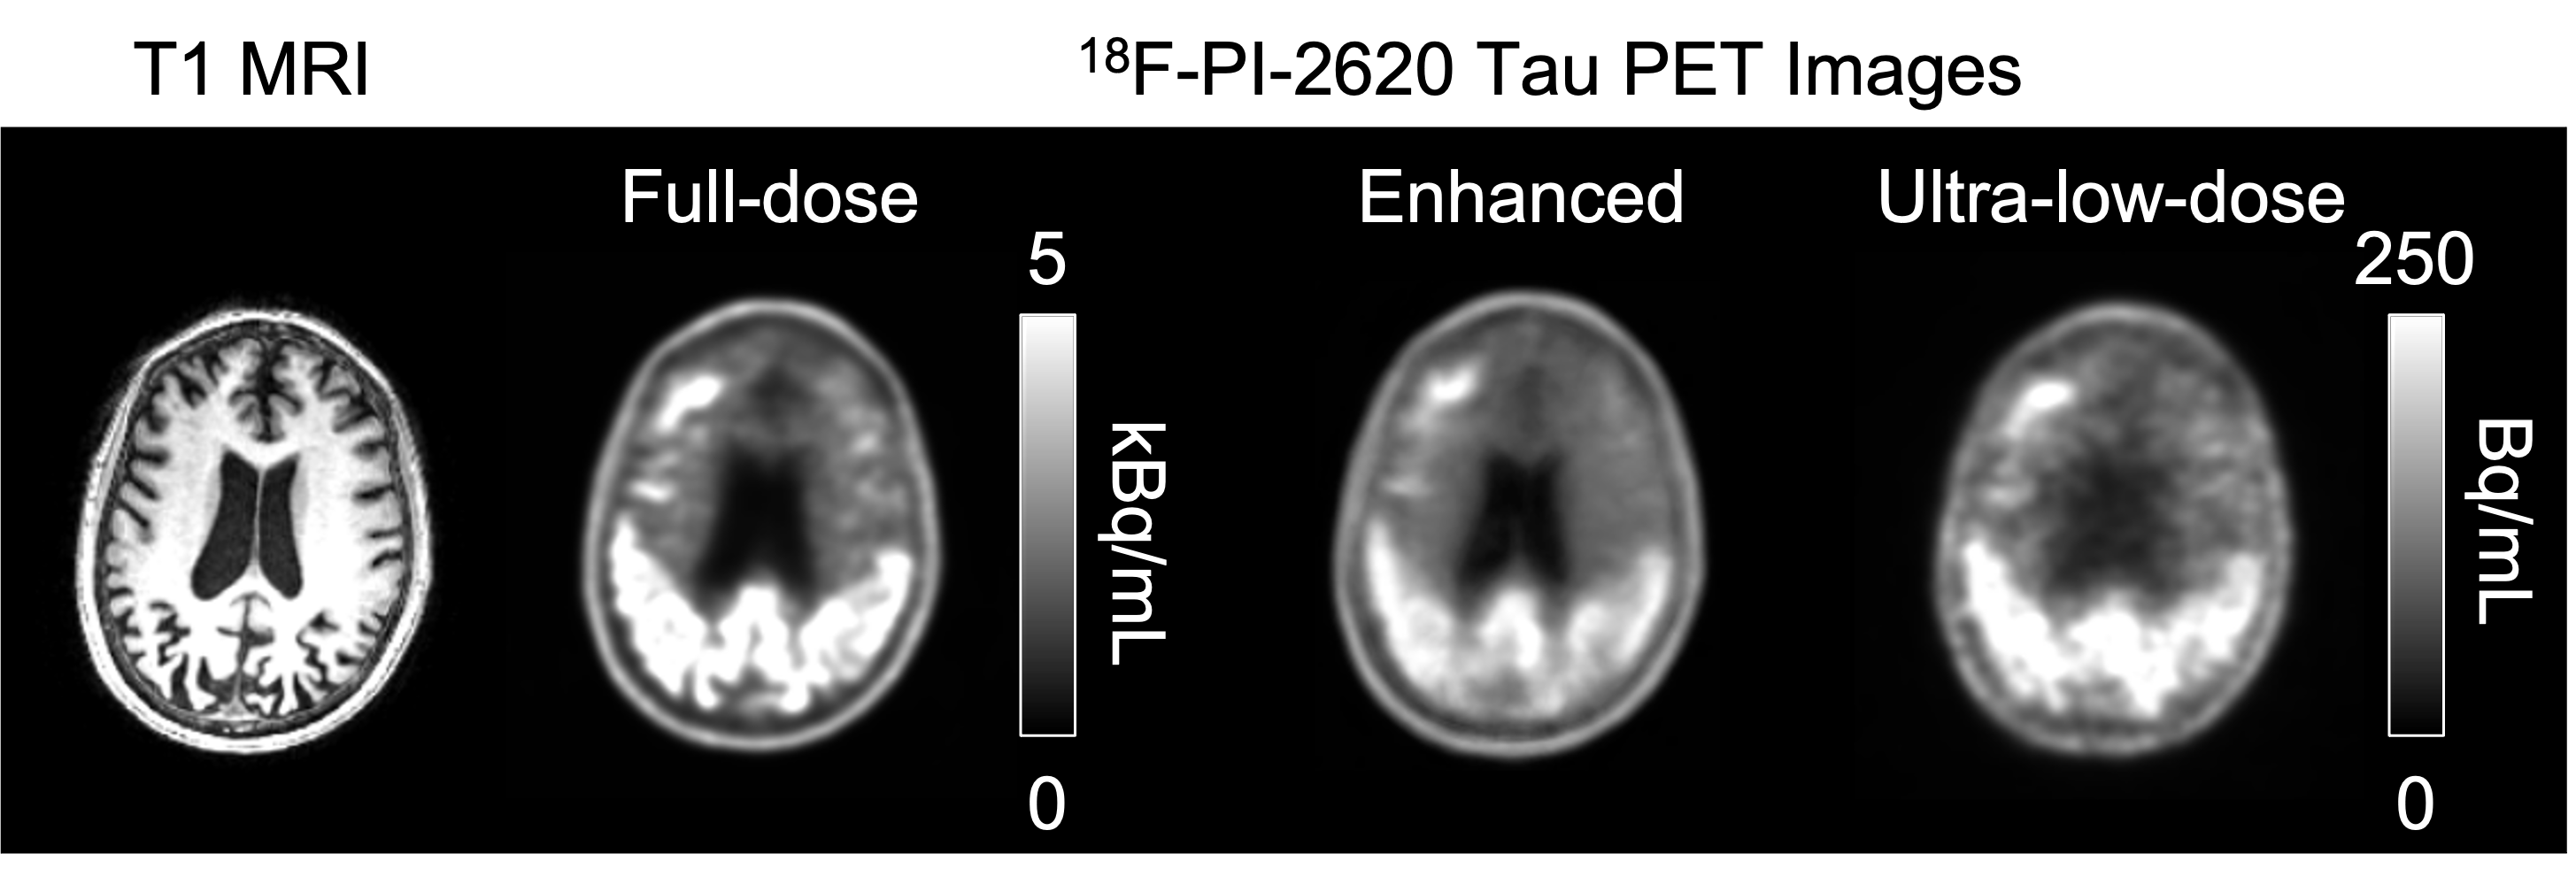
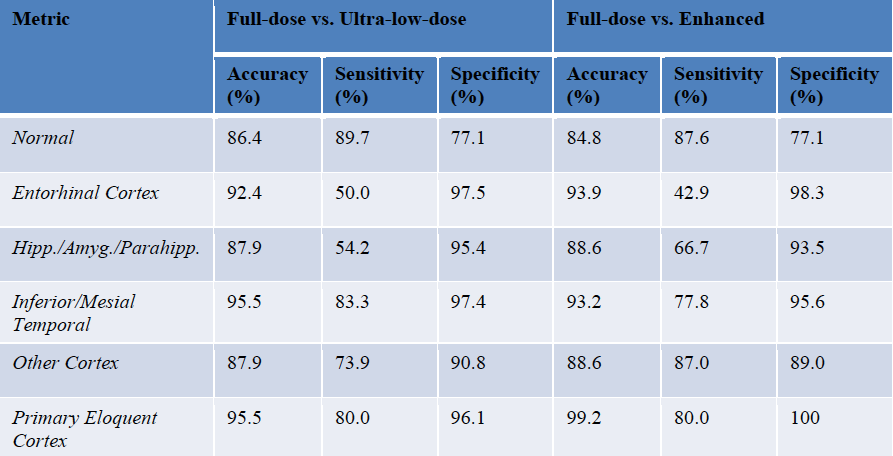
Qualitatively, the synthesized tau images showed significant noise reduction compared to the low-dose image (Figure 2). Non-inferiority tests at a predetermined threshold of -15% for subjective image quality showed that the full-dose images were scored higher (based on the dichotomized scale) than the low-dose and enhanced images.Quantitatively, the three metrics all improved significantly after enhancement (p<0.05/3, Figure 3). The intra-reader reproducibility and inter-reader agreement were high in reading the full-dose images. Between image types, the readers also had high agreement in evaluating the status of tau uptake in the regions (Gwet’s AC1>0.65, Table 1); the uptake in the low-dose and enhanced images was read accurately (accuracy>0.84 for all relevant regions, Table 2) compared to their full-dose counterparts.
Conclusion
The deep learning-enhanced images were able to be read clinically for regional uptake patterns of tau accumulation similarly as the full-dose images. This technique can potentially increase the utility of hybrid PET/MR imaging in clinical diagnoses and longitudinal studies.Acknowledgements
This project was made possible by NIH P41-EB015891, R01-EB025220-03W1, K99-AG068310-01A1, the Stanford Alzheimer’s Disease Research Center, the National Taiwan University grant 110L7437, GE Healthcare, and Life Molecular Imaging.References
1. Catana C, Drzezga A, Heiss WD, Rosen BR. PET/MRI for neurologic applications. J Nucl Med. 2012;53(12):1916-1925.
2. Jack CR, Jr., Bennett DA, Blennow K, et al. NIA-AA Research Framework: Toward a biological definition of Alzheimer's disease. Alzheimers Dement. 2018;14(4):535-562.
3. Chen KT, Gong E, de Carvalho Macruz FB, et al. Ultra-Low-Dose (18)F-Florbetaben Amyloid PET Imaging Using Deep Learning with Multi-Contrast MRI Inputs. Radiology. 2019;290(3):649-656.
4. Mueller A, Bullich S, Barret O, et al. Tau PET imaging with (18)F-PI-2620 in Patients with Alzheimer Disease and Healthy Controls: A First-in-Humans Study. J Nucl Med. 2020;61(6):911-919.
5. Chen KT, Adeyeri O, Toueg TN, Mormino E, Khalighi M, Zaharchuk G. Generalizing Ultra-low-dose PET/MRI Networks Across Radiotracers: From Amyloid to Tau. Paper presented at: Annual Meeting ISMRM 20212021; Vancouver, BC, Canada.
6. Goodfellow IJ, Pouget-Abadie J, Mirza M, et al. Generative Adversarial Nets. Advances in Neural Information Processing Systems 27 (Nips 2014). 2014;27.
7. Gwet KL. Computing inter-rater reliability and its variance in the presence of high agreement. Br J Math Stat Psychol. 2008;61(Pt 1):29-48.
Figures