3870
Analytical B0 shimming from 3D survey scans: feasibility and impact on EPI image quality1Philips Research, Bangalore, India, 2Philips Healthcare, Bangalore, India
Synopsis
The inhomogeneity in the main magnetic field (B0) leads to SNR loss and image artifacts. B0 inhomogeneity increases with the field strength, thus leading to more pronounced B0 inhomogeneity at 3T and beyond. However repeated B0 map acquisition for shimming and for image reconstruction is time consuming. We show that subject-specific B0 and the corresponding shim settings can be predicted accurately using pseudo-CT generated from MR images – potentially obviating the need for a B0 scan. We propose an alternative approach based on image co-registration techniques that yields comparable results using survey images, without the need of any additional scans.
Introduction
Magnetic field inhomogeneity, is one of the persistent issues at high fields. This is usually addressed using efficient shimming and post-hoc correction in reconstruction, both requiring acquisition of B0 maps which is time-consuming. Computation of B0 map is possible from a known susceptibility distribution1 through delineation of air-tissue-bone interfaces in the brain.This has been shown to be feasible using CT images of the subject undergoing the MRI, as input1,2. However, the availability of a brain CT image for each subject is unrealistic. In this work, we evaluated the use of pseudo-CTs generated using FDA approved Philips’ MRCAT Brain3,10 software from subjects’ own MRI data. We also propose an alternative approach using image co-registration techniques to compute subject-specific B0. We assess the quality of predicted B0 maps at 3T and their impact on the EPI images, when these predicted maps were used for shimming.Method
Seven healthy adult volunteers were imaged on a 3.0T Ingenia system (Philips) after obtaining informed consent. Scan protocol – 3D Survey, mDIXON and B0 map acquisition (used as ground-truth) with coverage till the neck region (see figure captions for seq. parameters). A total of 14 datasets were obtained with multiple head orientations for some of the subjects. Pseudo-CTs were generated from the mDIXON data using MRCAT Brain software10. Susceptibility values of 0, -9.6, -10.2, and -4.5 (in ppm) were assigned to air, soft-tissue, bone, and mastoid respectively, based on subject-specific optimizations and subsequent averaging across all the datasets. The susceptibility values obtained closely match those discussed in literatures5,9. B0 computation was then performed using the Fourier-based analytic method1,5-7. Alternatively, with a template MR image and the corresponding susceptibility map, we obtained subject-specific susceptibility maps through deformable image co-registration of the template to the input 3D survey images (turbo field echo, TR/TE, FA, resolution). Accuracy of predicted B0 maps, from either approach was evaluated by comparing them with the ground-truth of acquired B0 maps.Additionally, 11 EPI image volumes from 7 volunteers, were acquired after B0 shimming performed based on predicted B0 maps from the co-registration approach. We assessed SNR changes in the EPI images, resulting from predicted- B0-based shimming vs. conventional shimming. Singe shot, full k-space EPI images were acquired with a) scanner computed linear shims (auto-shim (AS)), b) scanner computed up to 2nd order shims from 3D B0 map acquisition (Smart Shim (SS)) and c) 2nd order shim currents computed from analytically predicted B0 maps (AN). Three regions of interest (ROIs) - Left temporal lobe, Right temporal lobe, and frontal lobe – that are typically affected by B0 inhomogeneity, were chosen for SNR analysis in EPI images without any geometric corrections. Quantitative SNR analysis was performed for data from 4 of the 7 subjects as the remaining data was corrupted by inter-scan subject motion.
Results
Figure 1 illustrates the analytic computation pipelines using MR input alone. Figure 2 shows the predicted B0 and its residual for different experiment settings for a single subject for MRCAT-based and co-registration based predictions. Figure 3 shows that B0 computation using the former approach is consistently better than the latter, across the datasets. In Fig. 4, the yellow circled ROI indicates a marked improvement in SNR by using shim currents predicted via analytical method (co-registration approach) as opposed to inbuilt shim computation. The corresponding density plots are the signal intensity values in the chosen ROI. Fig 5 shows a results of quantitative SNR analysis from 4 of the volunteers. 5a and 5b clearly indicate that analytic-based prediction outperforms image-based shimming. 5c shows the SNR computed across three regions. 5d shows the volume over which the SNR was computed for each region.Discussion
In this work, we have shown that the image co-registration technique to generate subject-specific susceptibility maps is effective to compute the B0 maps from survey images alone. The residual B0 maps shown in Figures 2 & 3 clearly indicate that this method can effectively replace B0 map acquisitions for the purpose of shimming, thereby reducing scan time. Unlike state-of-the-art image-based shimming, our algorithm performs shimming only for the brain region which also caused an improved SNR. The overall improvements reported here include contributions from both reduced distortion and improved intra-voxel coherence because of better shimming. Besides shimming, accurate B0 prediction can also help to improve reconstructions through the prediction of residual B0 maps, which again can lead to saving in time (E.g. EPI, MB-SENSE and Spirals). Besides, these representative 3T results are very encouraging for adoption at 7T and beyond, where the effects of B0 inhomogeneity are much worse11.Conclusion
We have shown that it is possible to generate subject-specific B0 maps, which are accurate enough for shim computations providing homogeneous B0. We also show that the alternative approach using image co-registration yields comparable results, obviating the need for additional scans for pseudo-CT generation.Acknowledgements
No acknowledgement found.References
1. Koch, Kevin M., et al. "Rapid calculations of susceptibility-induced magnetostatic field perturbations for in vivo magnetic resonance." Physics in Medicine & Biology 51.24 (2006): 6381
2. Kochan, Martin, et al. "Simulated field maps: toward improved susceptibility artefact correction in interventional MRI." International Conference on Information Processing in Computer-Assisted Interventions. Springer, Cham, 2014.
3. https://www.accessdata.fda.gov/cdrh_docs/pdf19/K193109.pdf
4. Shizhe et. al. “Three-Dimensional Mapping of the Static Magnetic Field inside the Human Head.” Magnetic resonance in medicine 1996 Nov;36(5):705-14.
5. Neelavalli, Jaladhar, et al. "Removing background phase variations in susceptibility‐weighted imaging using a fast, forward‐field calculation." Journal of Magnetic Resonance Imaging: An Official Journal of the International Society for Magnetic Resonance in Medicine 29.4 (2009): 937-948
6. 43. Jenkinson, Mark, James L. Wilson, and Peter Jezzard. "Perturbation method for magnetic field calculations of nonconductive objects." Magnetic Resonance in Medicine: An Official Journal of the International Society for Magnetic Resonance in Medicine 52.3 (2004): 471-477.
7. Jordan, Caroline D., et al. "Subject‐specific models of susceptibility‐induced B0 field variations in breast MRI." Journal of Magnetic Resonance Imaging 37.1 (2013): 227-232.
8. Juchem C, Umesh Rudrapatna S, Nixon TW, de Graaf RA. Dynamic multi-coil technique (DYNAMITE) shimming for echo-planar imaging of the human brain at 7 Tesla. Neuroimage. 2015 Jan 15;105:462-72. doi: 10.1016/j.neuroimage.2014.11.011. Epub 2014 Nov 8. PMID: 25462795; PMCID: PMC4262558.
9. Buch, S., Liu, S., Ye, Y., Cheng, Y. C. N., Neelavalli, J., & Haacke, E. M. (2015). Susceptibility mapping of air, bone, and calcium in the head. Magnetic resonance in medicine, 73(6), 2185-2194.
11. Ladd, Mark & Bachert, Peter & Meyerspeer, Martin & Moser, Ewald & Nagel, Armin & Norris, David & Schmitter, Sebastian & Speck, Oliver & Straub, Sina & Zaiss, Moritz. (2018). Pros and cons of ultra-high-field MRI/MRS for human application. Progress in Nuclear Magnetic Resonance Spectroscopy. 109. 10.1016/j.pnmrs.2018.06.001.
Figures
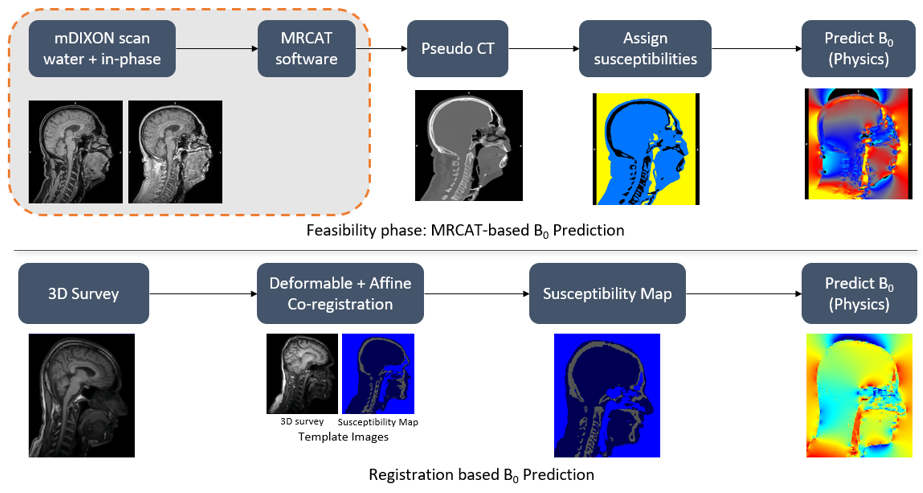
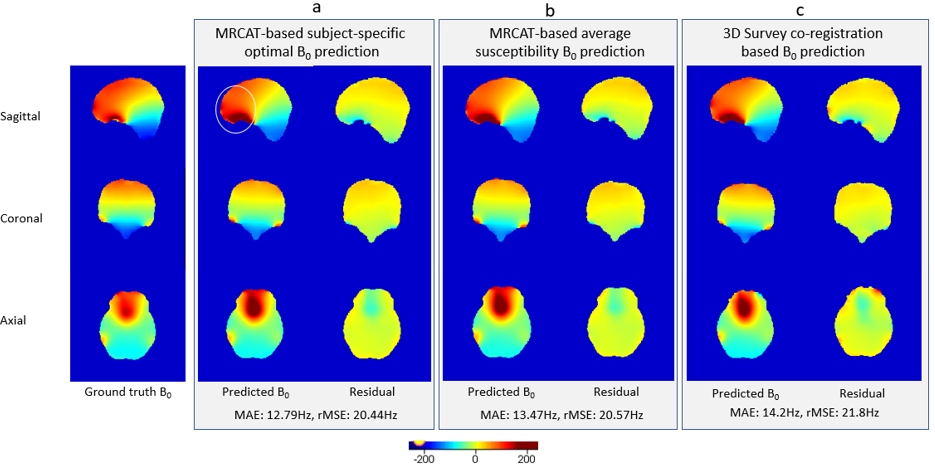
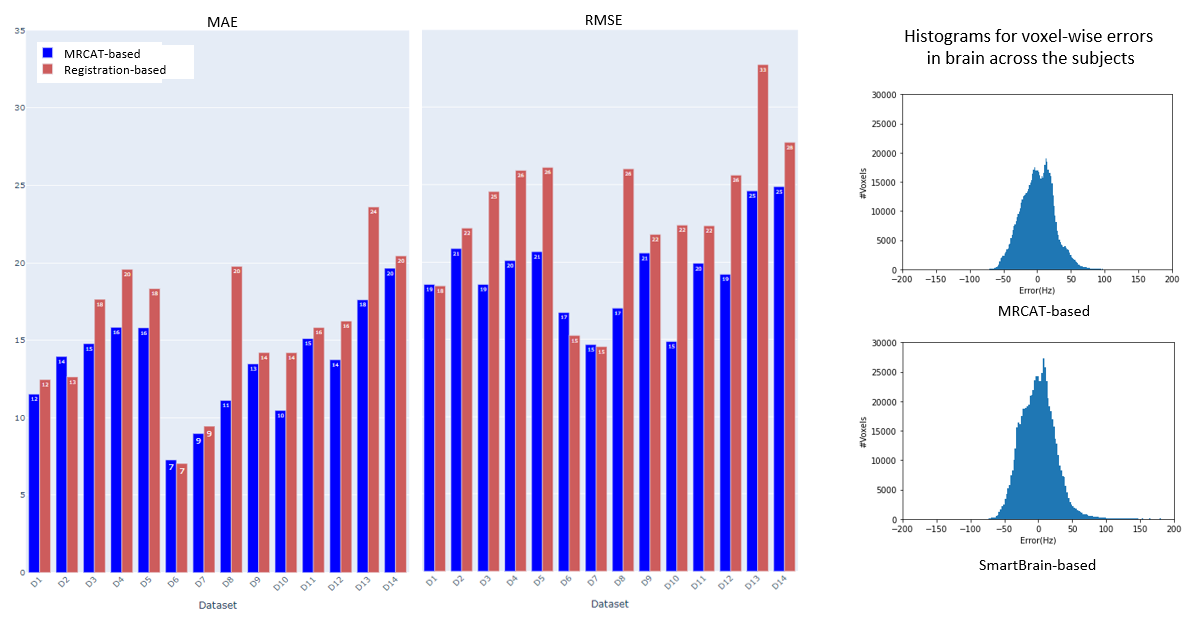
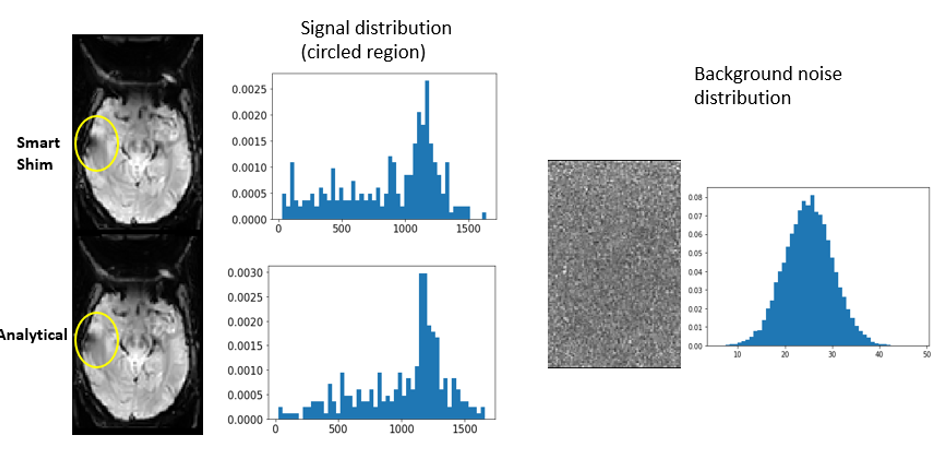
Figure 4. Echo Planar Imaging (EPI) scans obtained with shim currents computed by scanner and offline analytical computation (co-registration approach): The reconstructed image using analytical computation without acquiring the B0 map outperforms the results based on scanner-inbuilt shimming in terms of signal quality. The SNR computed in the yellow-circled ROI is 183 for image-based shimming (SS), whereas, analytical approach has improved it to 201. The background noise distributions for both the acquisitions were nearly the same.
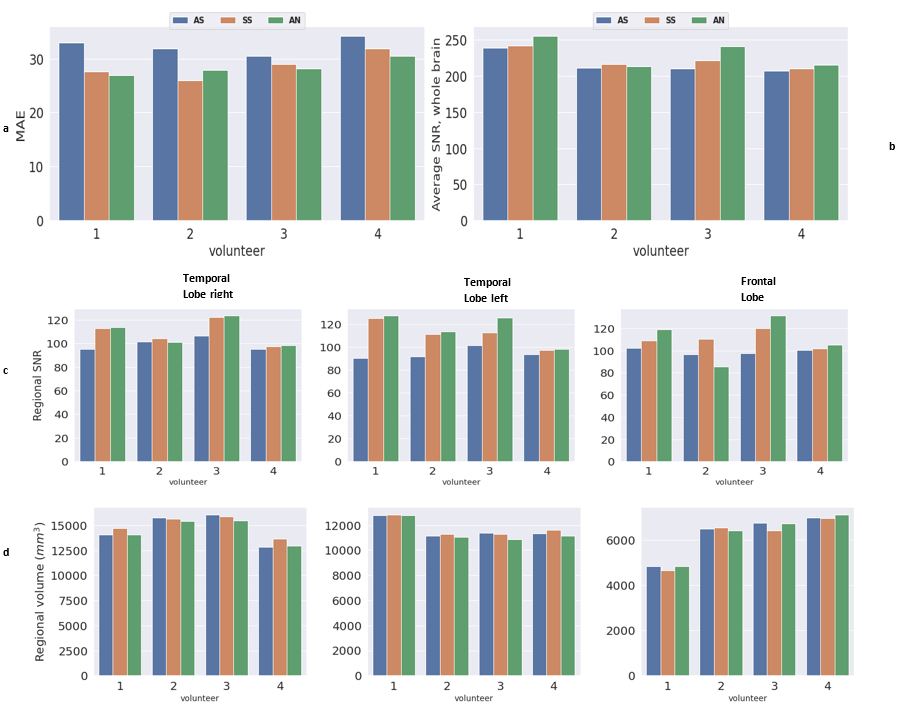
Figure 5: Subplots for four different samples (a) Mean Absolute Error for B0 maps from scanner computed linear shims (AS) , scanner computed second order shim (SS), analytical predictions respectively. (b) Bar plots of average SNR computed for the whole brain. (c)SNR computed for specific regions across three samples: Temporal Lobe right, Temporal Lobe left, Frontal Lobe (d) barplot for corresponding volumes of the regions in (c). Acquisition parameters: EPI (TR: 3 s, TE: 35 ms, 1.797x1.797x4 mm3)