3869
Intravoxel incoherent motion imaging of a small-vessel MRI phantom: Preliminary study.1Department of Medical Physics, Tohoku University, Graduate school of medicine, Sendai, Japan, 2Department of Advanced MRI Collaborative Research, Tohoku University, Graduate school of medicine, Sendai, Japan, 3Department of Radiology, Tohoku University hospital, Sendai, Japan, 4Institute of Fluid Science, Tohoku University, Sendai, Japan
Synopsis
IVIM signal intensities could be compared with the ‘ground truth’ by use of a micro-vessel phantom in this study. In IVIM imaging, images with b = 0 are often included in the analysis, but this study indicated that images with b = 0 should be excluded. In this study, IVIM analysis showed a tendency to overestimate D* and underestimate f.
Introduction
Intravoxel incoherent motion (IVIM) imaging has been expected to provide information on tissue microcirculation non-invasively.1 However, due to the poor signal to noise ratio of the tissue perfusion component, it is difficult to extract the information of tissue microcirculation. Although various imaging and signal analysis methods have been proposed, no method has yet been found that can be considered optimal or standard. One of the reasons for this includes difficulty to compare with the ground truth of biological signals.A recent study introduced a polydimethylsiloxane (PDMS)-based microfluidic small-vessel phantom simulating in-vivo flow in small vessels and validate the quantitative measurement by diffusion weighted imaging (DWI) with numerical computation2.
The purpose of this phantom study was to evaluate whether it is possible to compare IVIM parameters obtained by currently accepted imaging and signal analysis methods with the theoretical true values.
Materials and methods
The details about phantom was described previously1, in short, an unicursally connected curved channel (200 µm in width and 400 µm in depth) consisted of 5 layers was designed (Fig. 1) and fabricated from PDMS by means of photolithography and soft lithography.3MRI acquisition and image analysis: A clinical 3-Tesla MRI system (Ingenia CX, Philips, Best) with a dStream Head Spine coil was used. The phantom was placed in PVA gel. The room temperature was 24.5 °C. Acquisition parameters of IVIM imaging were as follows: motion probing gradient (MPG: δ/Δ = 12.4/29.8 ms, b = 0, 10, 20, 30, 50, 100, 200, 300, 400, 500, 600, 800, 1000 s/mm2) in orthogonal three directions (one of the directions was perpendicular to the channel layer and another direction was parallel to the channel), TR/TE, 3000/62 ms; the number of slice, 1; slice thickness, 10 mm: 8 mm including the whole channel plus 2mm PVA layer out of the phantom (Fig. 2); field of volume (FOV), 320 mm; acquisition matrix: 64 x 62. The channel of the phantom was filled with tap water before the acquisition. A cup of tap water was placed in the FOV. During acquisition, tap water was infused at the rate of 0, 0.3, 0.4, 0.5 ml/hour by MRI IV Infusion pump (Inradimed, Winter Springs, FL). Three regions of interest (ROI) were placed on the acquired images [ROI-1 including the channel, ROI-2 in the phantom outside of the channel and ROI-3 in the cup of tap water] to measure the signal intensities (Fig. 3). Signal intensities for the ROI-1 were fitted to an IVIM model:
m0 (exp[-b D]+f exp[-b D*]),
using a non-linear least-squares method; where D is a diffusion coefficient of the PVA gel, f is a signal fraction from the flowing water in micro vessel, and D* is an apparent diffusion coefficient of the water in the vessel.
Results
Signal intensities on the ROI’s with b = 0 were lower than those with b = 10 s/mm2 (Fig. 4). Therefore, the data with b = 0 were excluded from the analysis. Diffusion coefficients were estimated as 0.00176 mm2/s for ROI-2 (PVA gel) and 0.00219 mm2/s for ROI-3 (tap water) as shown in Fig. 4. From the data of ROI-1 (shown in Fig 5), D and D* for the infusion rate of 0.3 and 0.4 ml/hour were estimated as shown in Table 1. The subtracted signal intensity (ROI-1 – ROI-2, Fig. 6) would be those signals from the water in the micro vessel. Table 2 shows D* estimated from the subtracted intensity.Table 1 Estimated parameters for ROI-1. ± indicates confidence interval
| Infusion rate | 0.3 ml/hour | 0.4 ml/hour |
| D | 0.00176± .00011 mm2/s | 0.00177± .00004 mm2/s |
| D* | 0.0136± .0101 mm2/s | .0371± .0128 mm2/s |
| f | 0.123± .058 | 0.141± .024 |
Table 2 Estimated D* for subtracted intensity (ROI-1 – ROI-2). ± indicates confidence interval
| Infusion rate | 0.3 ml/hour | 0.4 ml/hour |
| D* | 0.0086± .0019 mm2/s | 0.0107± .0035 mm2/s |
Estimated D*’s from the ROI-1 signal were larger than those obtained from subtracted intensity (ROI-1 – ROI-2). Estimated f’s were smaller than the value expected from the phantom configuration (0.2).
Discussion
IVIM signal intensities could be compared with the ‘ground truth’ by use of a micro-vessel phantom. In IVIM imaging, images with b = 0 are often included in the analysis, but this study indicated that images with b = 0 should be excluded. In this study, IVIM analysis showed a tendency to overestimate D* and underestimate f. Further studies will be desired to examine these issues to optimize the imaging and analysis method in the future.Conclusion
IVIM signal intensities could be compared with the ‘ground truth’ by use of a micro-vessel phantom in this study. Optimizaton of the imaging method and validation of estimated parameters in IVIM imaging may be achieved with the micro-vessel phantom.Acknowledgements
No acknowledgement found.References
1. Iima M. Perfusion-driven Intravoxel Incoherent Motion (IVIM) MRI in Oncology: Applications, Challenges, and Future Trends. Magn Reson Med Sci 2020:rev.2019-0124 doi: 10.2463/mrms.rev.2019-0124.
2. Tamura H, Ota H, Nagasaka T, Mori R, Kato C, Gonda K, and Funamoto K. A small-vessel MRI phantom for quantitative analysis of diffusion-weighted images: a validation study with numerical computation .Proceedings of 2021 Annual Meeting of ISMRM, 2095.
3. Koens R, Tabata Y, Serrano JC, et al. Microfluidic platform for three-dimensional cell culture under spatiotemporal heterogeneity of oxygen tension. APL Bioengineering. 2020;4(1):016106. doi:10.1063/1.5127069.Figures
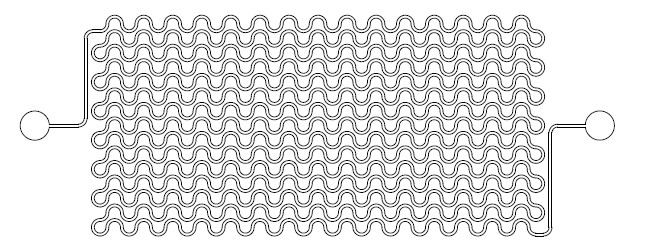
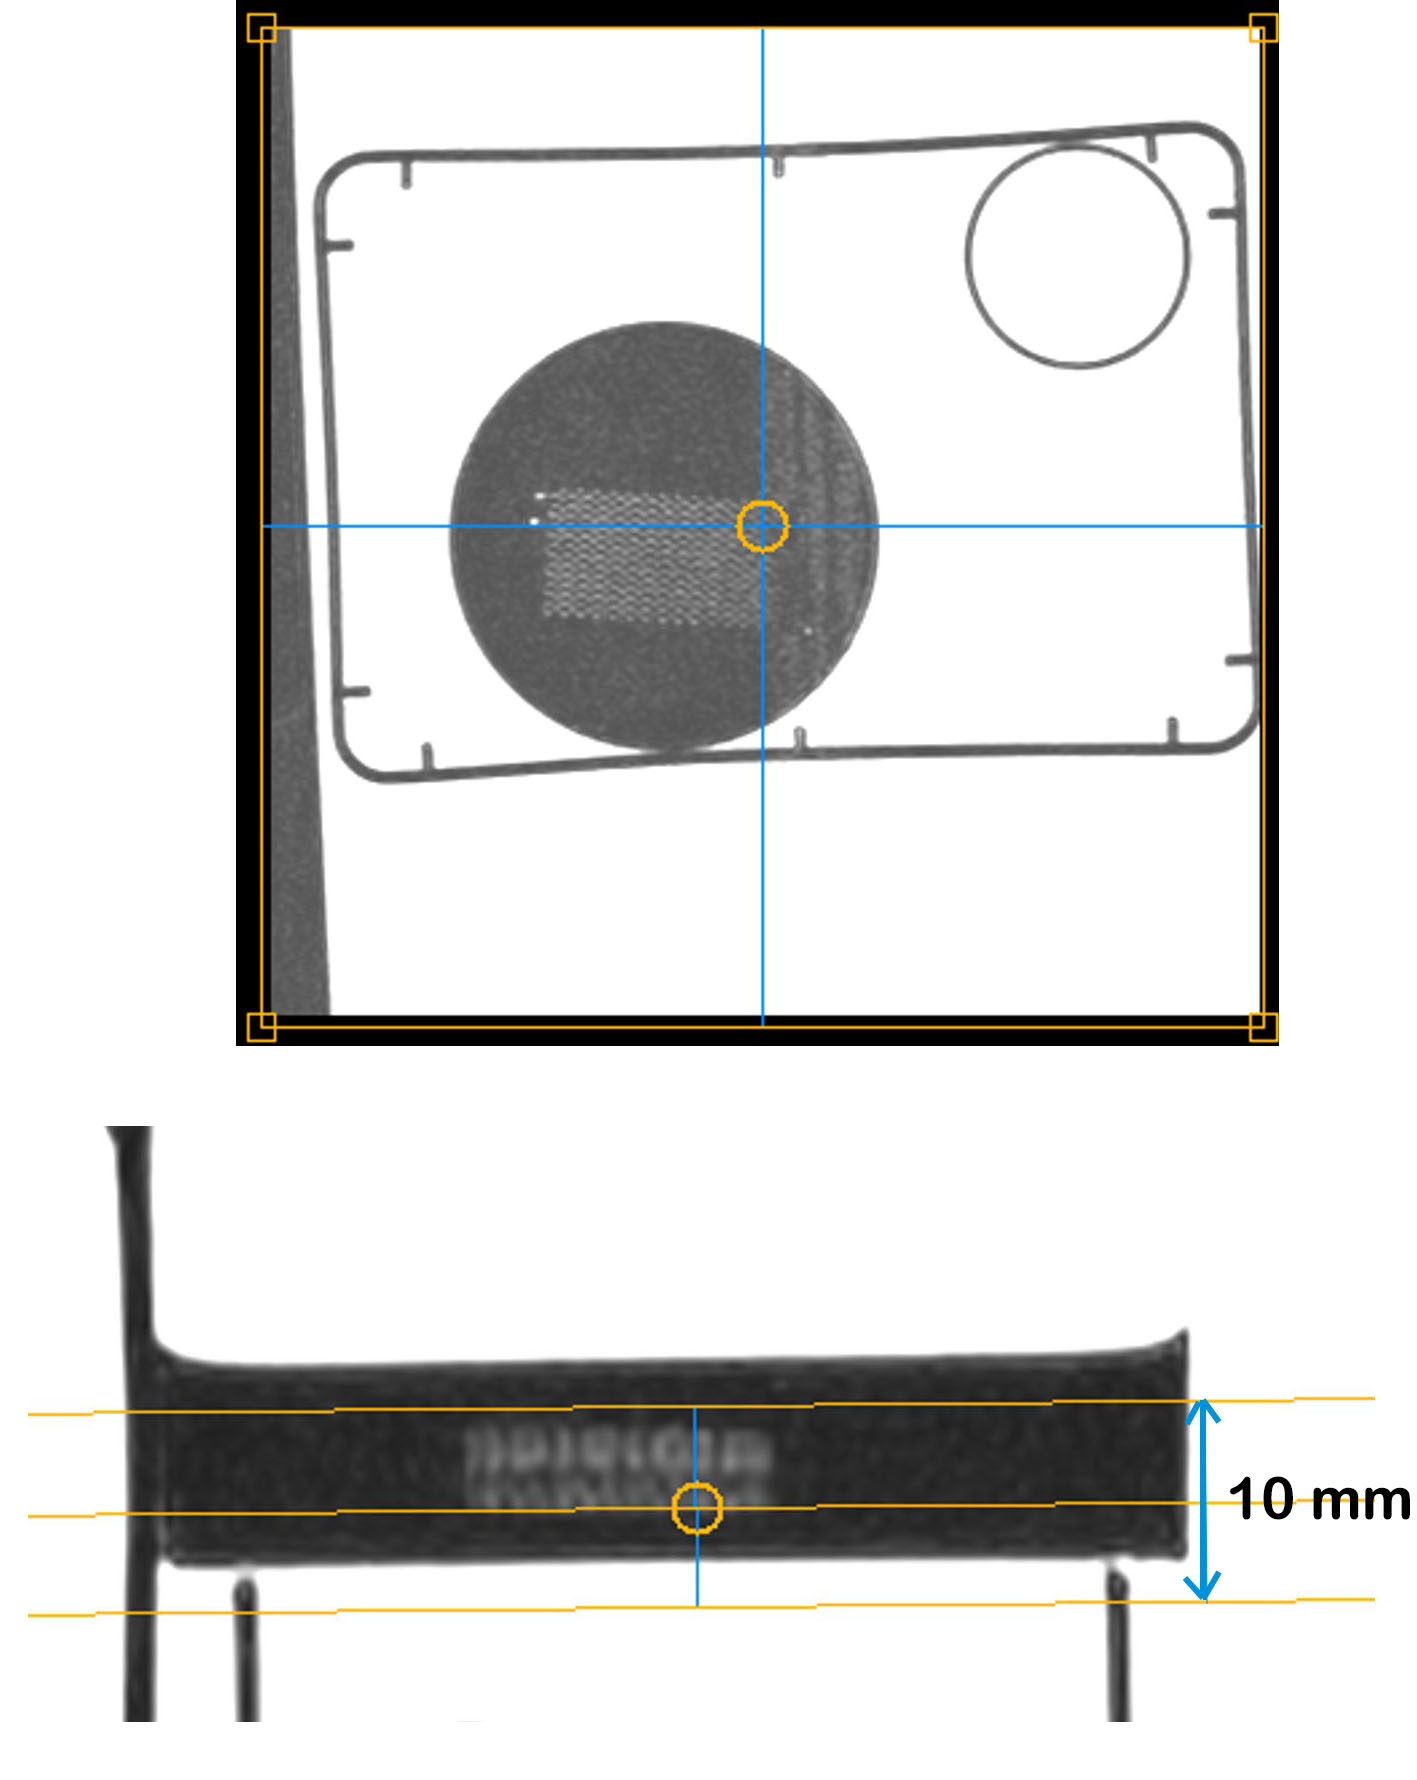
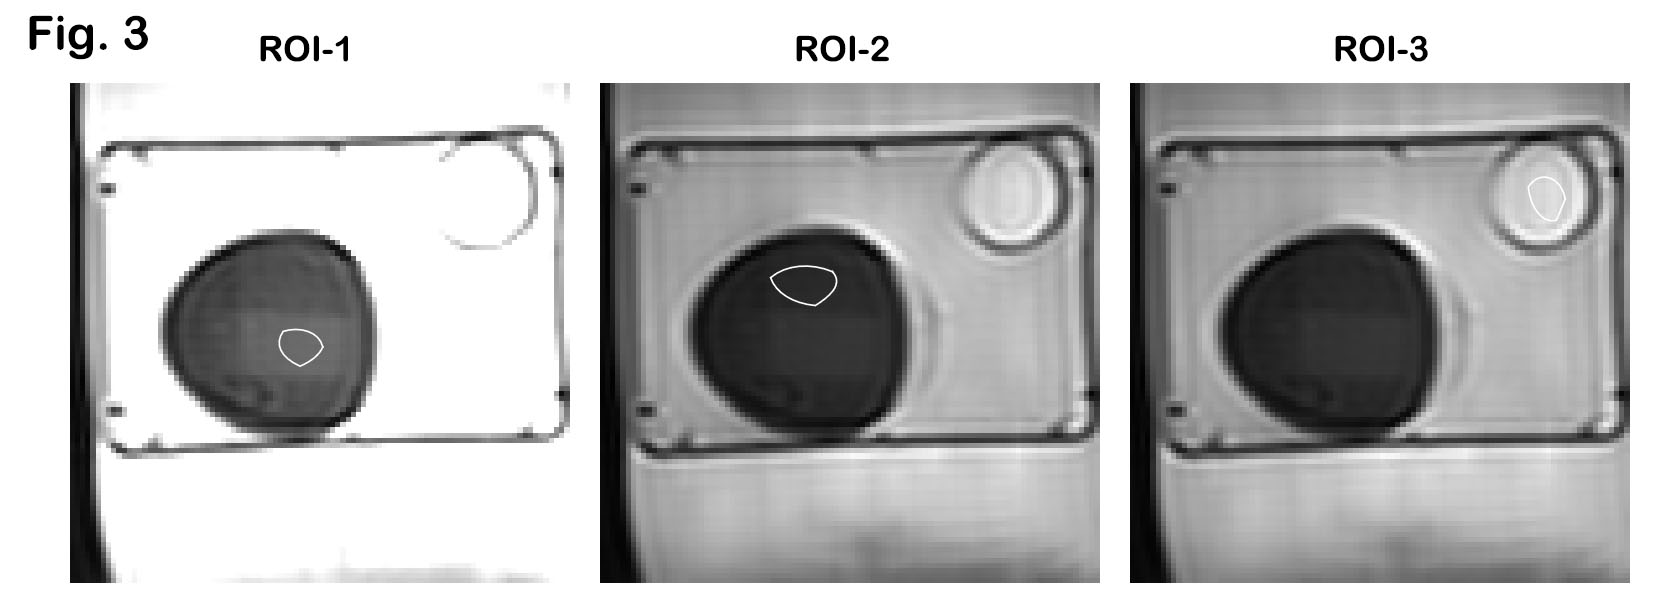
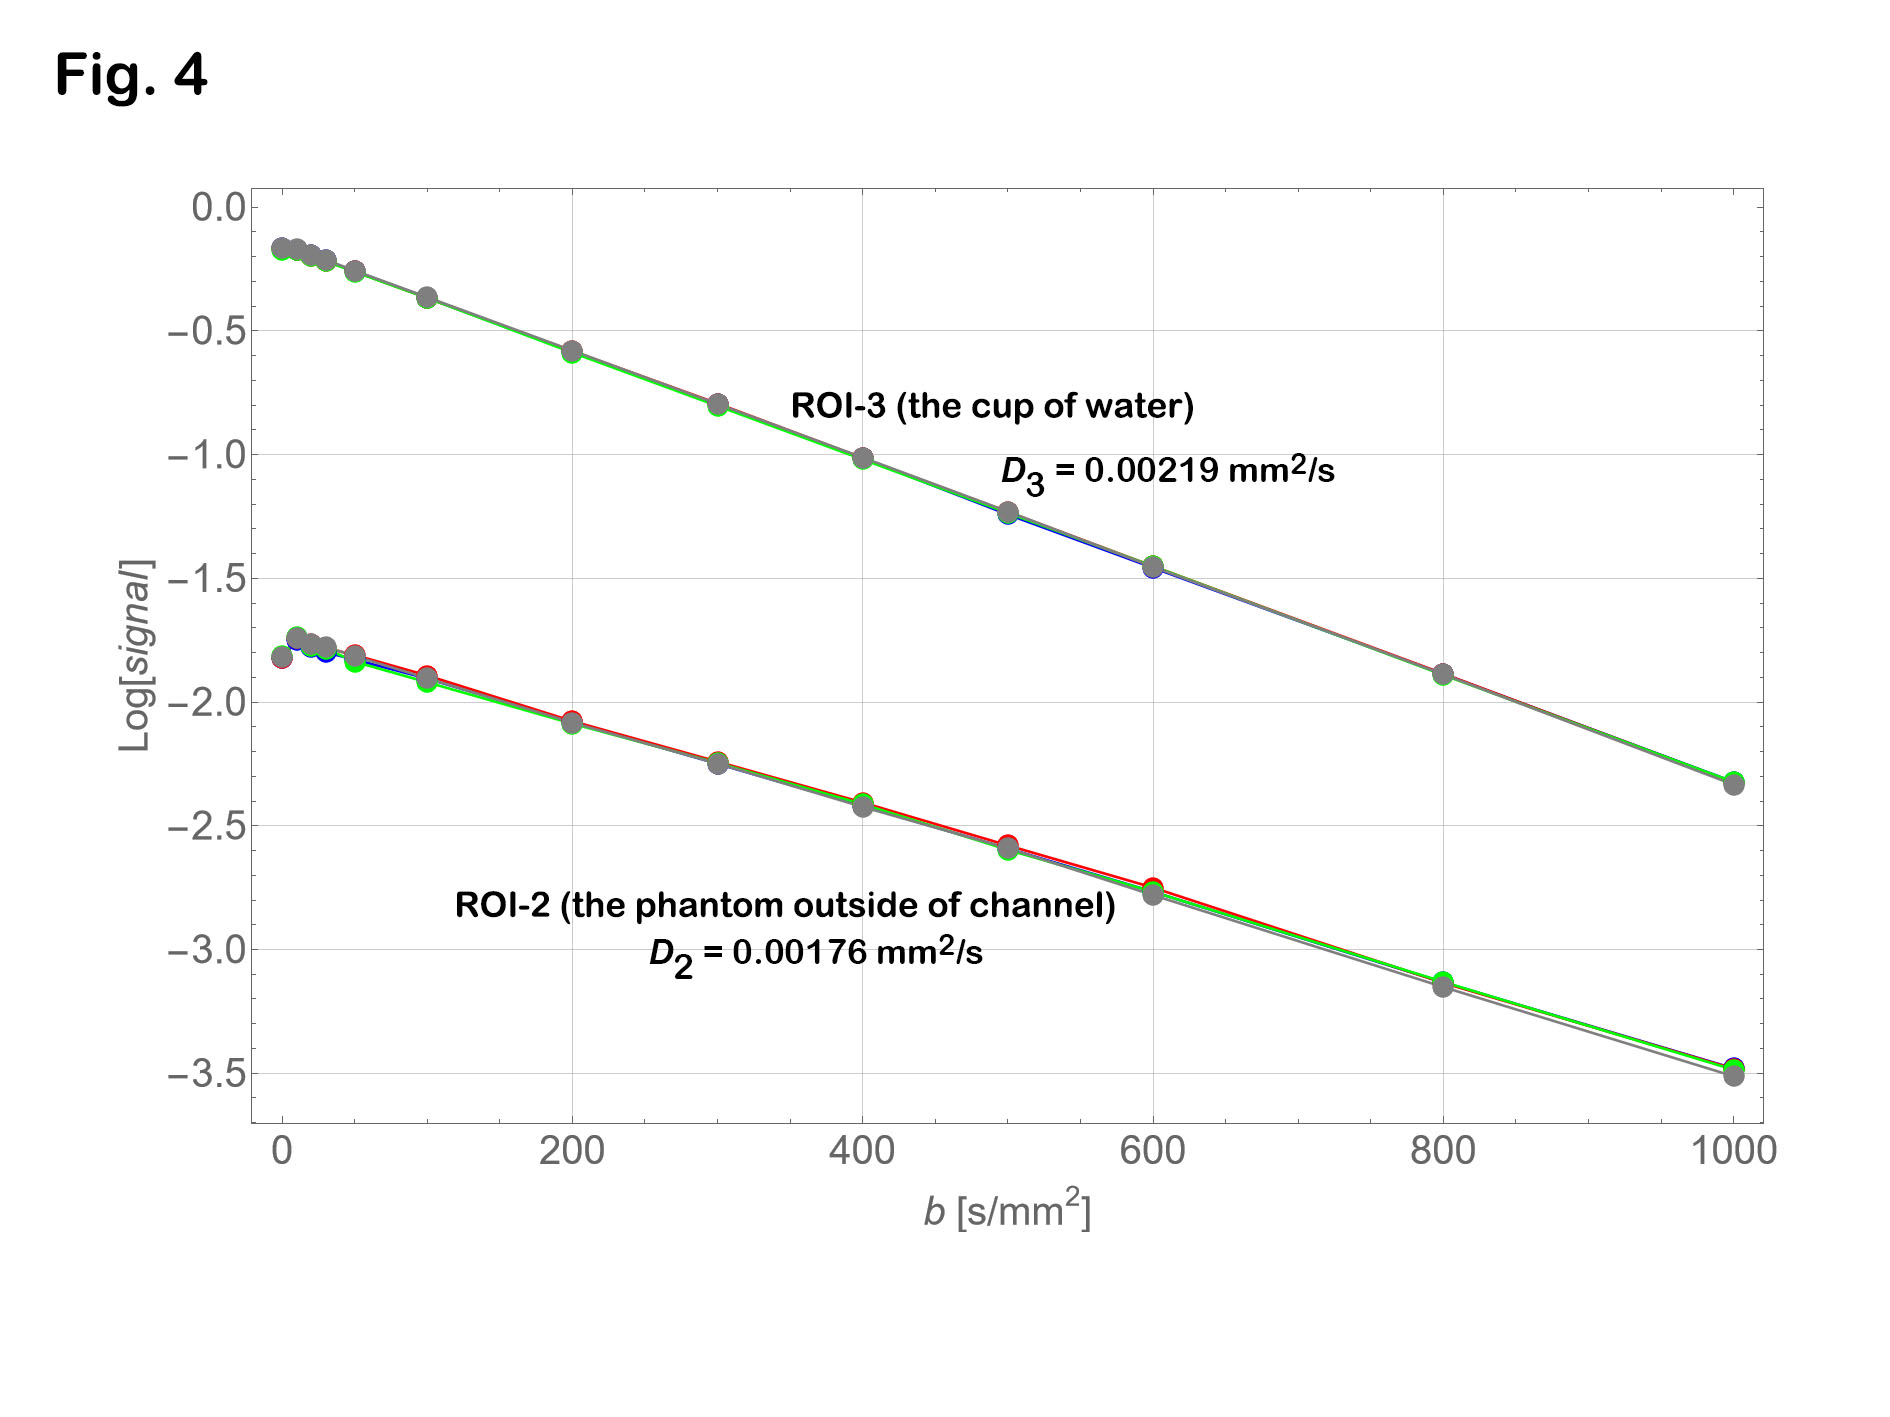
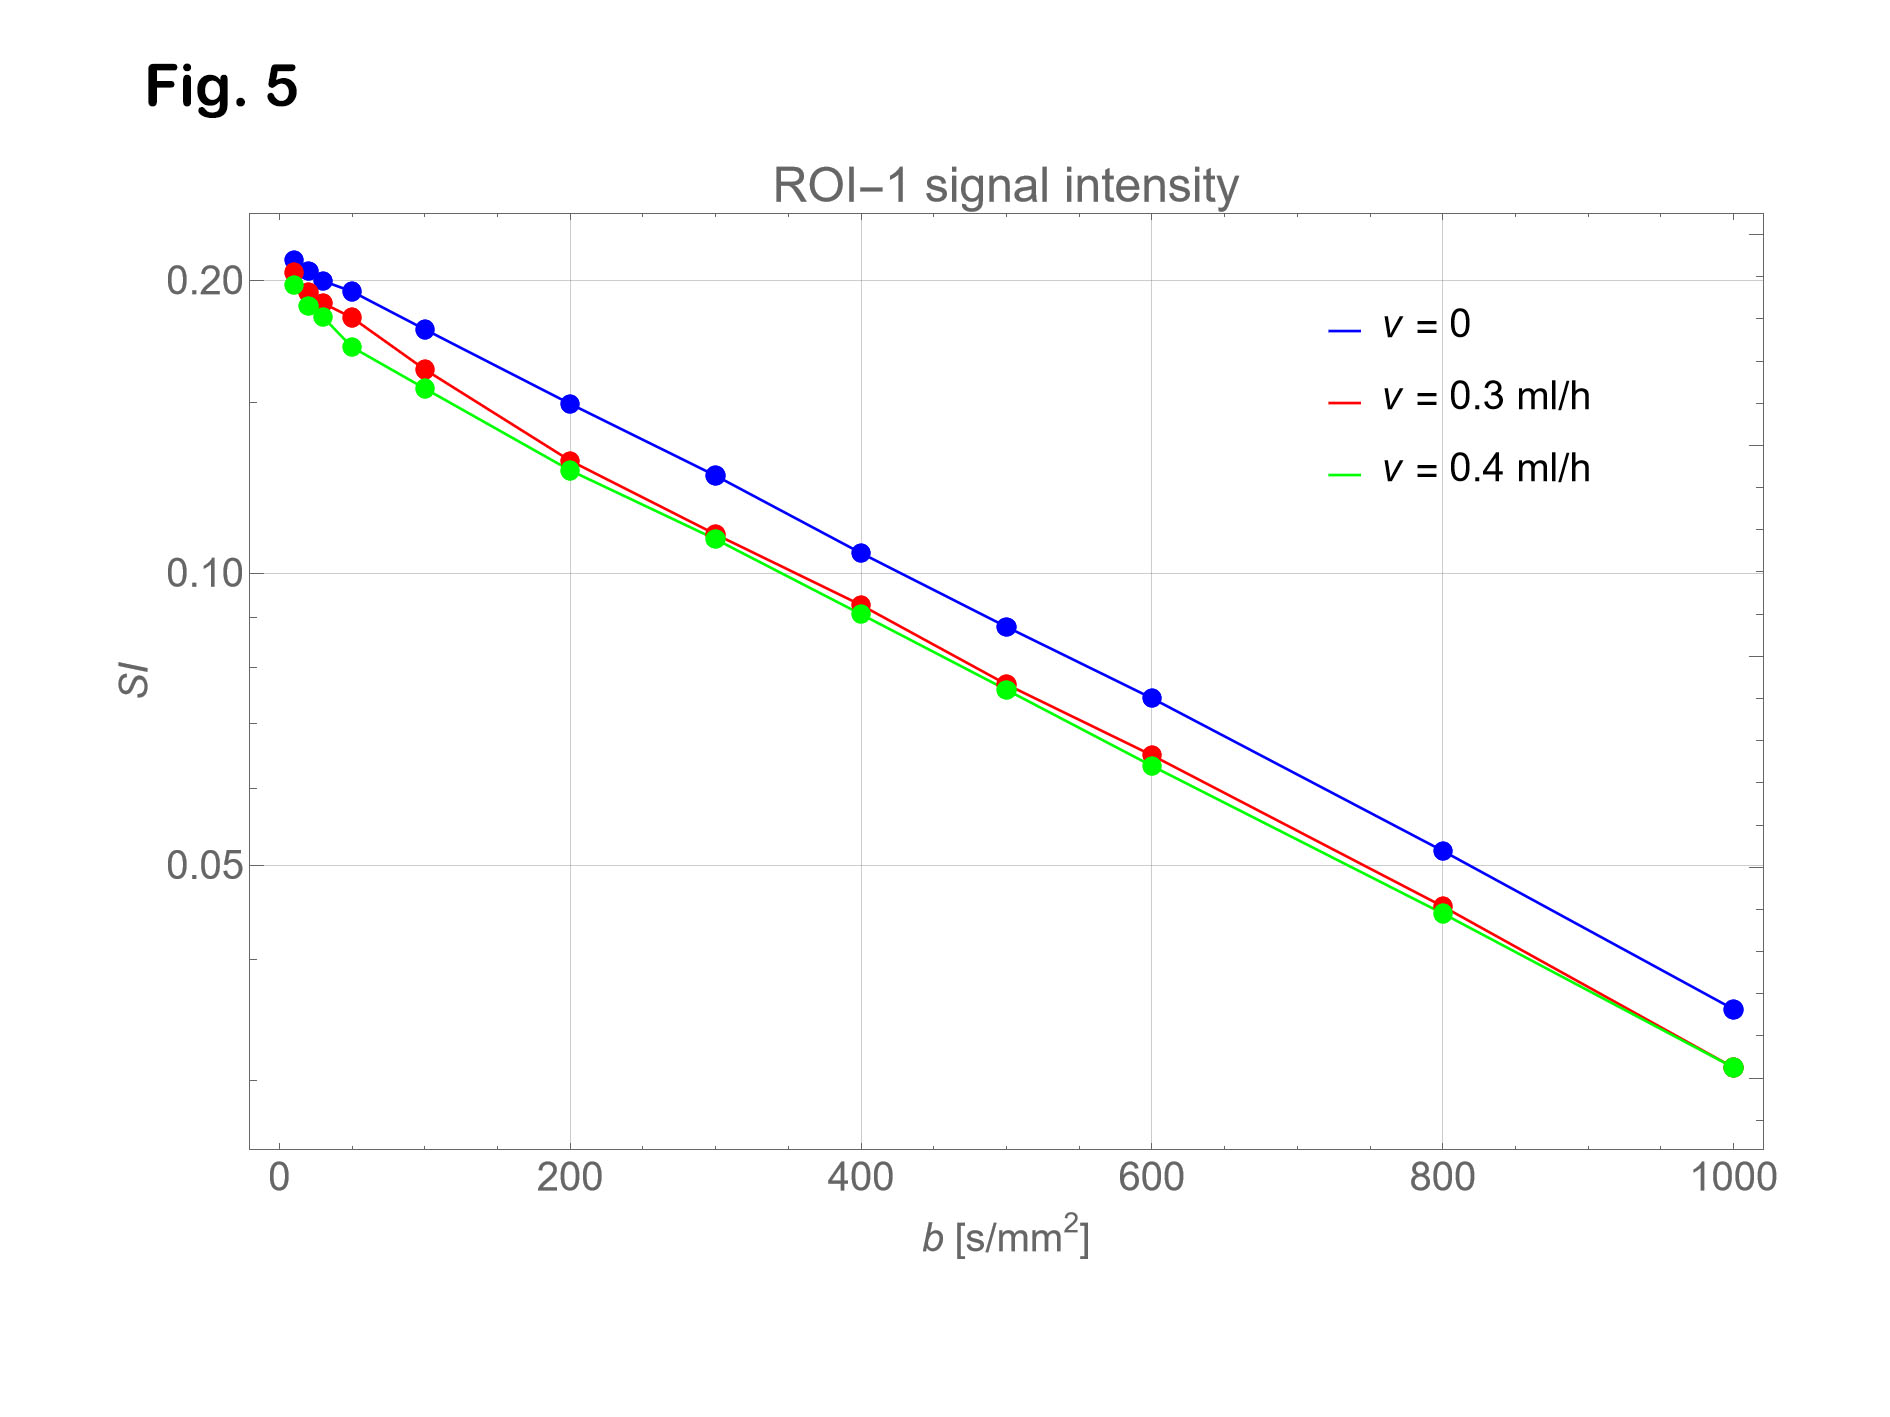
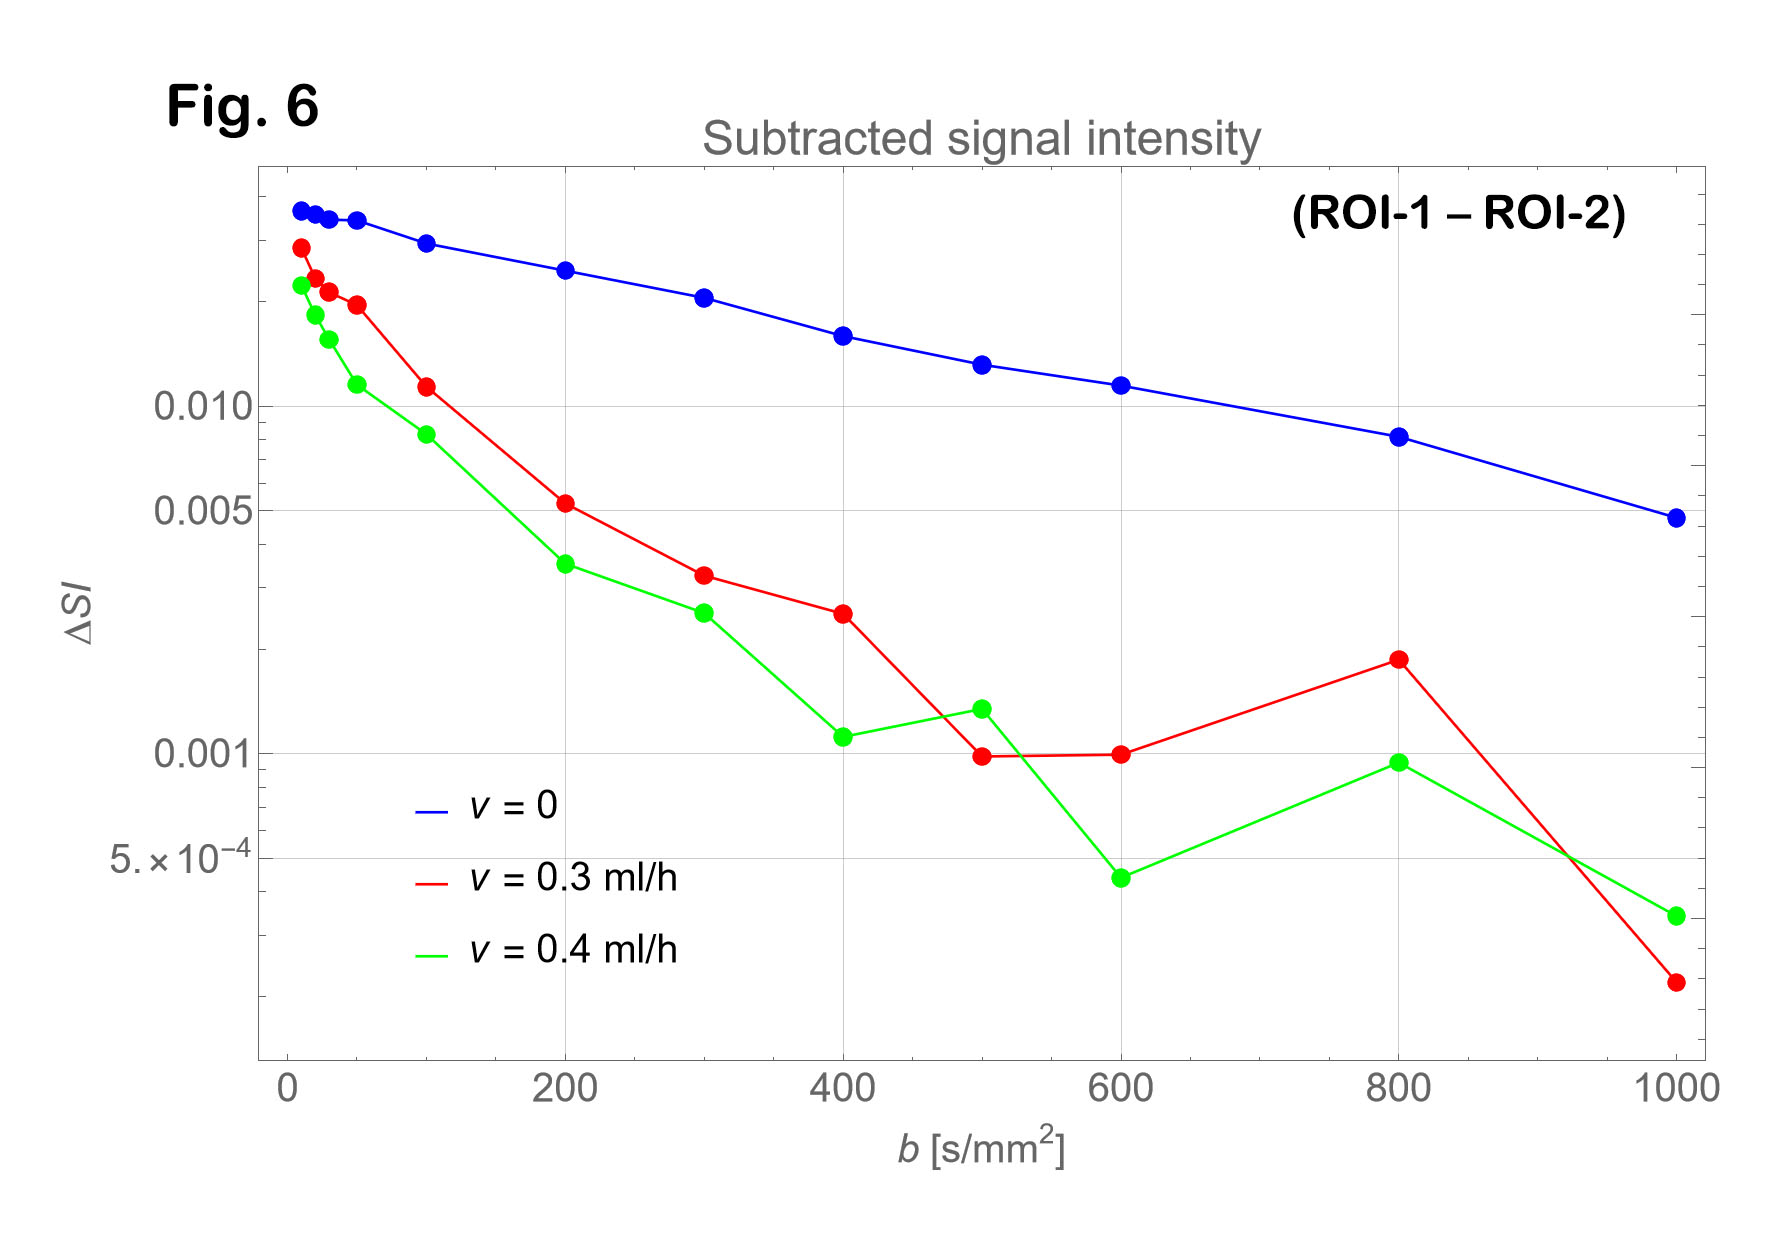
Fig. 6: Subtracted signal intensity (ROI-1 – ROI-2) corresponding to the water signal intensity in the vessel.