3863
An Innovative MRI phantom Allowing Evaluation of the Influence of Fat Fraction on the Measurement of ADC under Different Glass Bead Densities1Department of Biomedical Engineering and Environmental Sciences, National Tsing Hua University, Hsinchu, Taiwan, 2Department of Medical Imaging, China Medical University Hsinchu Hospital, Hsinchu, Taiwan, 3Department of Radiology, School of Medicine, China Medical University, Taichung, Taiwan, 4Department of Automatic Control Engineering, Feng Chia University, Taichung, Taiwan, 5Institute of Cancer Biology, China Medical University, Taichung, Taiwan, 6Department of Biomedical Engineering, Chinese University of Hong Kong, Sha Tin, Hong Kong, 7Institute of Nuclear Engineering and Science, National Tsing Hua University, Hsinchu, Taiwan
Synopsis
Although a single-function phantom for either ADC or fat content is popular, it is crucial to develop a multiple-function phantom to simulate the real situation of human tissue in vivo. The aim of our study was to design a novel phantom containing different fat fractions and cellularity to evaluate the effect of fat content on ADC measurement in vivo as in human tissue environment. In conclusion, the influence of fat contents and glass beads density on ADC values was examined in our dual-function phantom, which can be helpful to improve the accuracy of ADC quantification in clinical practice.
Introduction
By measuring tissue characteristics in addition to anatomic information, MRI has provided some imaging biomarkers1 quantifying brain volume2, tumor volume3, functional network connectivity4, fat fraction5 and diffusion of tissue water6. Diffusion-weighted imaging (DWI) can measure proton diffusion information (i.e., apparent diffusion coefficient, ADC)6, while IDEAL IQ sequence allows us to measure the fat fraction of tissue7. In order to increase the reliability and comparability of data gathered from MR biomarkers, standardization of imaging protocols and calibration of measures using MR phantoms are necessary to validate the accuracy of these measures in vivo8. For example, diffusion phantom and water-fat phantom have been designed for measuring ADC9 and fat fraction10, respectively. Clinically, the ADC measurement in fatty tissue, such as breast11 and parotid gland12, has been shown to be influenced by the fat content. Although a single-function phantom for either ADC or fat content is popular, it is crucial to develop a multiple-function phantom to simulate the real situation of human tissue in vivo. The aim of our study was to design a novel phantom containing different fat fractions and cellularity to evaluate the effect of fat content on ADC measurement in vivo as in human tissue environment.Materials and Methods
Phantom design: An ensemble of phantoms consisting of six different fat fractions (FF, 0%, 10%, 20%, 30%, 40%, and 50%) and five different glass bead densities (GBD, 0, 0.1, 0.25, 0.5 and 1.0 g/50cc.) was created using mixtures of soybean oil, glass particles (#K37,3M microspheres, Easy Composites Ltd.)9, and water together with an emulsifying agent (Trion X-100)13 and a coagulant (agarose)14. MRI scans: All images were performed by a 1.5 Tesla MR scanner (GE Signa MR450w, GE Healthcare). IDEAL IQ sequence was applied to quantify the fat fraction of phantom8. The IDEAL IQ method was a three-dimensional fast spoiled gradient-echo (3D-FSPGR) sequence employing a six-echo acquisition (1.1ms-6.38ms) with imaging parameters including TR of 19.6ms, FOV of 210×210 mm2, matrix size of 128×128, bandwidth of 90.91 kHz, flip angle of 5, and slice thickness of 10mm. DWI was performed using single-shot echo planar imaging with water excitation and the scanning parameters of TR of 4000 ms, TE of 78.1 ms, b values of 0 and 1000 $$$s/mm^{2}$$$, FOV of 210×210 mm2, slice thickness of 10 mm, matrix size of 128×128, and bandwidth of 250 kHz. Data processing: Proton density fat fraction (PDFF) maps were automatically produced by the MRI scanner. ADC maps were generated via pixel-by-pixel computation from b0 and b1000 images based on the Stejskal–Tanner relationship:$$$ADC=ln[S_{b=1000}/S_{b=0}]/(-b)$$$. A slice containing the largest cross-sectional area of the phantom was chosen for ROI selection to circle whole tube in every DWI and IDEAL IQ scans. Then the values of mean and standard deviations (SD) were calculated for analysis. Linear regression analysis was used to evaluate the relationship among the fat, GBD, and ADC measures.Result
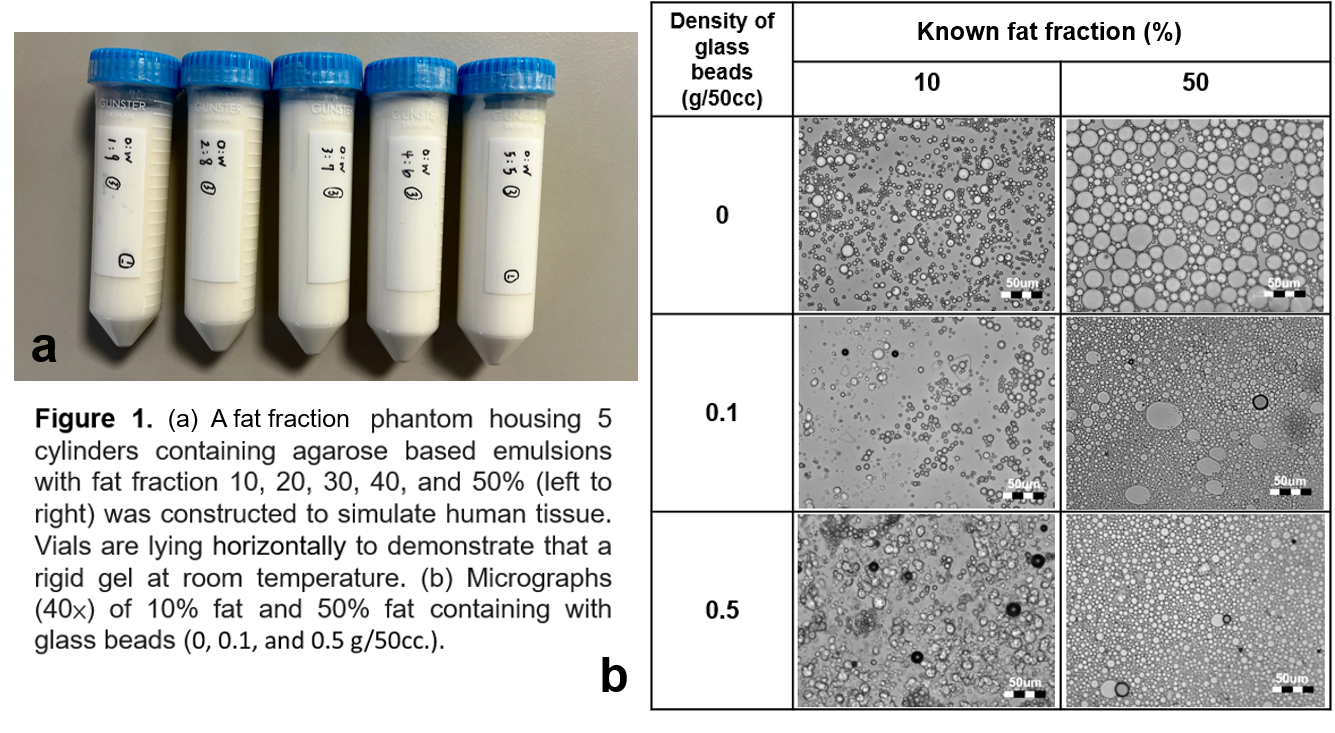
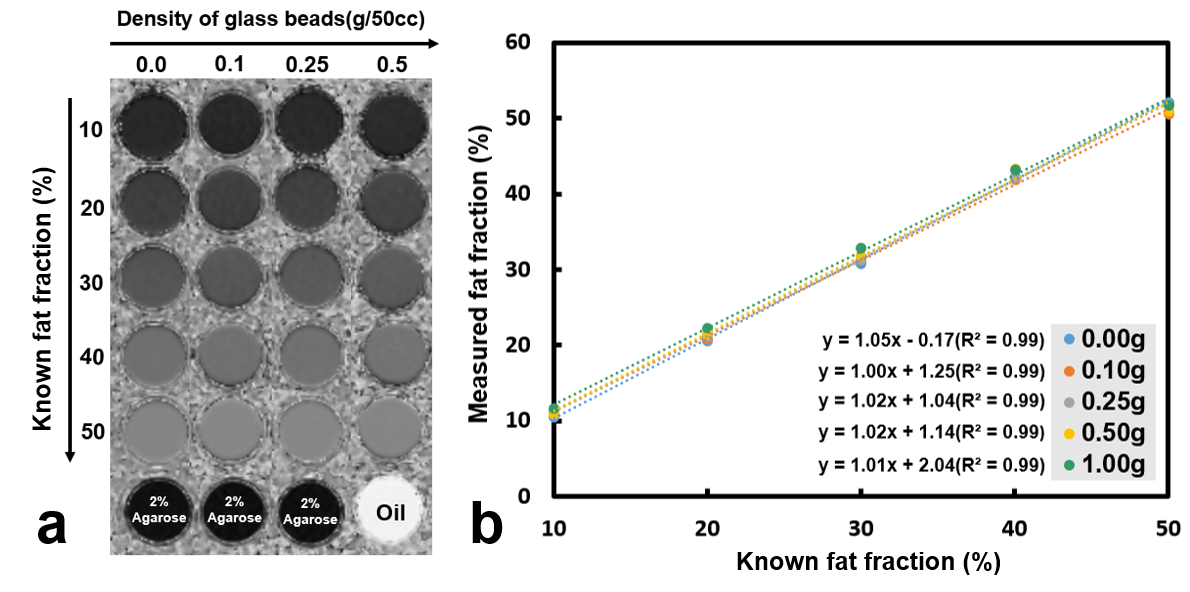
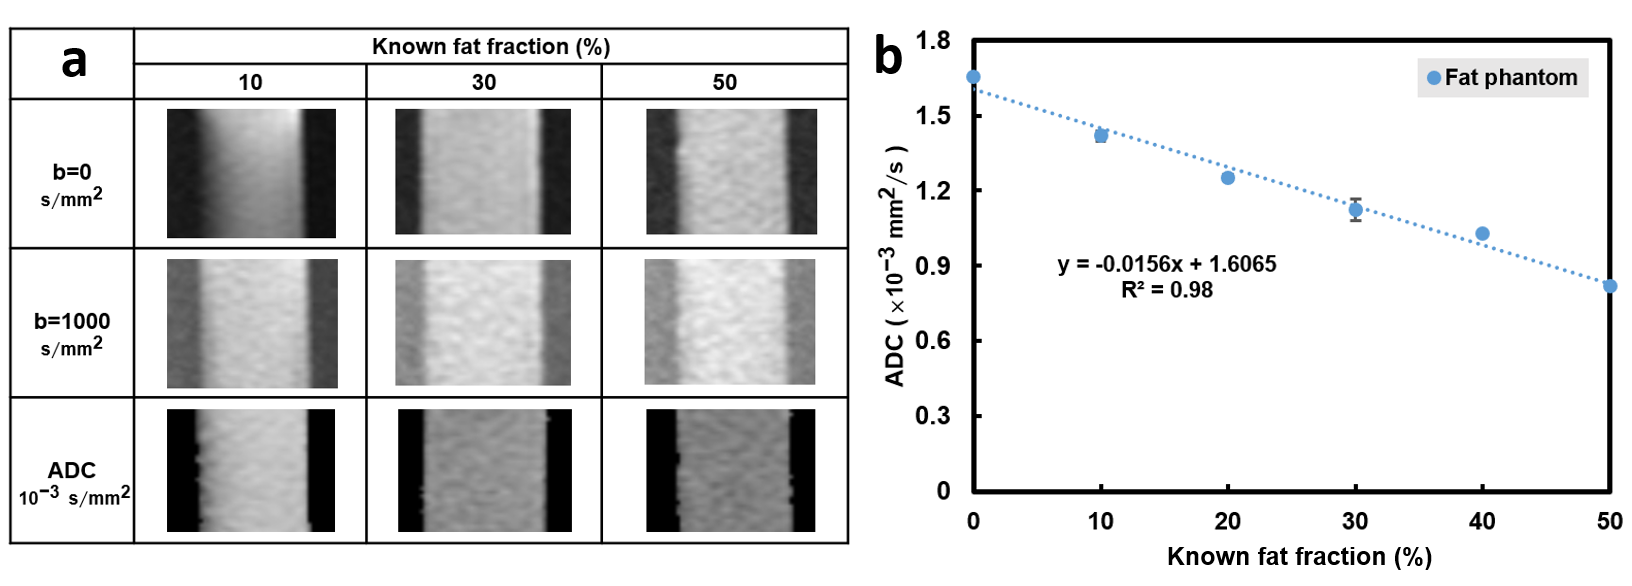
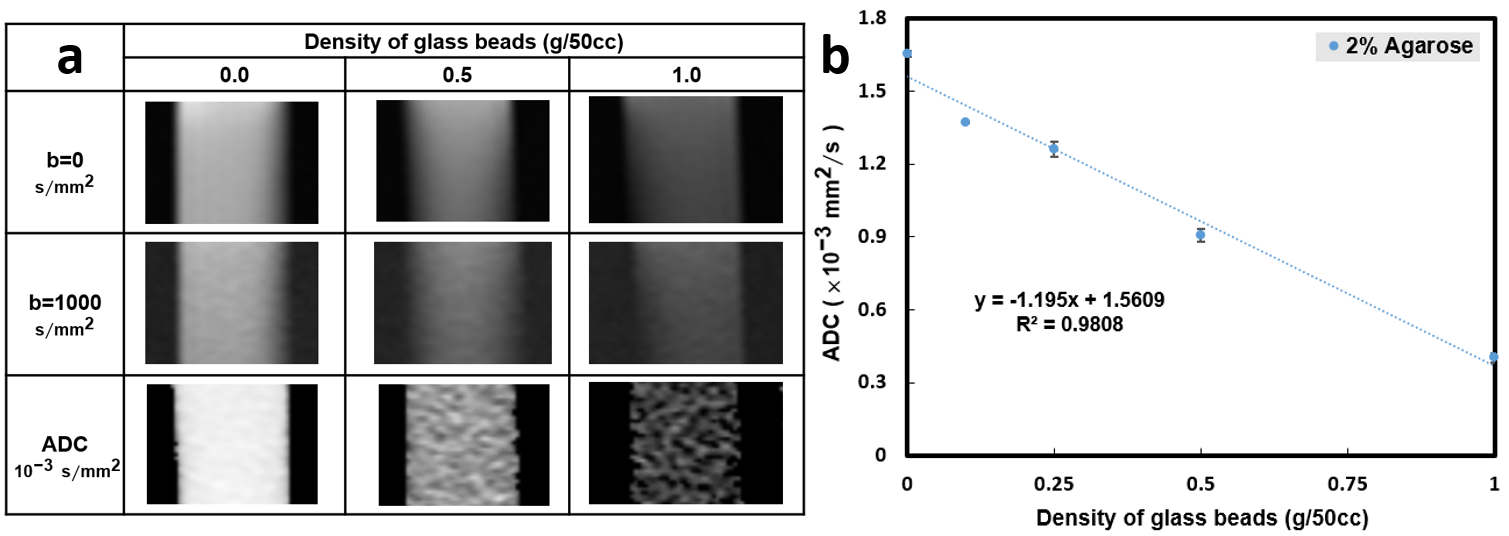
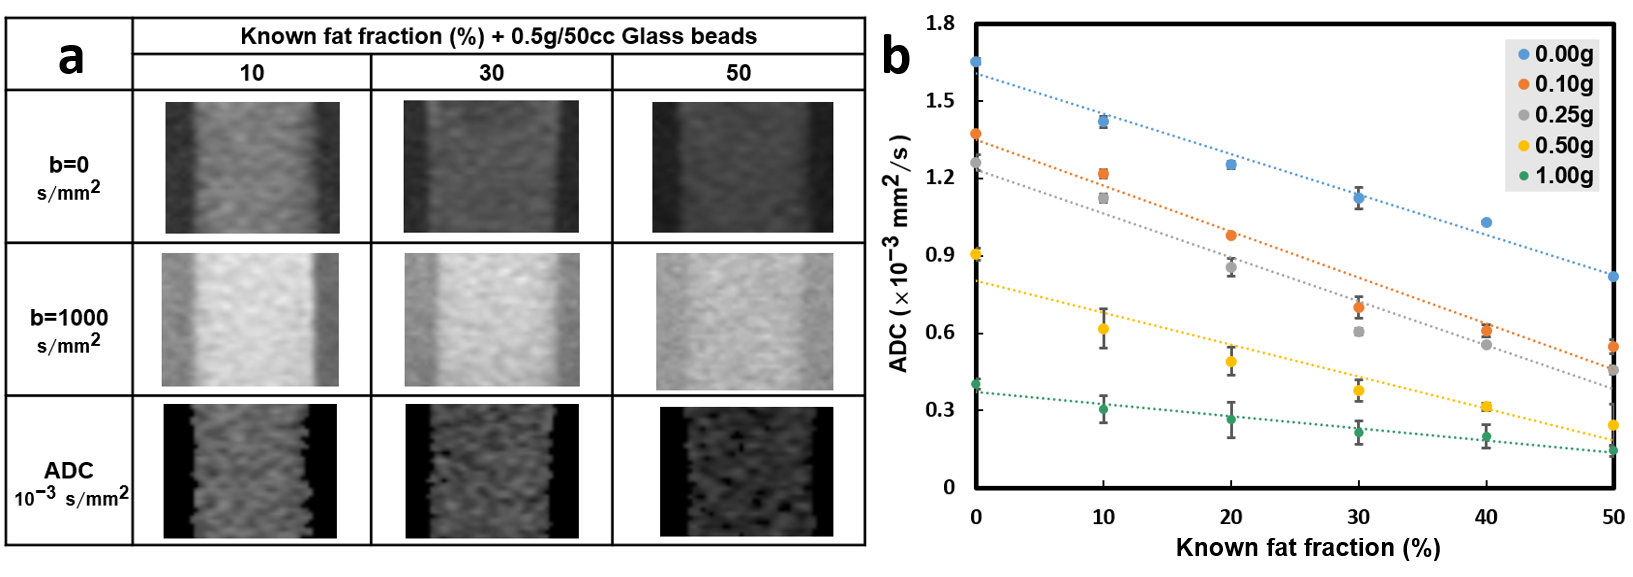
Five cylinders containing solidified agarose-based emulsions with FF of 10%, 20%, 30%, 40%, and 50% from left to right, respectively, were demonstrated (Fig.1a). Microscopic images of 10% (right column) and 50% (left column) FF tubes with GBD of 0 (upper row), 0.1 g/50cc (middle row), and 0.5 g/50cc (lower row) were illustrated (Fig. 1b), showing the distribution and arrangement of fat droplets, glass beads, and water in the emulsion. Scatter plots show high linearity (slope 1~1.05) and small bias (-0.17%~2.04%) of FF between PDFF maps and phantoms at different GBDs (Fig. 2). Fig. 3 displays the relationship between ADC and FF without glass beads (GBD=0). Fig. 4 displays the relationship between ADC and GBD without fat content (FF=0). Fig. 5 displays the relationship between ADCs and FF at different GBDs.Discussion and Conclusion
In this study, an innovative, dual-function phantom was designed for the quantitative measurement of ADC and fat fraction. Results showed the high accuracy of fat fraction in our phantom (Fig. 2) irrelevant to glass particles. In the diffusion phantom, the ADC decreased as the density of glass beads increased because of the reduction in diffusion space of proton, which is similar to a previous study9. However, our results that ADC in phantom with GBD of 0 is negatively proportional to the fat fraction of phantom due to the characteristic of tiny diffusion in oil15 and that ADC decreased by effects from both fat fraction and glass density are unique. In conclusion, the influence of fat contents and glass beads density on ADC values was examined in our dual-function phantom, which can be helpful to improve the accuracy of ADC quantification in clinical practice.Acknowledgements
No acknowledgement found.References
1. Raunig DL, McShane LM, Pennello G, Gatsonis C, Carson PL, Voyvodic JT, Wahl RL, Kurland BF, Schwarz AJ, Gonen M, Zahlmann G, Kondratovich MV, O'Donnell K, Petrick N, Cole PE, Garra B, Sullivan DC, Group QTPW. Quantitative imaging biomarkers: a review of statistical methods for technical performance assessment. Stat Methods Med Res 2015;24(1):27-67. doi: 10.1177/0962280214537344.
2. Jack CR, Jr., Shiung MM, Gunter JL, O'Brien PC, Weigand SD, Knopman DS, Boeve BF, Ivnik RJ, Smith GE, Cha RH, Tangalos EG, Petersen RC. Comparison of different MRI brain atrophy rate measures with clinical disease progression in AD. Neurology 2004;62(4):591-600. doi: 10.1212/01.wnl.0000110315.26026.ef
3. Partridge SC, Gibbs JE, Lu Y, Esserman LJ, Tripathy D, Wolverton DS, Rugo HS, Hwang ES, Ewing CA, Hylton NM. MRI measurements of breast tumor volume predict response to neoadjuvant chemotherapy and recurrence-free survival. AJR Am J Roentgenol 2005;184(6):1774-1781. doi: 10.2214/ajr.184.6.01841774
4. Wu X, Li R, Fleisher AS, Reiman EM, Guan X, Zhang Y, Chen K, Yao L. Altered default mode network connectivity in Alzheimer's disease--a resting functional MRI and Bayesian network study. Hum Brain Mapp 2011;32(11):1868-1881. doi: 10.1002/hbm.21153
5. Reeder SB, Sirlin CB. Quantification of liver fat with magnetic resonance imaging. Magn Reson Imaging Clin N Am 2010;18(3):337-357, ix. doi: 10.1016/j.mric.2010.08.013
6. Wu W, Miller KL. Image formation in diffusion MRI: A review of recent technical developments. J Magn Reson Imaging 2017;46(3):646-662. doi: 10.1002/jmri.25664
7. Kim HJ, Cho HJ, Kim B, You MW, Lee JH, Huh J, Kim JK. Accuracy and precision of proton density fat fraction measurement across field strengths and scan intervals: A phantom and human study. J Magn Reson Imaging. 2019 Jul;50(1):305-314. doi: 10.1002/jmri.26575. Epub 2018 Nov 14. PMID: 30430684.
8. Keenan KE, Ainslie M, Barker AJ, Boss MA, Cecil KM, Charles C, Chenevert TL, Clarke L, Evelhoch JL, Finn P, Gembris D, Gunter JL, Hill DLG, Jack CR, Jr., Jackson EF, Liu G, Russek SE, Sharma SD, Steckner M, Stupic KF, Trzasko JD, Yuan C, Zheng J. Quantitative magnetic resonance imaging phantoms: A review and the need for a system phantom. Magn Reson Med 2018;79(1):48-61. doi: 10.1002/mrm.26982
9. Portakal ZG, et al. Design and characterization of tissue-mimicking gel phantoms for diffusion kurtosis imaging. Med Phys. 2018.
10. Bernard CP, et al. Comparison of fat quantification methods: a phantom study at 3.0T. J Magn Reson Imaging. 2008.
11. Partridge SC, Singer L, Sun R, Wilmes LJ, Klifa CS, Lehman CD, Hylton NM. Diffusion-weighted MRI: influence of intravoxel fat signal and breast density on breast tumor conspicuity and apparent diffusion coefficient measurements. Magn Reson Imaging. 2011 Nov;29(9):1215-21. doi: 10.1016/j.mri.2011.07.024. Epub 2011 Sep 14. PMID: 21920686; PMCID: PMC3199288.
12. Chang HC, Juan CJ, Chiu HC, Cheng CC, Chiu SC, Liu YJ, Chung HW, Hsu HH. Effects of gender, age, and body mass index on fat contents and apparent diffusion coefficients in healthy parotid glands: an MRI evaluation. Eur Radiol. 2014 Sep;24(9):2069-76. doi: 10.1007/s00330-014-3265-z. Epub 2014 Jun 28. PMID: 24972952.
13. Merritt S, Gulsen G, Chiou G, Chu Y, Deng C, Cerussi AE, Durkin AJ, Tromberg BJ, Nalcioglu O. Comparison of water and lipid content measurements using diffuse optical spectroscopy and MRI in emulsion phantoms. Technol Cancer Res Treat. 2003 Dec;2(6):563-9. doi: 10.1177/153303460300200608. PMID: 14640767.
14. Portakal ZG, Shermer S, Jenkins C, Spezi E, Perrett T, Tuncel N, Phillips J. Design and characterization of tissue-mimicking gel phantoms for diffusion kurtosis imaging. Med Phys. 2018 Jun;45(6):2476-2485. doi: 10.1002/mp.12907. Epub 2018 Apr 27. PMID: 29635795.
15. Periquito, J.d.S., Paul, K., Huelnhagen, T. et al. Diffusion-weighted Renal MRI at 9.4 Tesla Using RARE to Improve Anatomical Integrity. Sci Rep 9, 19723 (2019). https://doi.org/10.1038/s41598-019-56184-6
Figures