3862
Quantitatively Evaluating the Effect of Fat on ADC Measurement in EP-DWI and PROPELLER-DWI Using Fat-Water Phantom1Department of Biomedical Engineering and Environmental Sciences, National Tsing Hua University, Hsinchu, Taiwan, 2Department of Medical Imaging, China Medical University Hsinchu Hospital, Hsinchu, Taiwan, 3Department of Radiology, School of Medicine, China Medical University, Taichung, Taiwan, 4Department of Automatic Control Engineering, Feng Chia University, Taichung, Taiwan, 5Institute of Cancer Biology, China Medical University, Taichung, Taiwan, 6Department of Biomedical Engineering, Chinese University of Hong Kong, Sha Tin, Hong Kong, 7Institute of Nuclear Engineering and Science, National Tsing Hua University, Hsinchu, Taiwan
Synopsis
ADC estimations are still known to be influenced by the content of fat. Fat suppression is normally applied in order to avoid the ADC measurement with fat contamination. The aim of this study was to evaluate the fat effect on ADC measurement by EP-DWI and PROP-DWI combined with different fat suppression techniques using a fat-water phantom with different fat fractions. Our results suggest that the ADC measurement is affected by the fat fraction and the MR sequences but not the fat suppression methods in EP-DWI.
Introduction
Diffusion-weighted imaging (DWI) is a MR imaging that can measure proton diffusion information by calculating apparent diffusion coefficient (ADC) in tissue. Although single-shot echo-planar diffusion-weighted imaging (EP-DWI) is most commonly used for diffusion measurement currently, it is susceptible to artifacts such as N/2 ghost artifacts, chemical shift artifacts, and geometric distortion. Fast spin echo DWI with periodically rotated overlapping parallel lines with enhanced reconstruction (PROP-DWI) was introduced to eliminate signal pile-up and geometric warping associated with the EP-DWI1. ADC has been regarded as a tumor biomarker which is sensitive to biophysiological conditions such as cell organization, cell density, microstructure, and microcirculation2. However, ADC estimations based on fast spin-echo imaging are still known to be influenced by the content of fat in the breast3 and parotid tumor4. Therefore, fat suppression is necessary in order to avoid the contamination of fat on the ADC measurement. Three fat suppression methods, water excitation (WE), chemical shift selective (CHESS), and short tau inversion recovery (STIR), are usually used to eliminate the fat effect for ADC measurement. Quality assessment and quality control of MR imaging using a quantitative phantom is important to ensure the accuracy and precision of measurement5. The aim of this study was to design a fat fractions (FF) phantom containing different fat fractions to quantify the ADC measured by EP-DWI and PROP-DWI combined with different fat suppression techniques.Materials and Methods
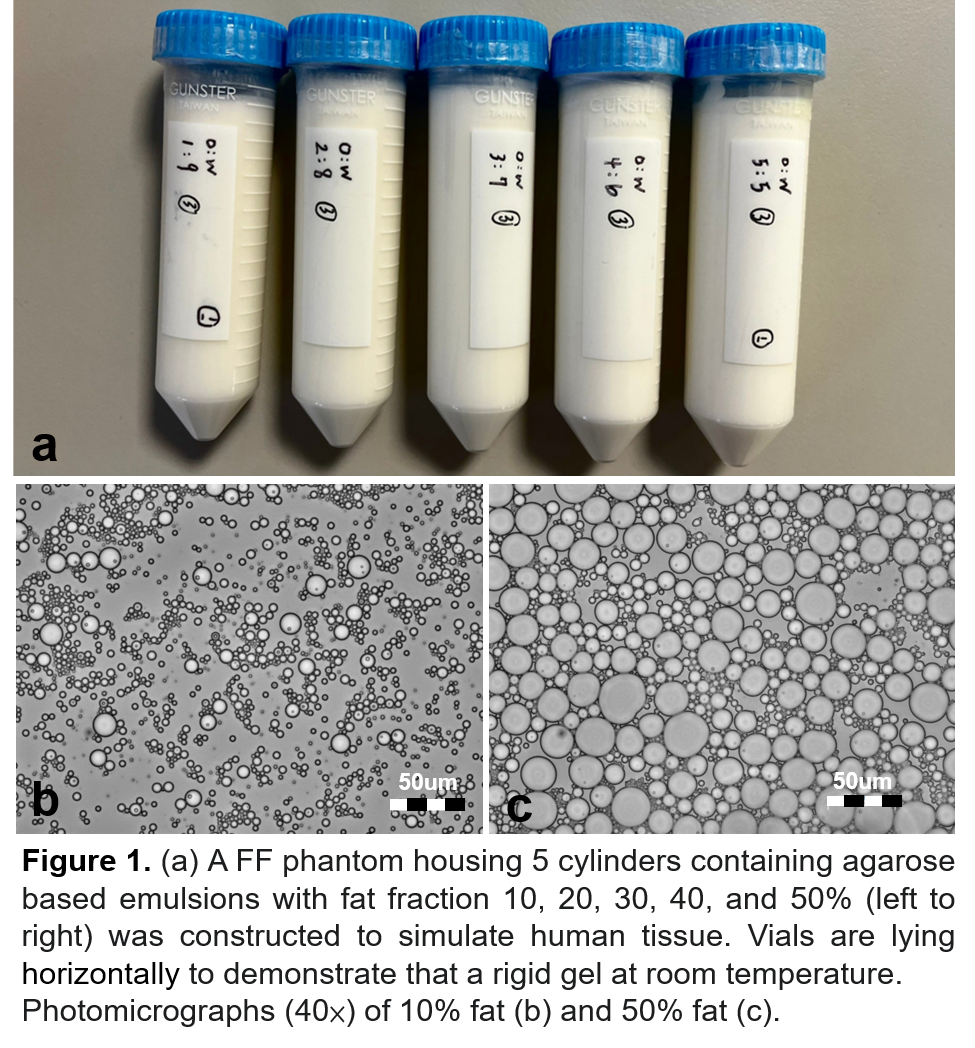
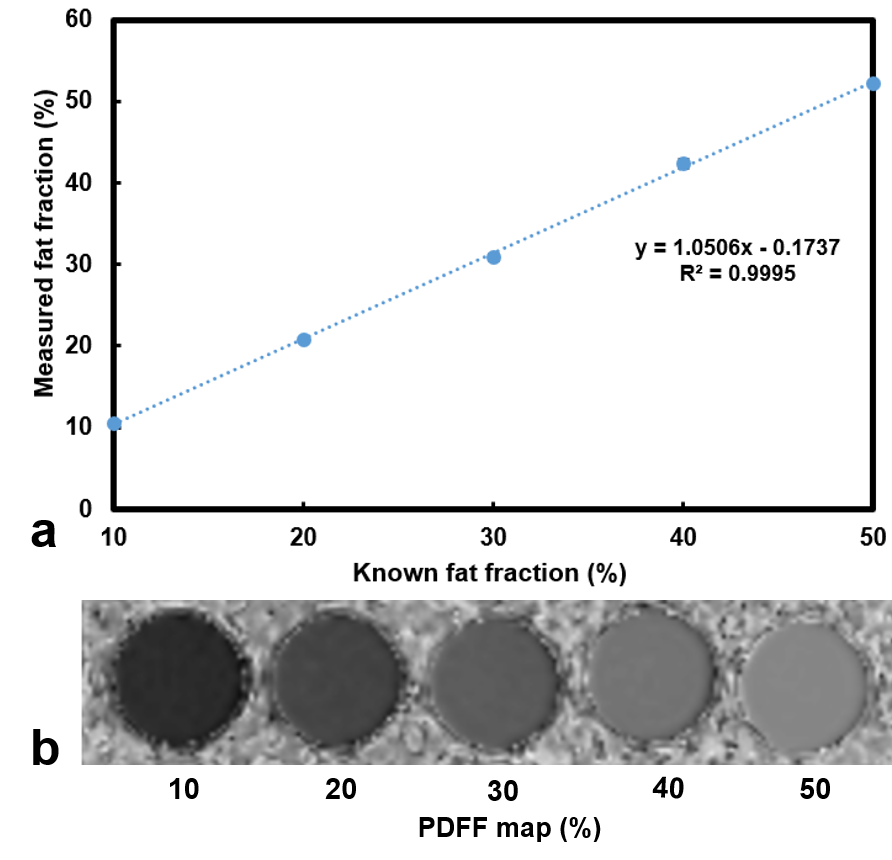
Phantom design: Six phantoms with fat fractions of 10%, 20%, 30%, 40%, 50%, and 100% were made respectively using mixed proper weights of soybean oil and water with the emulsifying agent (Trion X-100)6 and coagulant (agarose)7. MRI scans: All images were performed by a 1.5 Tesla MR scanner (GE Signa MR450w, GE Healthcare). IDEAL IQ sequence was applied to verify the fat fraction of phantom8. The IDEAL IQ method was a three-dimensional fast spoiled gradient-echo (3D-FSPGR) sequence employing a six-echo acquisition (1.1ms-6.38ms) with the imaging parameters including TR, 19.6ms; FOV, 210×210mm; matrix size, 128×128; pixel bandwidth, 90.91 kHz; flip angle, 5; and slice thickness, 10mm. EP-DWIs with fat suppression by WE, CHESS, and STIR were performed, respectively, in axial plane with the scanning parameters including TR, 4000 ms; TE, 78 ms; TI, 105 ms (STIR); b, 0 and 1000 $$$s/mm^{2}$$$ in three orthogonal bipolar diffusion gradients; NEX, 4; matrix size, 128 × 128; FOV, 210 × 210 mm; and section thickness, 10 mm. PROP-DWIs with three fat suppression, no fat saturation (no sat), fat saturation (fat sat), and classic fat saturation (fat cla. sat), were separately performed in the axial plane with the protocol parameters in the following, TR = 4000 ms, TE =85 ms, b = 0 and 1000 $$$s/mm^{2}$$$ in three orthogonal bipolar diffusion gradients, NEX=4, matrix size 128 x 128, FOV 210 x 210 mm, section thickness = 10 mm. Data processing: Proton density fat fraction (PDFF) maps were automatically produced by the MRI scanner. ADC maps were generated via pixel-by-pixel computation from $$$b_{0}$$$ and $$$b_{1000}$$$ images based on a mono-exponential model using a formula of $$$SI_{b1000}=SI_{b0}\times e^{-bD}$$$. A slice containing the largest cross-sectional area of the phantom was chosen for ROI selection to circle whole tube in every DWI and IDEAL IQ scans. Then the values of mean and standard deviations were calculated for the analysis. Linear regression analysis was used to evaluate the relationship among the fat and ADC measures.Result
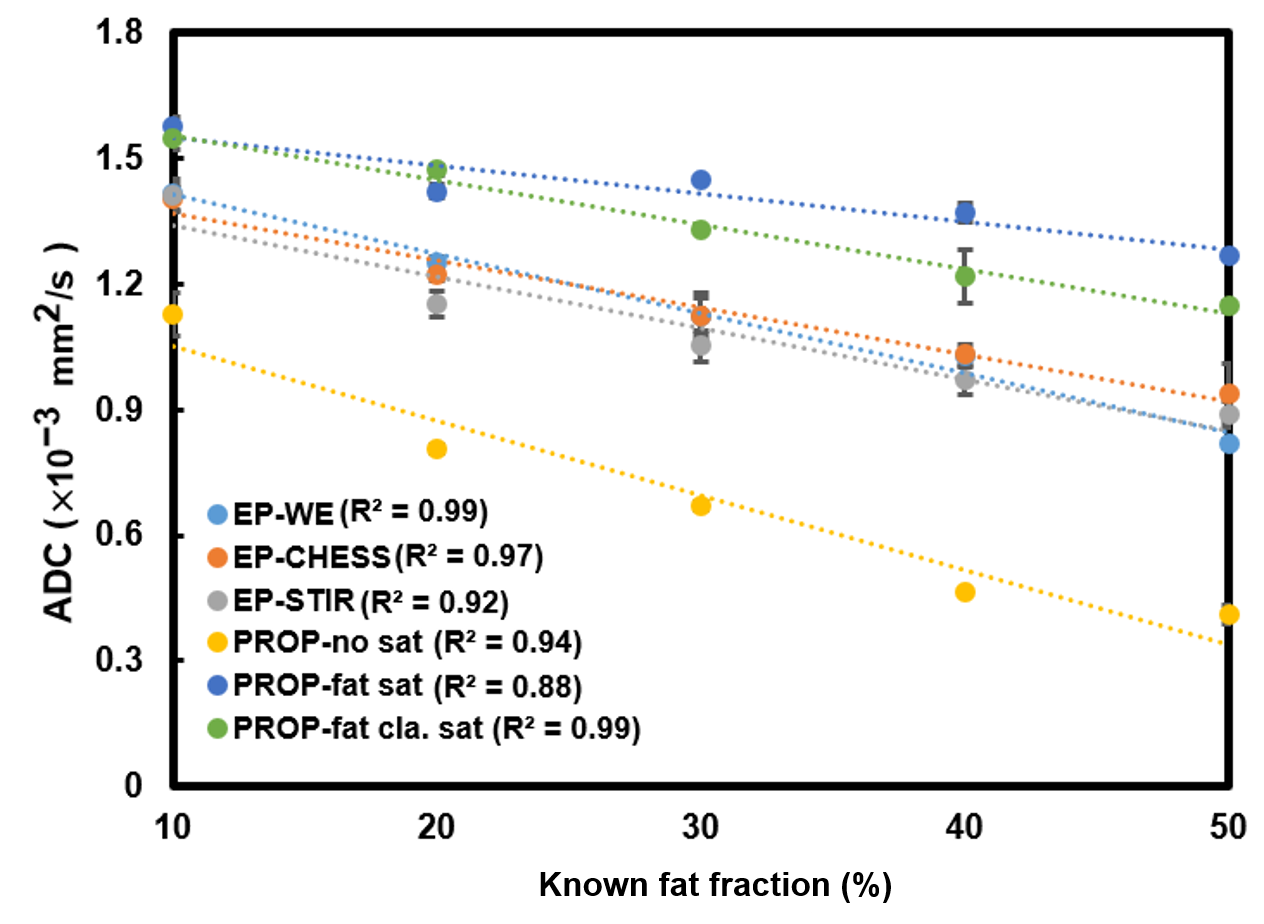
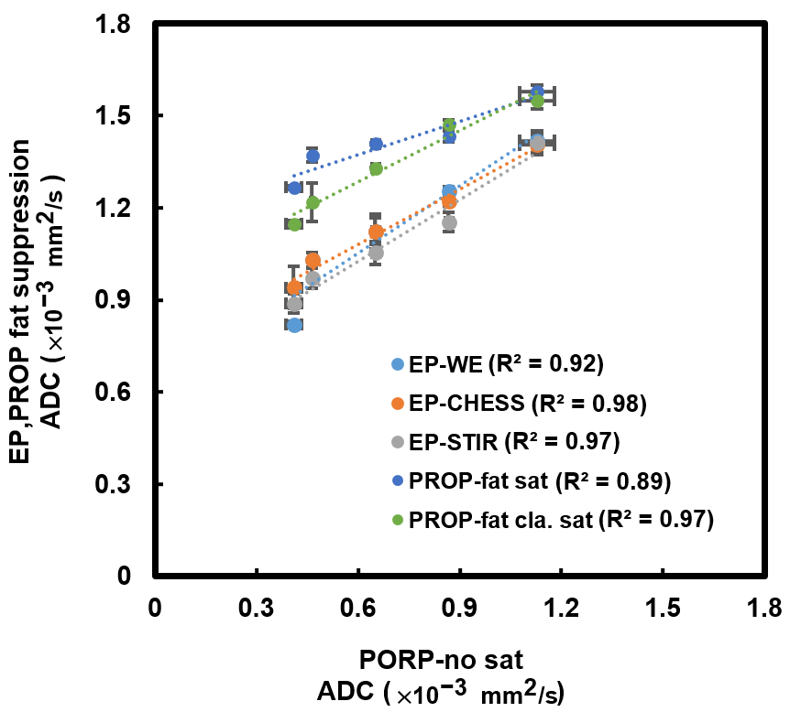
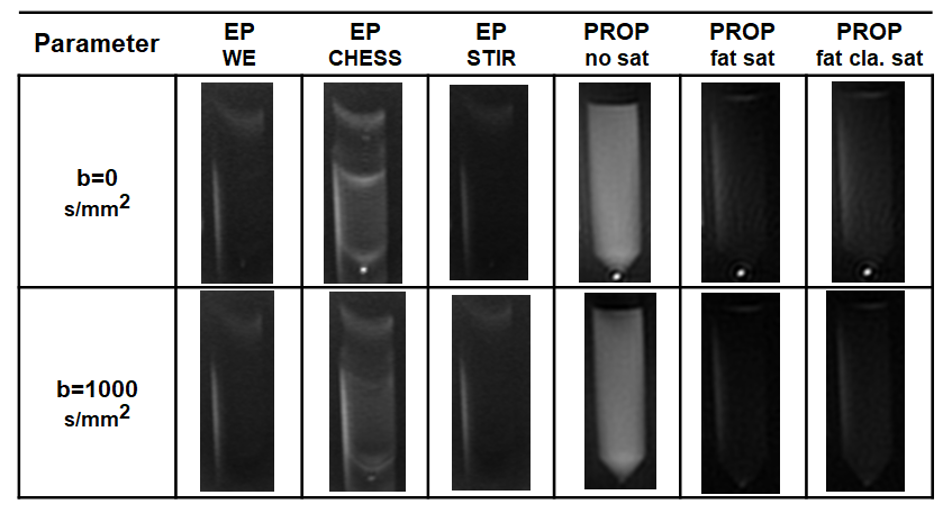
Five cylinders containing solidified agarose-based emulsions with fat fraction of 10%, 20%, 30%, 40%, and 50% from left to right, respectively, were demonstrated (Fig.1a). Microscopic images of 10% (Fig. 1b) and 50% (Fig. 1c) FF tubes show the distribution and arrangement of fat droplets and water in the emulsion. Scatter plot shows high linearity (slope 1.05) and small bias (–0.17 %) of fat fractions on PDFF maps vs. phantoms (Fig. 2). ADCs at different phantom FFs with respect to different pulse sequences and fat suppression methods were shown on Fig. 3. Linear regression analysis reveals the linear relationship of ADCs between fat suppression (EP-DWI and PROP-DWI) and non-fat suppression (PROP-DWI) in Fig. 4. Fig. 5 illustrates b=0 and b=1000 $$$s/mm^{2}$$$ images of the 100% FF phantom scanned by EP-DWI and PROP-DWI using the different methods of fat suppression.Discussion and Conclusion
The ADC offset from fat suppression to non-fat suppression was obviously observed in Fig. 3. Due to the characteristics of tiny diffusion in oil9, the ADC is lower in non-fat suppression compared with fat suppression and is negatively proportional to the fat fraction of phantom. The ADC measured in fat-saturated PROP-DWI was higher than in non-fat-saturated PROP-DWI, similar to previous study10. Although the fat signal was better suppressed by STIR than by WE and CHESS in EP-DWI, the ADCs were not related to the three fat suppression methods in EP-DWI. The effect of fat suppression was similar between fat sat and fat cla. sat in PROP-DWI, but the ADC was divergent at high fat fraction. Our results suggest that the ADC measurement is affected by the fat fraction and the MR sequences but not the fat suppression methods in EP-DWI in the phantom study.Acknowledgements
No acknowledgement found.References
1. Pipe JG, Farthing VG, Forbes KP. Multishot diffusion-weighted FSE using PROPELLER MRI. Magn Reson Med. 2002.
2. Sun Y, Tong T, Cai S, Bi R, Xin C, Gu Y. Apparent Diffusion Coefficient (ADC) value: a potential imaging biomarker that reflects the biological features of rectal cancer. PLoS One. 2014.
3. Partridge SC, Singer L, Sun R, Wilmes LJ, Klifa CS, Lehman CD, Hylton NM. Diffusion-weighted MRI: influence of intravoxel fat signal and breast density on breast tumor conspicuity and apparent diffusion coefficient measurements. Magn Reson Imaging. 2011.
4. Chang HC, Juan CJ, Chiu HC, Cheng CC, Chiu SC, Liu YJ, Chung HW, Hsu HH. Effects of gender, age, and body mass index on fat contents and apparent diffusion coefficients in healthy parotid glands: an MRI evaluation. Eur Radiol. 2014.
5. Keenan KE, Ainslie M, Barker AJ, Boss MA, Cecil KM, Charles C, Chenevert TL, Clarke L, Evelhoch JL, Finn P, Gembris D, Gunter JL, Hill DLG, Jack CR Jr, Jackson EF, Liu G, Russek SE, Sharma SD, Steckner M, Stupic KF, Trzasko JD, Yuan C, Zheng J. Quantitative magnetic resonance imaging phantoms: A review and the need for a system phantom. Magn Reson Med. 2018.
6. Merritt S, Gulsen G, Chiou G, Chu Y, Deng C, Cerussi AE, Durkin AJ, Tromberg BJ, Nalcioglu O. Comparison of water and lipid content measurements using diffuse optical spectroscopy and MRI in emulsion phantoms. Technol Cancer Res Treat. 2003.
7. Portakal ZG, Shermer S, Jenkins C, Spezi E, Perrett T, Tuncel N, Phillips J. Design and characterization of tissue-mimicking gel phantoms for diffusion kurtosis imaging. Med Phys. 2018.
8. Kim HJ, Cho HJ, Kim B, You MW, Lee JH, Huh J, Kim JK. Accuracy and precision of proton density fat fraction measurement across field strengths and scan intervals: A phantom and human study. J Magn Reson Imaging. 2019.
9. Periquito, J.d.S., Paul, K., Huelnhagen, T. et al. Diffusion-weighted Renal MRI at 9.4 Tesla Using RARE to Improve Anatomical Integrity. 2019.
10. Juan CJ, Chang HC, Hsueh CJ, Liu HS, Huang YC, Chung HW, Chen CY, Kao HW, Huang GS. Salivary glands: echo-planar versus PROPELLER Diffusion-weighted MR imaging for assessment of ADCs. Radiology. 2009.
Figures