3861
Temperature Dependence of the Electric Properties in MR Phantoms1Istituto Nazionale di Ricerca Metrologica (I.N.Ri.M.), Torino, Italy, 2Physikalisch-Technische Bundesanstalt (PTB), Braunschweig and Berlin, Germany
Synopsis
Phantom realization represents an important activity for the development and validation of advanced MR-based quantitative imaging techniques such as Magnetic Resonance Fingerprinting or Electrical Properties Tomography. In this regard, phantoms represent a reliable ground truth with the requirement that the sought properties are properly characterised in the variety of conditions at which the phantoms will be finally deployed. In this abstract, measurements of the electrical properties of two different gel-based tissue-mimicking materials are presented as a function of their temperature. A linear dependence with positive (negative) slope between temperature and electrical conductivity (relative permittivity) is observed.
INTRODUCTION
Phantoms for quantitative MRI have been largely studied thanks to their potential to represent a reliable ground truth against which it is possible to validate the outcomes from quantitative imaging techniques such as Magnetic Resonance Fingerprinting (MRF) or Electrical Properties Tomography (EPT)1-3. A fundamental requirement in this regard is that the relevant physical properties of the tissue-mimicking materials composing such phantoms are properly validated in the variety of conditions at which the phantoms are supposed to be deployed. The electrical properties (EPs) of tissues are found to be a valuable bio-marker, able to provide useful diagnostic information in early tumors detection and in characterization of diseases evolution4-6. This explains the need to develop tissue-mimicking materials whose EPs are tuned to mimic those of selected tissues. A traceable characterisation of these properties opens the door for a reliable validation of the quantitative MR techniques, such as EPT, able to measure them7,8. In this abstract, the measured EPs of two different gel-based tissue-mimicking materials are presented as a function of temperature. The relevance of this study is twofold. It provides a more precise knowledge of the outcomes expected from the MR-based quantitative technique applied to a specific phantom. Furthermore, it allows to investigate the ability of the aforementioned MR techniques to determine the temperature variation via deduction of EP changes, exploiting the dependence of the phantom EPs to temperature9.METHODS
Two cylindrical gel-based homogeneous phantoms (Figure 1), mimicking the EPs of the grey and white matter, were considered. The phantom EPs were measured at different temperatures between 10 °C to 35 °C with 5 °C steps. The phantoms thermalisation was achieved through a water bath chiller. The phantoms were left in the thermalised bath for about two hours; then, their temperature was checked with an infrared thermometer and their EPs were measured in a frequency range from 50 MHz to 350 MHz. Two open-ended coaxial probes10,11 were deployed: a SPEAG DAK-1212 and a homemade probe, connected to a Copper Mountain S5065 and Agilent 4396B VNA, respectively. The large flange of the SPEAG probe, likely to distort the phantoms temperature due to its large thermal conductance, was thermalised as well. Whereas, this has not been possible with the homemade probe due to its rigid attachment to the heavy VNA. Three repetitive measurements were performed and averaged with the SPEAG probe leaving the phantoms inside the thermalised bath. Afterwards, the phantoms were put onto the lifting table prepared for the homemade probe measurements. To avoid excessive phantom temperature deviations, only two measurements were performed and the temperature was continuously acquired. The two measurements were averaged only if the phantom temperature variation was found to be below 1 °C. Otherwise, they were considered separately. Finally, a repeatability analysis, with both phantoms and probes at ambient temperature, was performed identifying an experimental standard deviation to be associated to all measurements.RESULTS
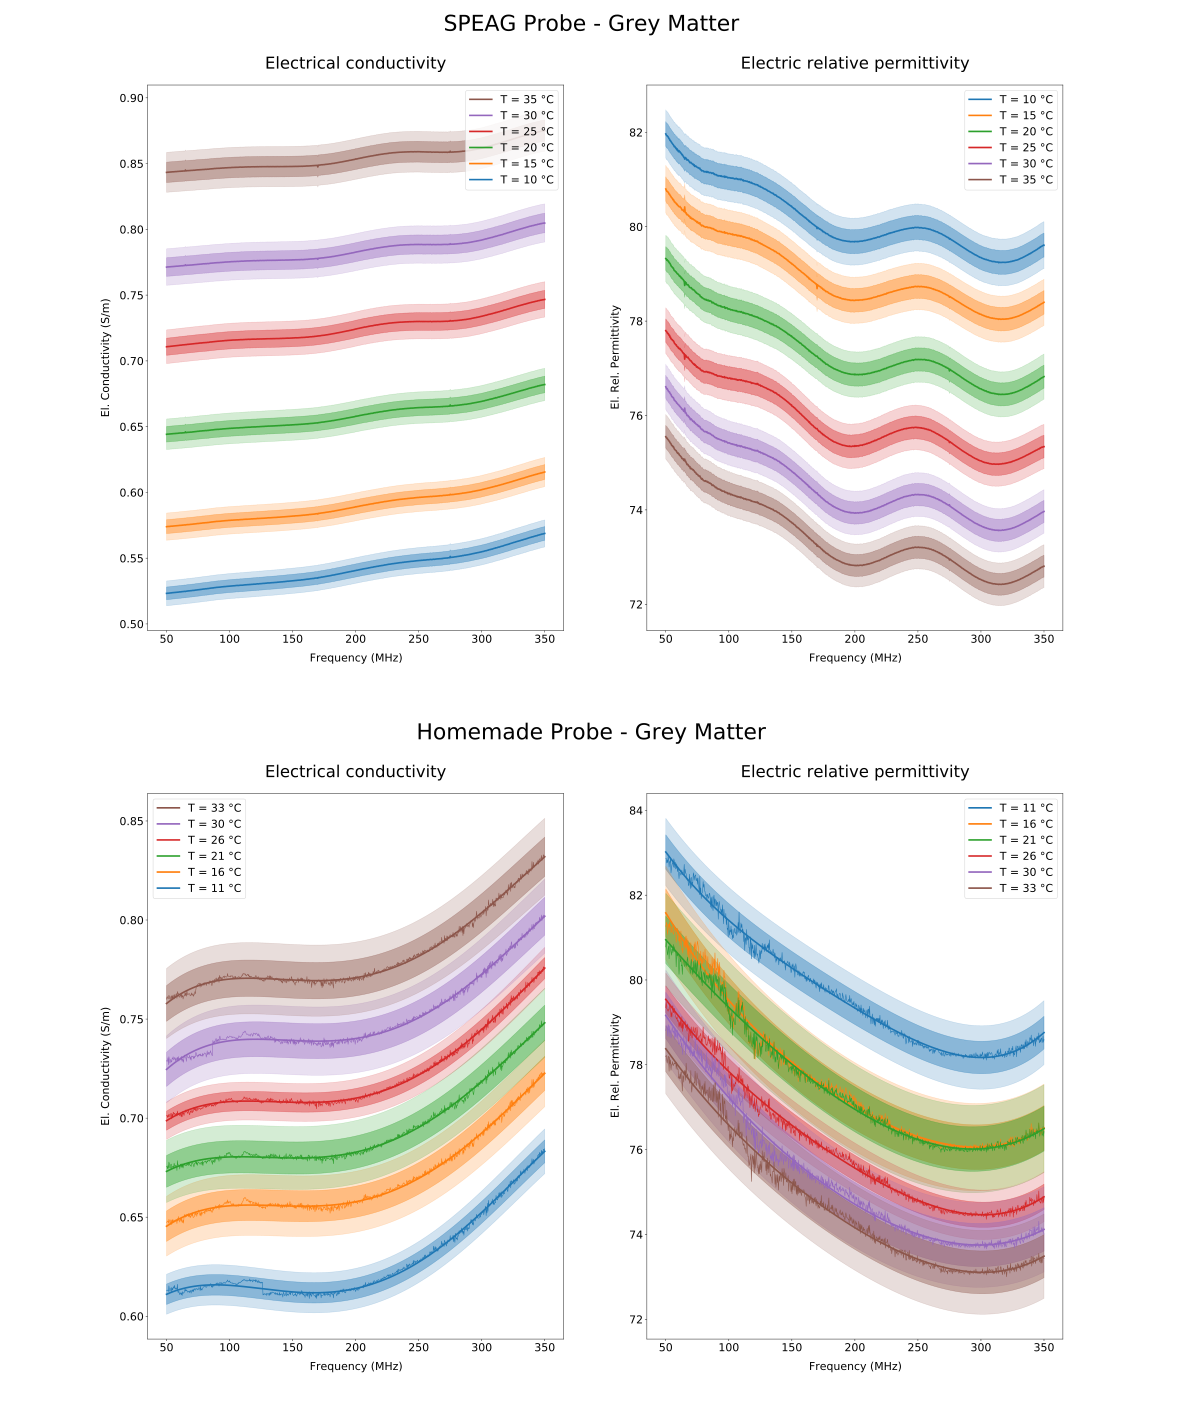
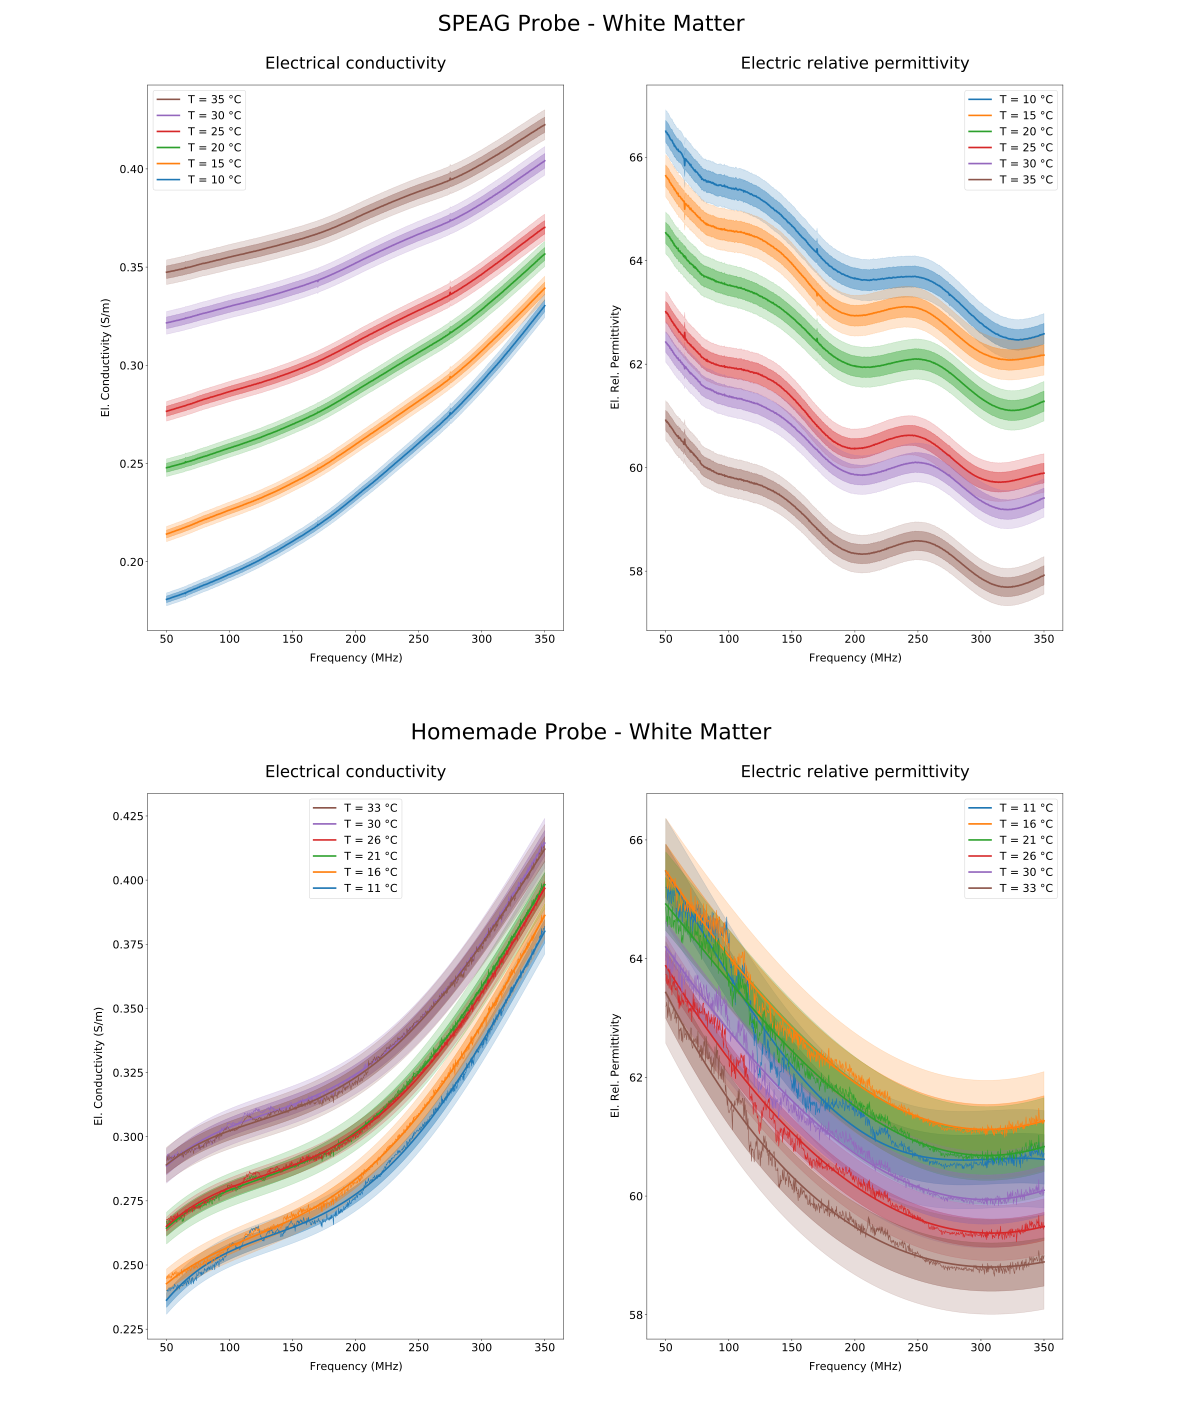
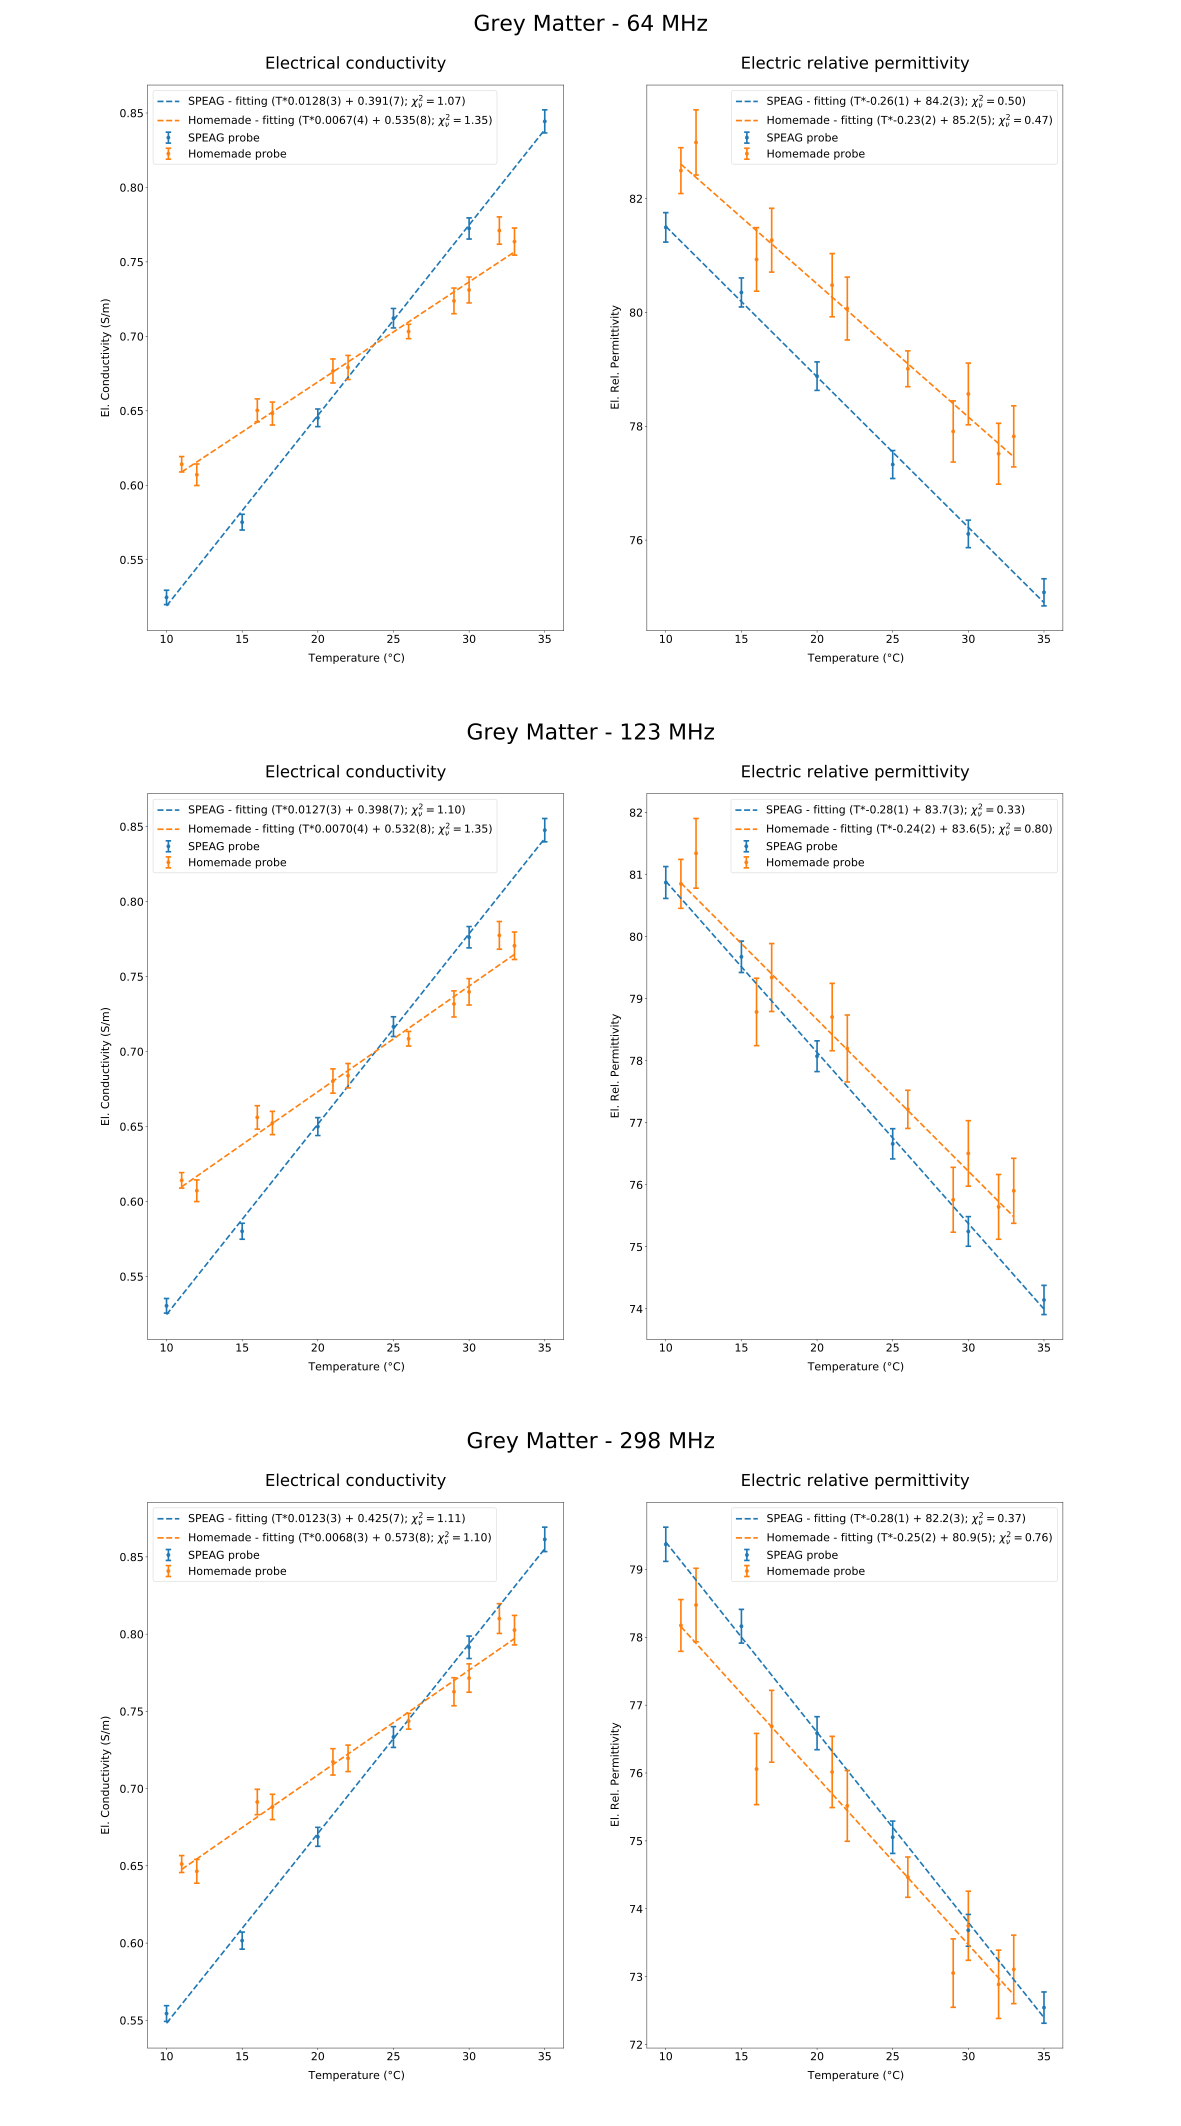
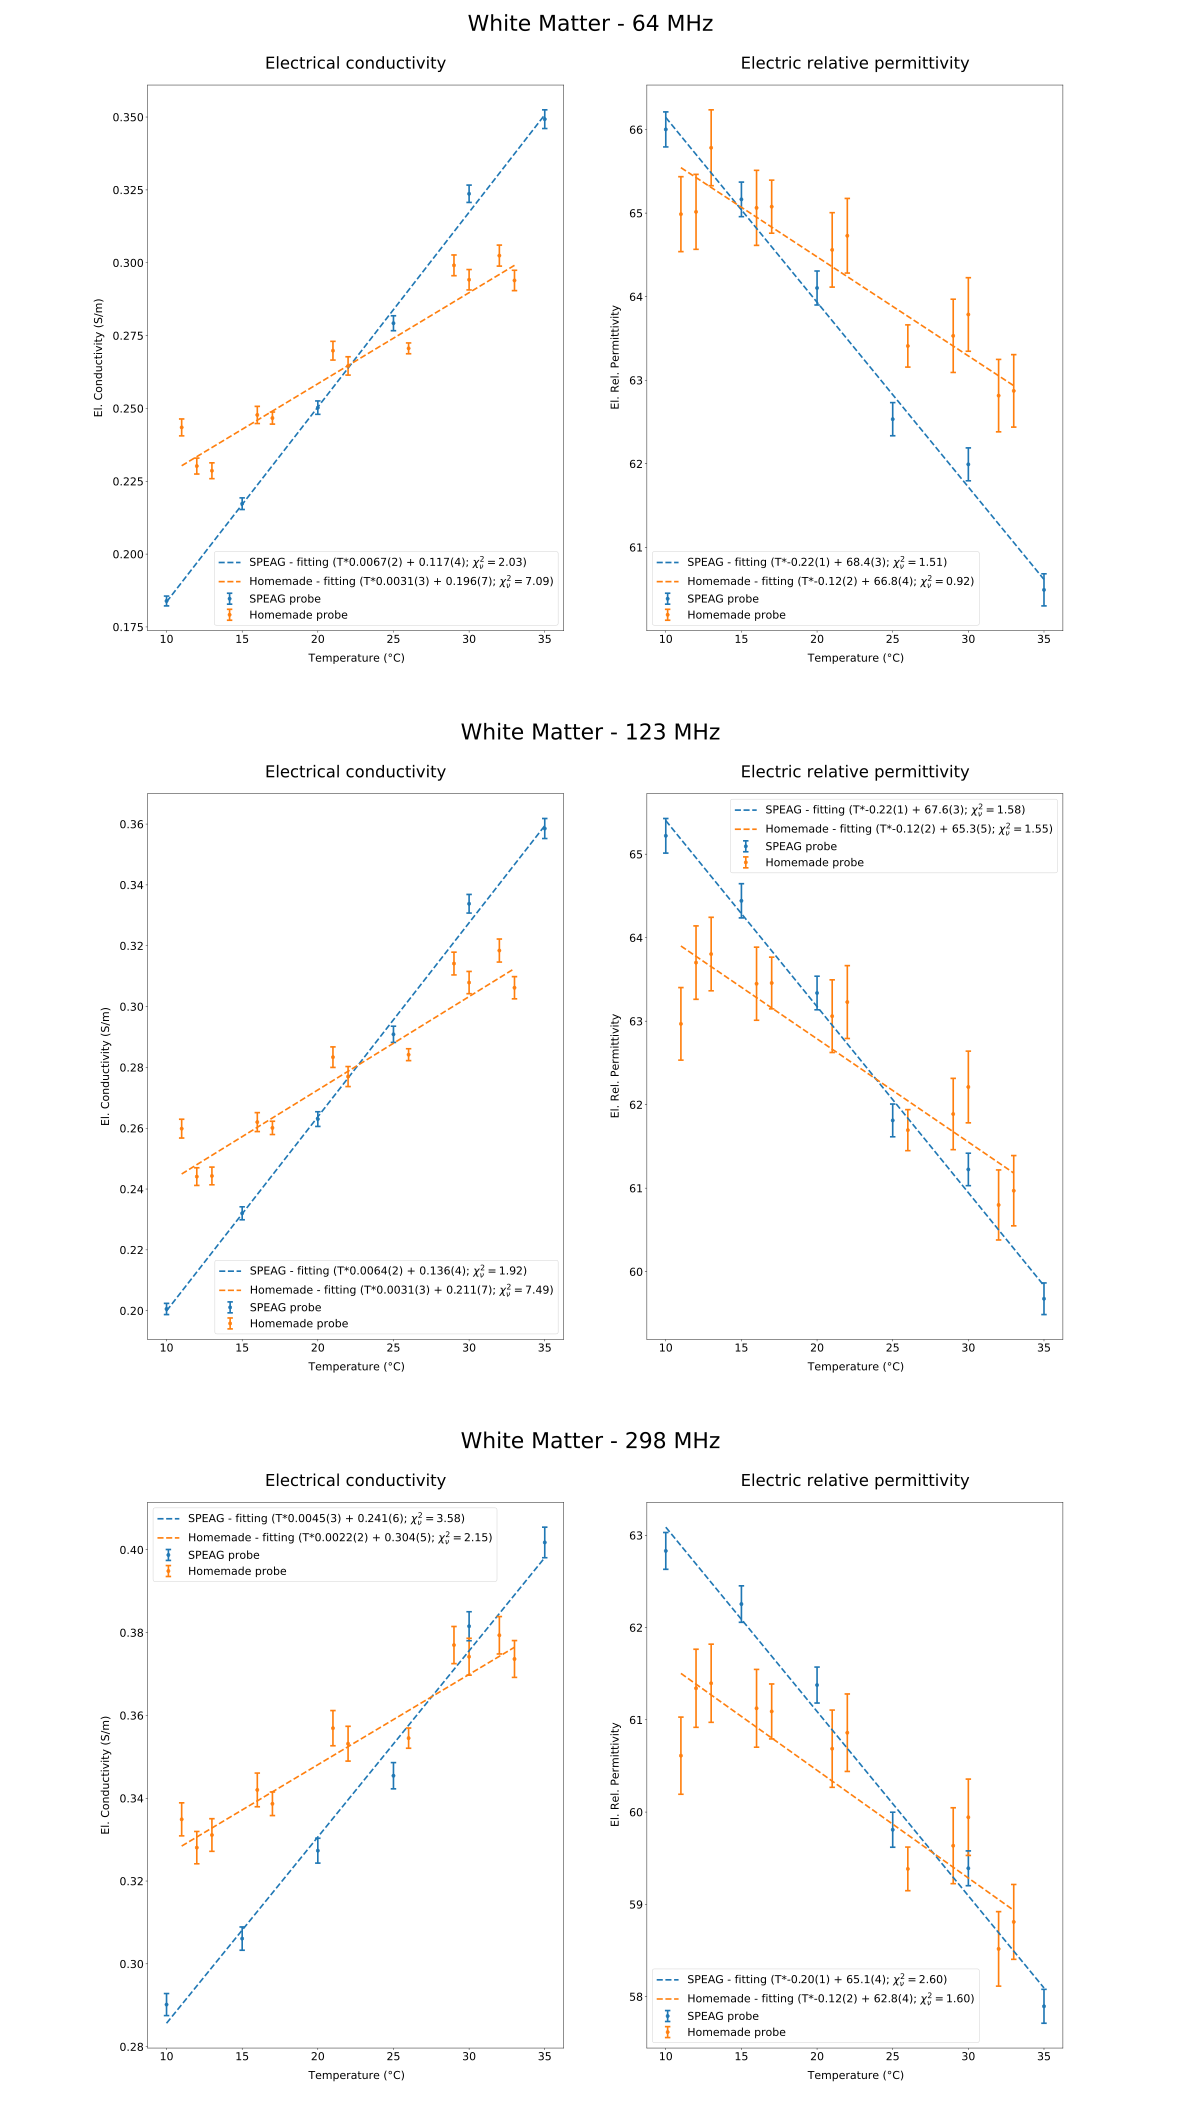
Figures 2 and 3 show the measured electrical conductivity (σ) and relative electric permittivity (εr) as a function of frequency, both for the SPEAG and homemade probe. Due to the higher fluctuations of the measurements acquired with the homemade probe, a 4th order polynomial fitting is applied. The latter is shown in the figures on top of the original acquisitions. Figures 4 and 5 show the values of σ and εr as a function of temperature at 64 MHz, 123 MHz and 298 MHz. To analyse the dependence of the EPs with respect to temperature, a linear fitting is applied and reported in the graphs.DISCUSSION
The χv2 (reduced chi-squared) values, resulting from the linear regressions (Figures 4 and 5), are generally near to one and justify the assumption of a linear increase (decrease) of σ (εr) for a rising temperature. The measurements for the white matter phantom, however, result to be more scattered with respect to those relevant to the other phantom. This reflects into typically higher χv2 values. For each phantom EP and measuring system, the slope of the fitting lines is found to be independent of frequency. The influence of the temperature is more pronounced for σ and for the grey matter phantom. All slopes from the linear fitting, when applied to the measurements performed with the homemade probe, are generally smaller. This is in line with the unavoidable temperature change which occurred during these measurements and suggests that the temperature values, measured during the measurement process with the infrared thermometer, could not account exactly for the effective temperature change of the phantoms outside the water bath. However, it is unclear if the uncertainty in temperature determination could explain all the deviations between the two system results, suggesting that further sources of uncertainties, other than repeatability, may be accounted for.CONCLUSION
The significant influence of the temperature on the phantom EPs, exposes the importance of accounting for this parameter in defining the ground truth against which the reliability of the relevant MR-based quantitative techniques has to be tested. Furthermore, the ability of such techniques to estimate temperature variations during an MR exam observing the modifications of the EPs, can be investigated taking advantage from the strong correlation between the EPs and temperature shown by these phantoms.Acknowledgements
This project (18HLT05-RMG1 QUIERO) has received funding from the EMPIR programme co-financed by the Participating States and from the European Union’s Horizon 2020 research and innovation programmeReferences
- Mandija S, Meliadò E. F, Huttinga N. R. F, et al. Opening a new window on MR-based Electrical Properties Tomography with deep learning. Scientific Reports. 2019. 9.
- Liu J, Wang Y, Katscher U, He B. Electrical Properties Tomography Based on B1 Maps in MRI: Principles, Applications, and Challenges. IEEE Transactions on Biomedical Engineering. 2017. 64(11): 2515 – 2530.
- Jiang Y, Ma D, Keenan K. et al. Repeatability of magnetic resonance fingerprinting T1 and T2 estimates assessed using the ISMRM/NIST MRI system phantom. Magnetic Resonance in Medicine. 2017. 78(4): 1452 – 1457.
- Joines W. T, Zhang Y, Li C, Jirtle R. L. The measured electrical properties of normal and malignant human tissues from 50 to 900 MHz. Medical Physics. 1994. 21(4): 547 – 50.
- Stojadinovic A, Nissan A, Gallimidi Z, et al. Electrical Impedance Scanning for the Early Detection of Breast Cancer in Young Women: Preliminary Results of a Multicenter Prospective Clinical Trial. Journal of Clinical Oncology. 2005. 23(12): 2703 – 2715.
- Hassan A. M, El-Shenawee M. Review of electromagnetic techniques for breast cancer detection. IEEE Reviews in Biomedical Engineering. 2011. 4: 103 – 118
- Leijsen R, Brink W, van den Berg C, et al. Electrical Properties Tomography: A Methodological Review. Diagnostics (Basel). 2021. 11(2): 176.
- Arduino A. EPTlib: An Open-Source Extensible Collection of Electric Properties Tomography Techniques. Applied Sciences. 2021. 11: 3237.
- Martinez J. A., Moulin K., Ennis D. B. RF-induced heating during MRI examinations depends on the baseline temperature. Proc. Intl. Soc. Mag. Reson. Med. 28 (2020) 4202.
- Stuchly M. A, Athey T. W, Samaras G. M, Taylor G. E. Measurement of Radio Frequency Permittivity of Biological Tissues with an Open-Ended Coaxial Line: Part I. IEEE Transactions on Microwave Theory and Techniques, 1982. 30(1): 87 – 92.
- La Gioia A, Porter E, Merunka I, et al. Open-Ended Coaxial Probe Technique for Dielectric Measurement of Biological Tissues: Challenges and Common Practices. Diagnostics (Basel). 2018. 8(2):40
- Speag. DAK. https://speag.swiss/products/dak/dak-probes/. Accessed November 8, 2021.
Figures
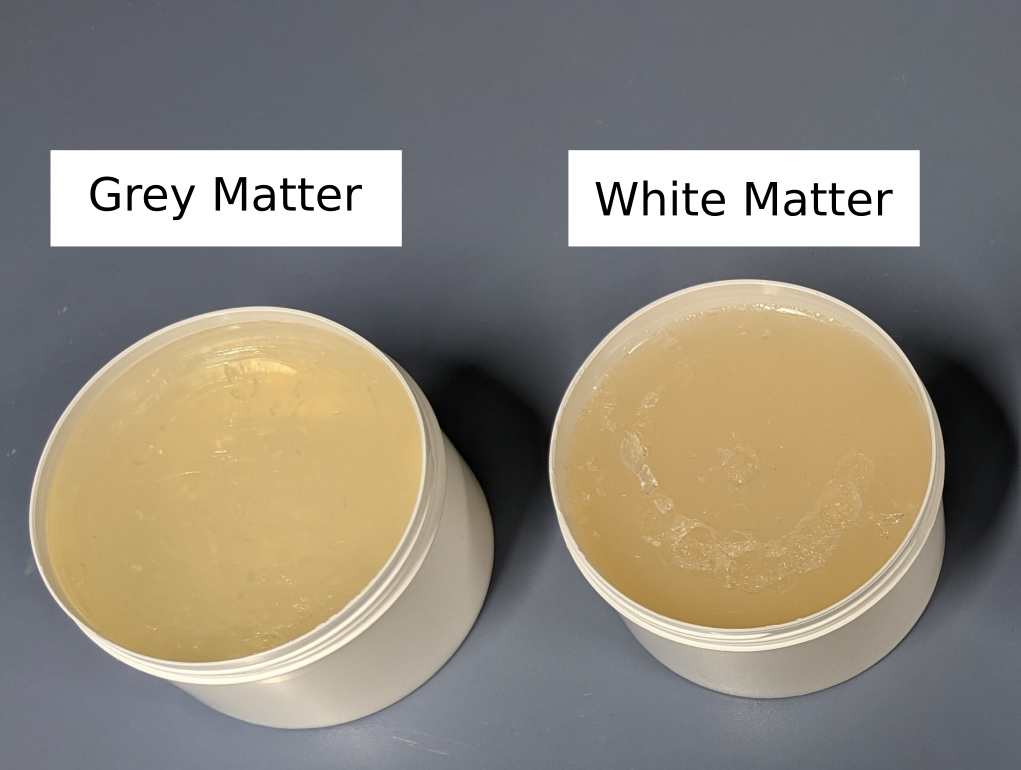
FIG 1: Picture of the grey matter and white matter cylindrical phantoms (radius: 44 mm, height: 90 mm).
Grey matter phantom components: Gellan Gum (1.5 %), NaCl (0.15 %), Agar (0.8 %),GdCl3 (8 μmol/kg) and NaN3 (0.1 %)
White matter phantom components: Gellan Gum (1.5 %), Glycerine (50 %), NaCl (0.5 %), Agar (2 %), GdCl3 (8 μmol/kg) and NaN3 (0,1 %)