3860
Resolution phantoms for MR microimaging with 4µm≤ps≤256µm based on anisotropic tube channels (PSF + MTF) fabricated by Deep X-Ray-Lithography1Center for Medical Physics and Biomedical Engineering, MR-Physics, Medical University of Vienna, Vienna, Austria, 2High field MR-Center, Medical University of Vienna, Vienna, Austria, 3Karlsruhe Nano-Micro facility (KNMFi), Karlsruhe Institute of Technology (KIT), Eggenstein-Leopoldshafen, Germany, 4Institute of Microstructure Technology (IMT), Karlsruhe Institute of Technology (KIT), Eggenstein-Leopoldshafen, Germany
Synopsis
The most important quality control criterions in Magnetic Resonance Imaging (MRI) are represented by the contrast-to-noise-ratio (CNR) and the spatial resolution. This report presents the design, a prototype object, an exemplary MRI evaluation, qualitative results and quantitation of the spatial resolution up to microscopic scale beyond pixel-size characterization. The phantom is manufactured using Deep X-Ray Lithography (DXRL) at the Synchrotron radiation source KARA (Karlsruhe Research Accelerator) for obtaining highly anisotropic tube type cavities for getting the Point-Spread-Function (PSF) and Modulation Transfer Function (MTF) in MR-µ-imaging ranging from d=256µm down to d≈4 µm.
INTRODUCTION
Modern human Ultra-High-Field MR-scanners allow in principle for spatial resolutions in the microscopic range (pixel-size ps<100x100µm2) at larger slice thickness e.g. sl≥400µm. On Ultrahigh-field animal scanners significantly smaller voxels might be obtained (e.g. VS=10x10x40µm3). However the spatial resolution of an MR-imaging device is only restricted by the voxel-size; the actual spatial resolution is dependent on several different technical and sample specific features, e.g. signal-to-noise-ratio (SNR), linewidth (T2), susceptibility differences, gradient-strength available, gradient switching behaviour and shimming performance. Concepts for the independent quantitative measurement of spatial resolution are based on the Line-Spread-Function (LSF) and Modulation-Transfer-Function (MTF)1,2,3,4. However these concepts rely on isoplanatism (independence of the image of a point-sized object on the position). We here present an investigational resolution-phantom-design for the measurement of the Point-Spread-Function (PSF) using small-sized-objects (tube-channels) and a hexagonal tube-grid-system, which would allow not only for a quick qualitative check on actually obtained spatial resolution down to p/2≈1µm, but also the quantitative evaluation of the PSF ranging from d=256µm down to d≈1µm. The demands for spatial accuracy and aspect-ratios on the micro-manufacturing technology for obtaining tubes at d=1µm with 300-500µm depth have been very ambitious. We report here about technical realizations featuring PMMA plates at thickness th1=300µm and th2=500µm using advanced X-ray lithographic micro-structuring methods for highest anisotropy adapted to MR-slice-selective imaging. The design concept, actually manufactured prototype phantoms and an example of the MR-evaluation of the PSF for an MR-protocol at VS: 36x37x300µm3 are shown within this contribution.METHODS AND MATERIALS
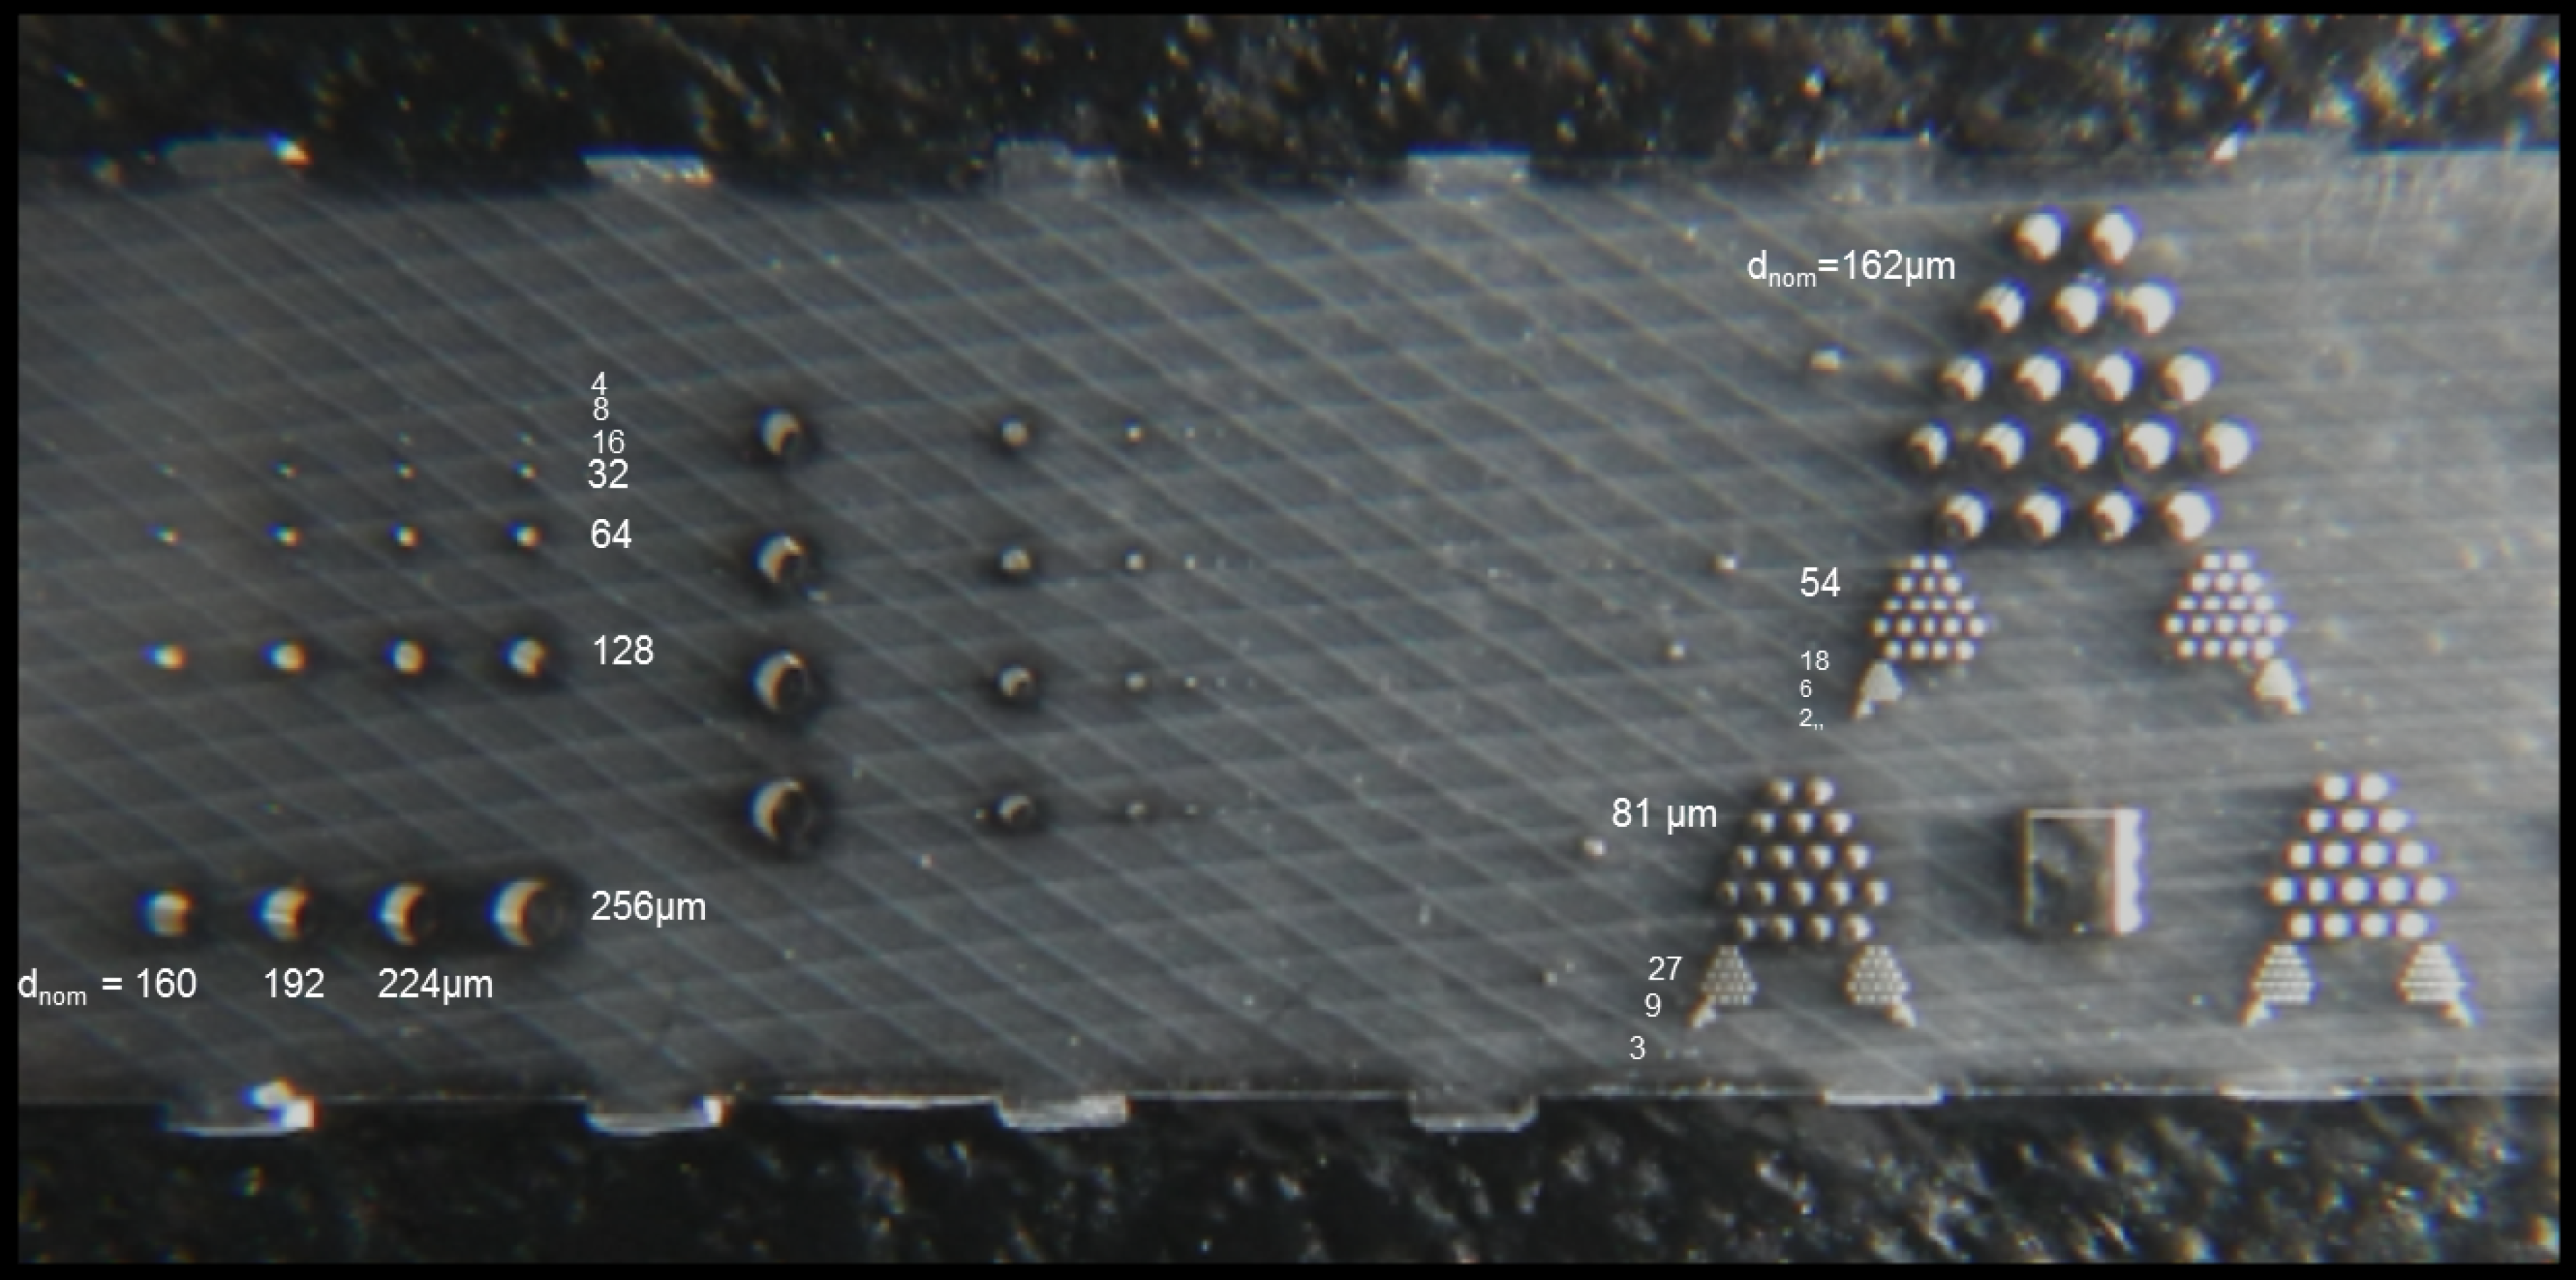
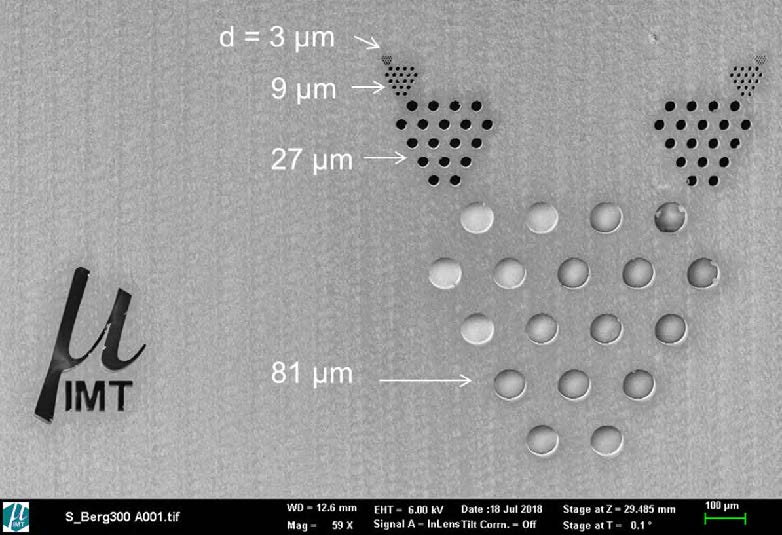
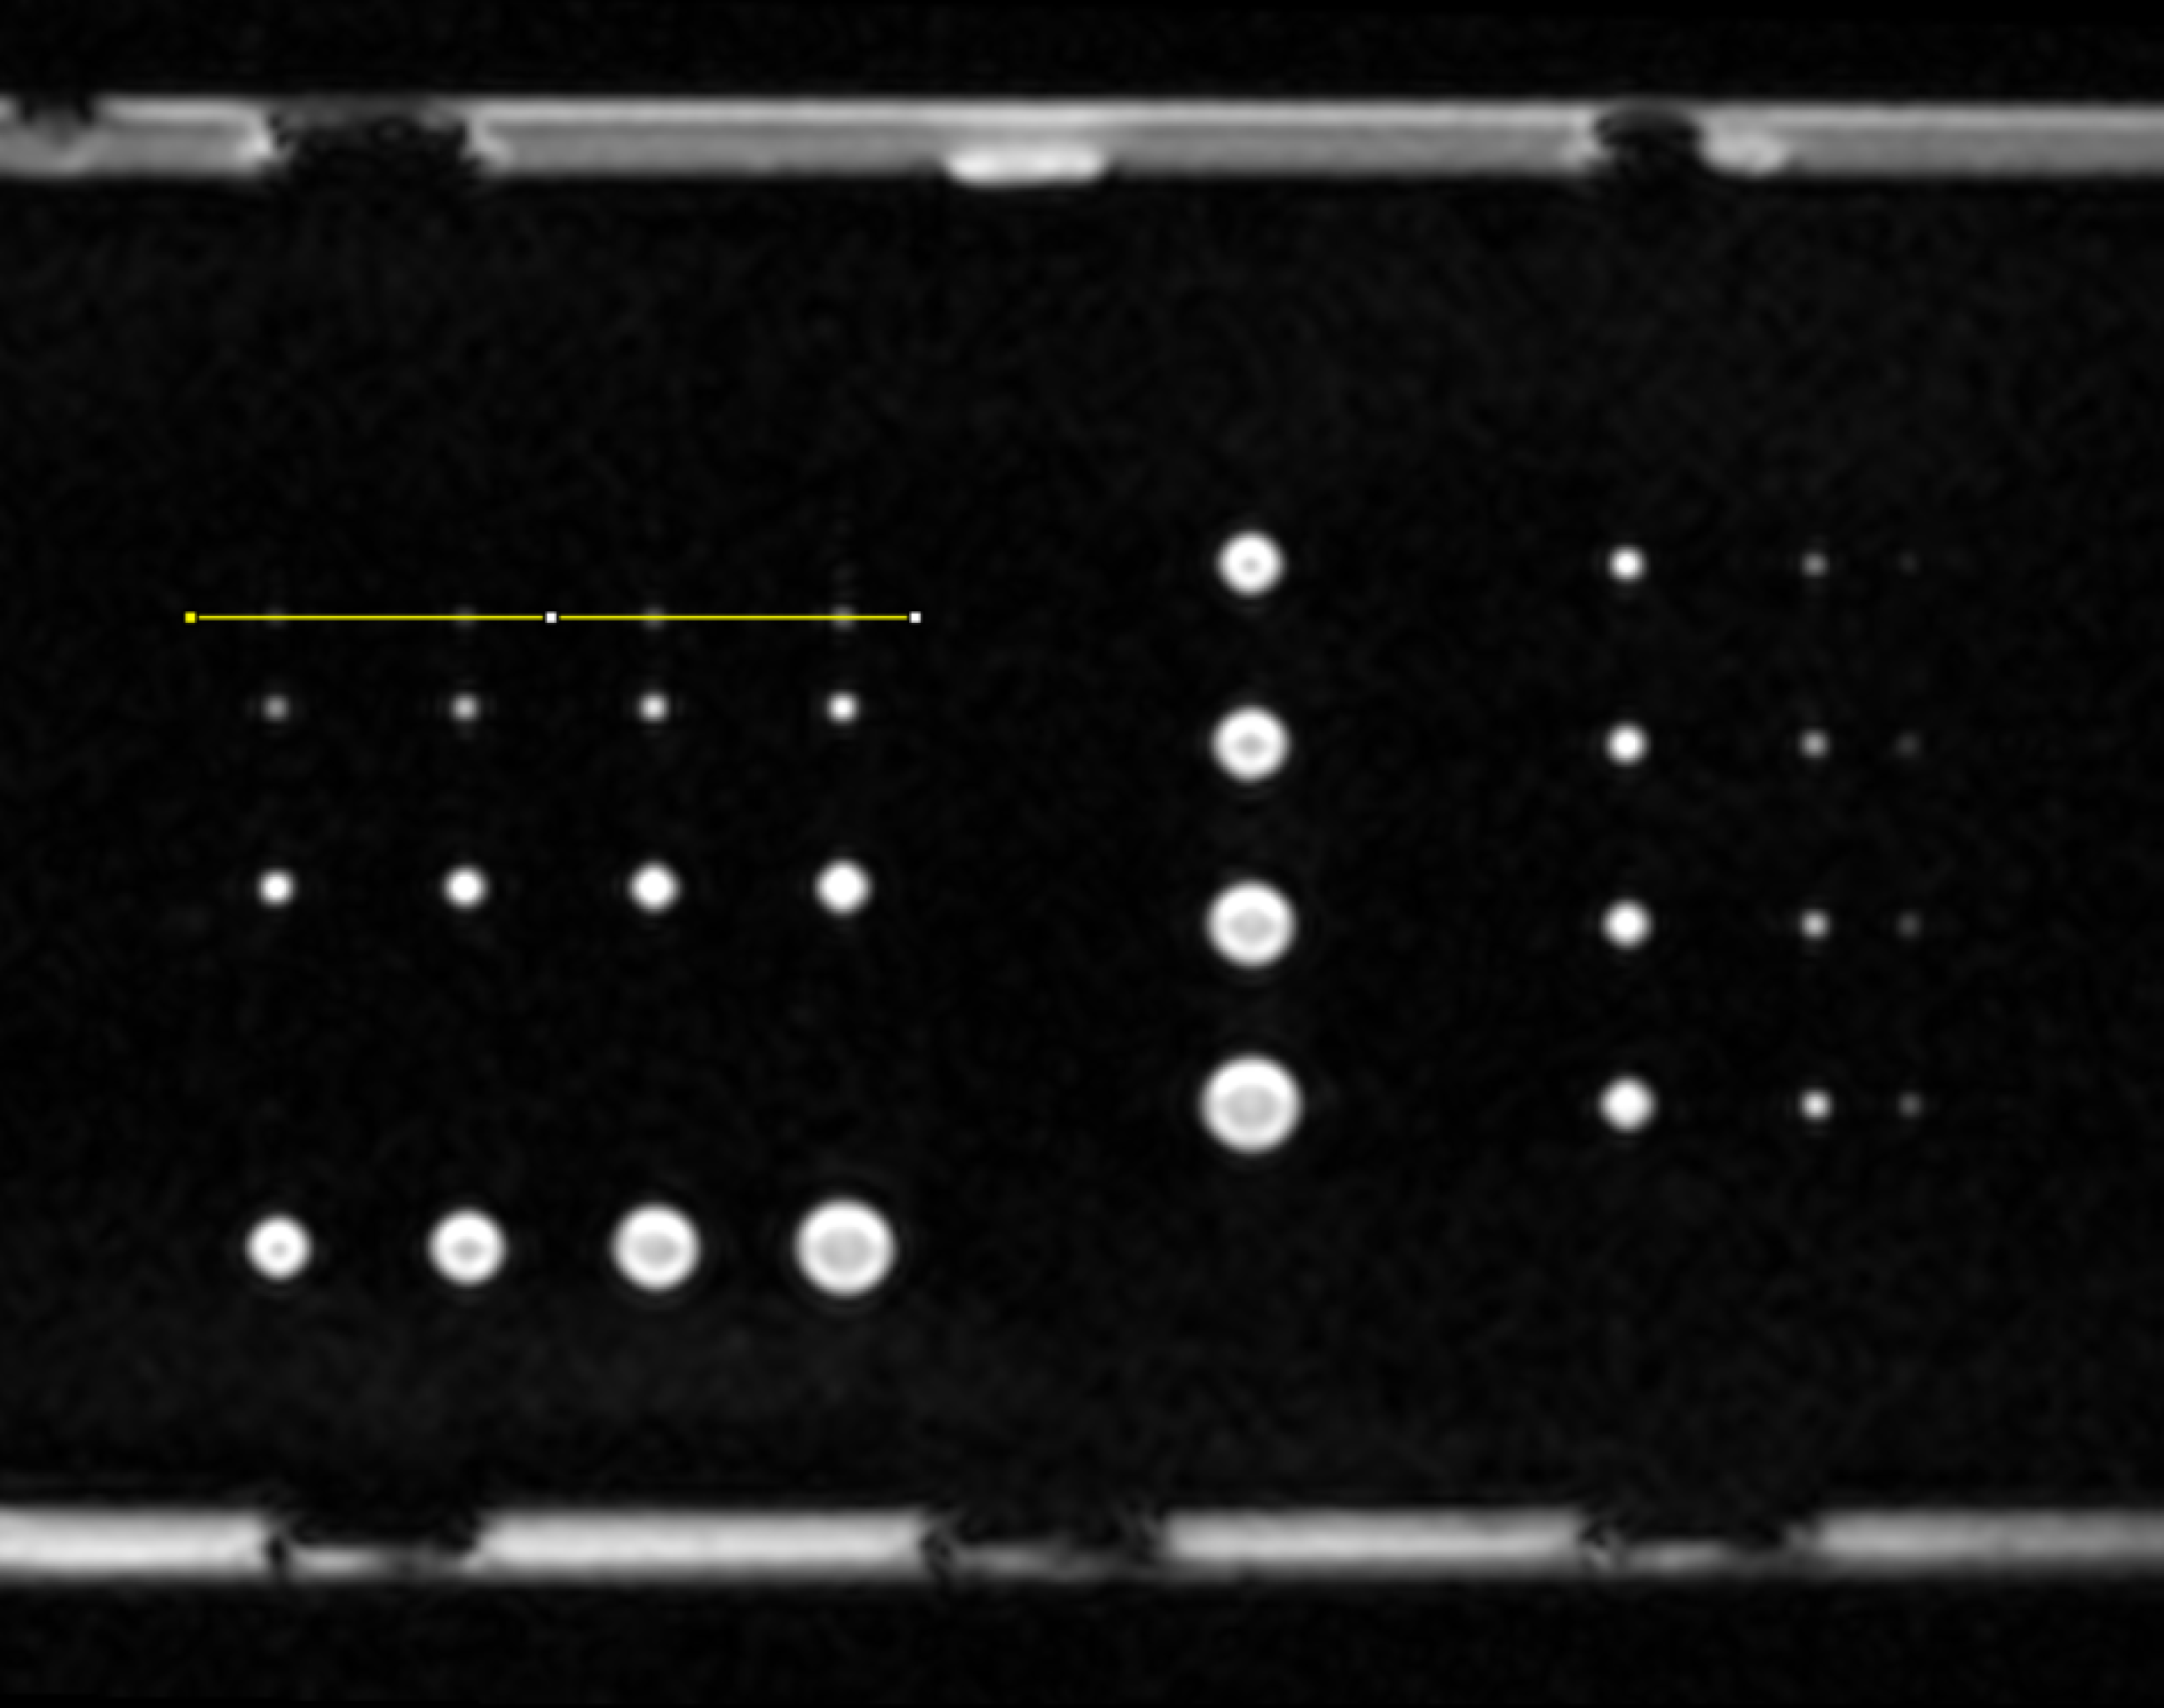
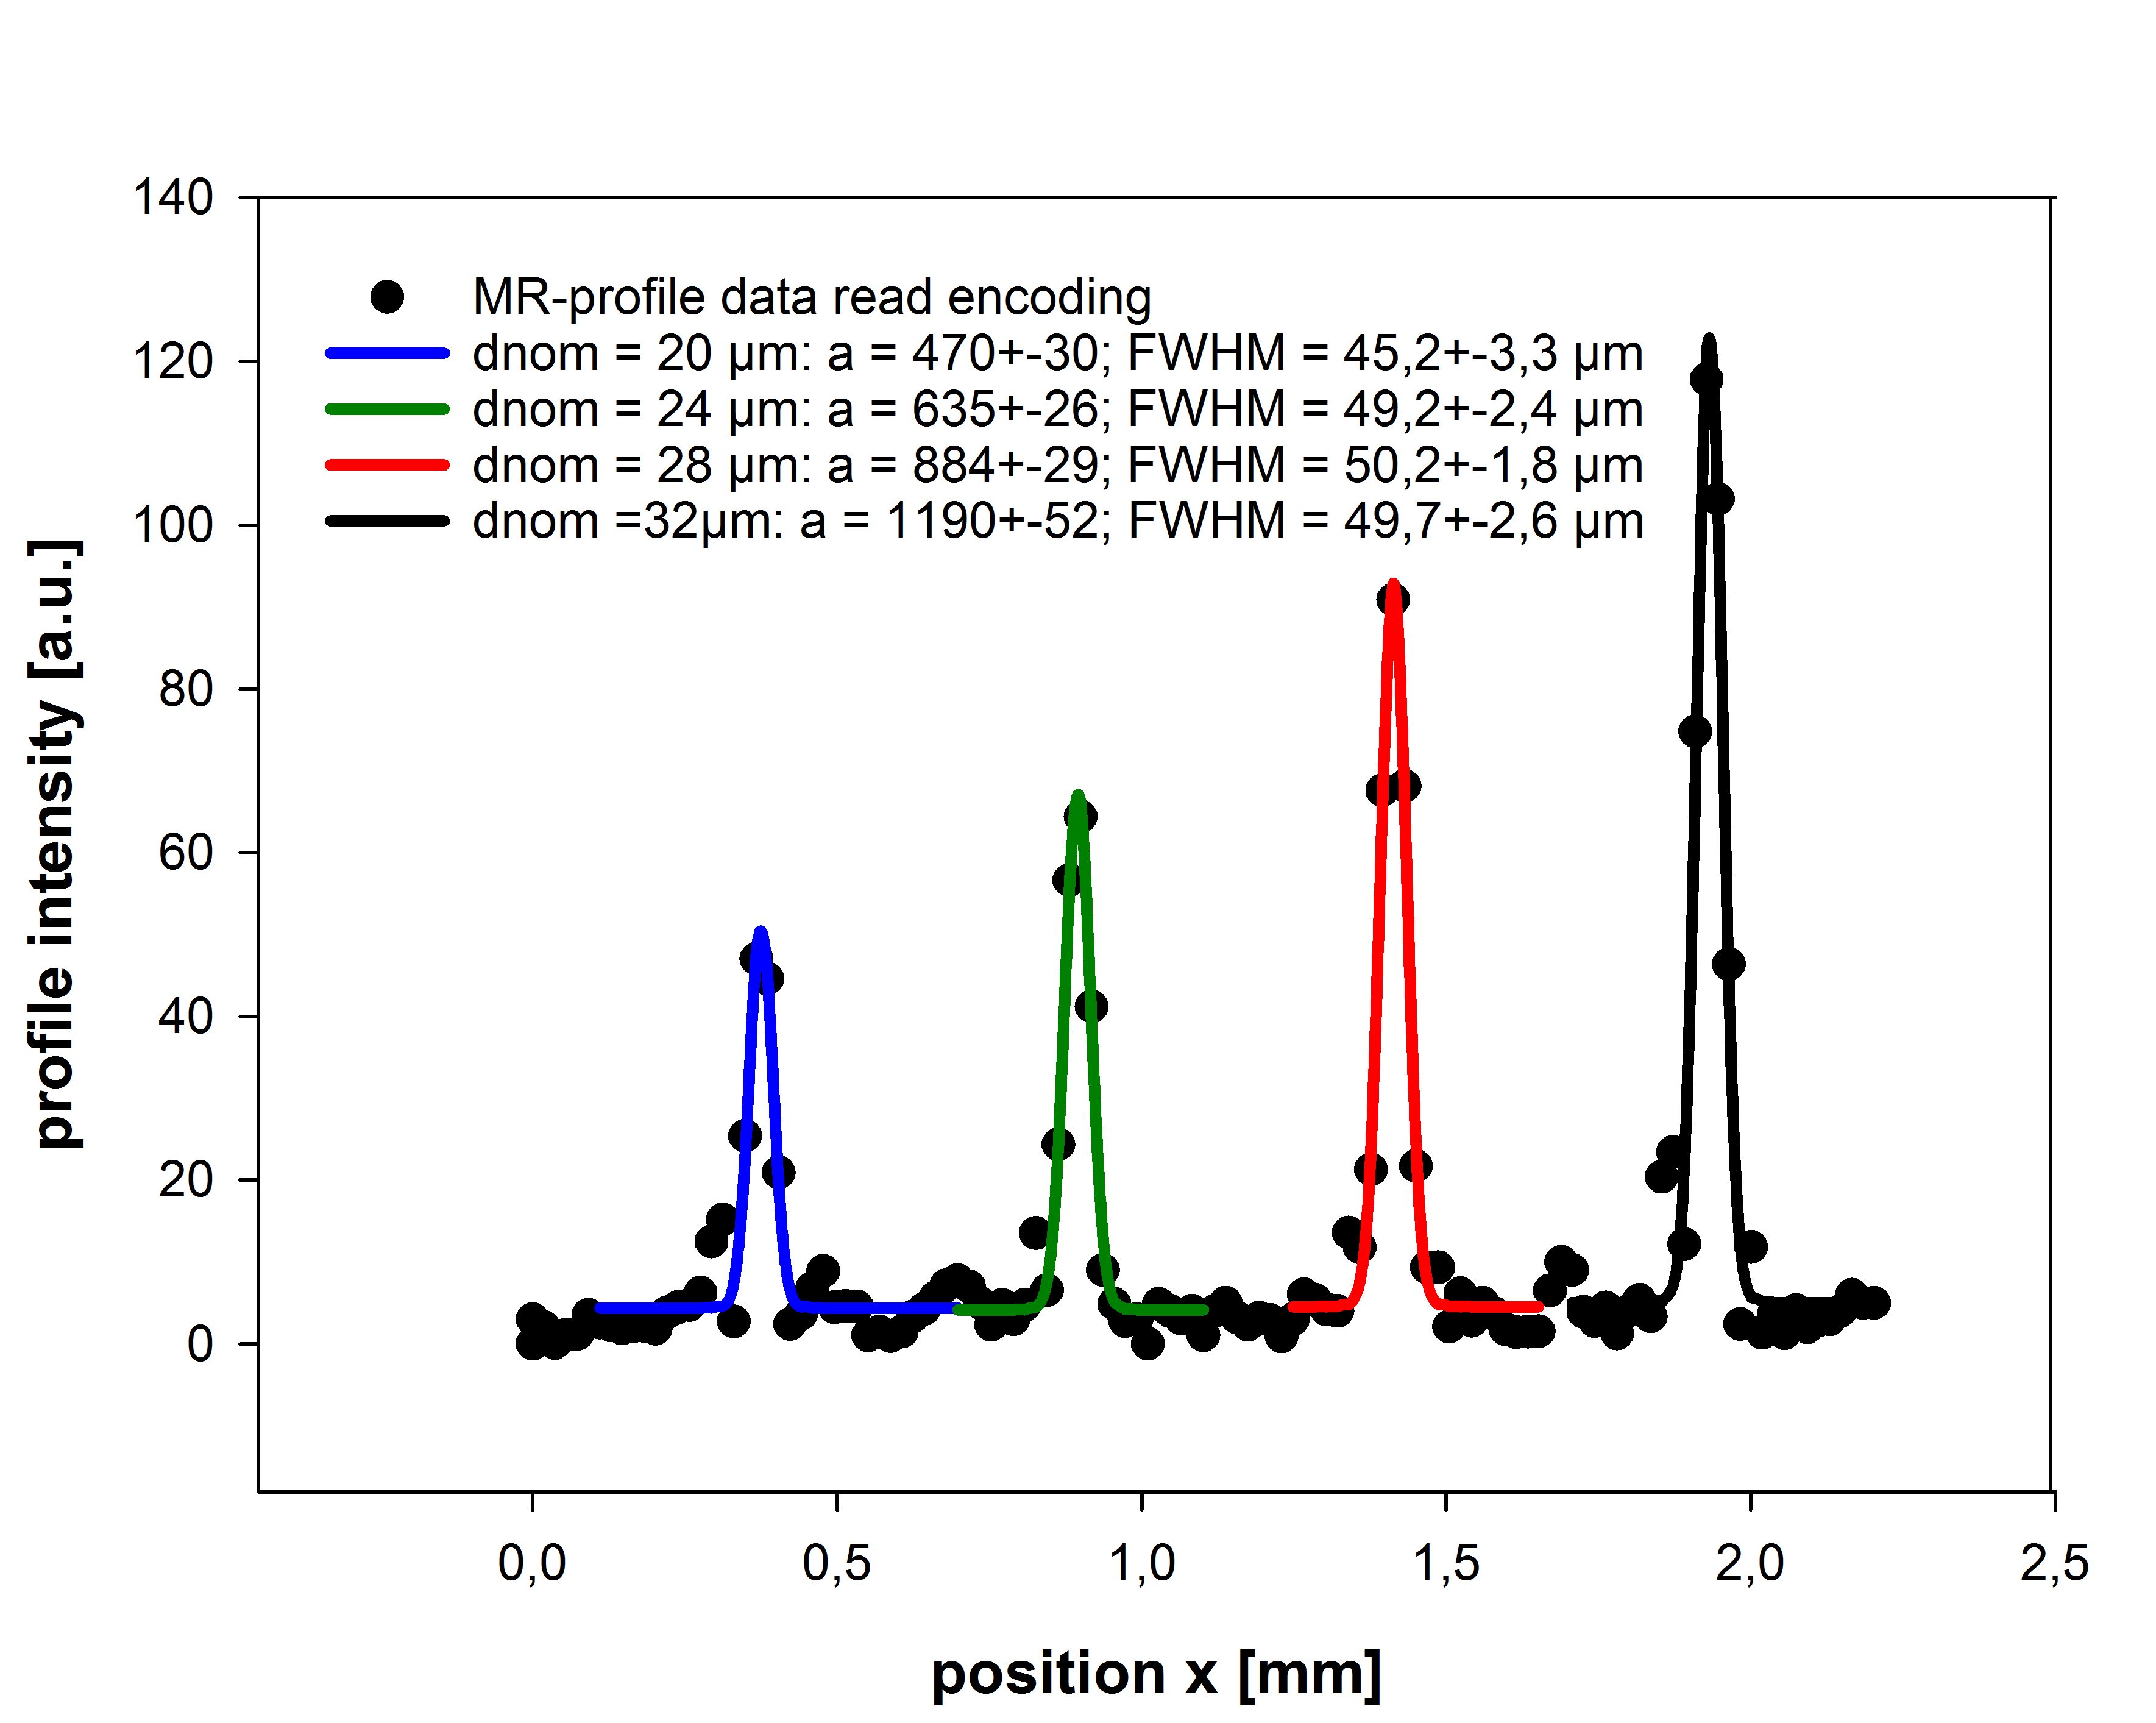
The phantom-design features a set of 36 tube-channels arranged in 4 columns, the largest tube set at d11=256, d21=224, d31=192, d41=160µm at bottom; each next row to the top features a halved diameter of the previous (fig. 1a). Prototype resolution sets could be realized using the specific advantages of Deep-X-ray Lithography5,7 (KARA, KIT, Karlsruhe/Germany). Especially the high photon-flux for strong impact on the resist and the low divergence of the synchrotron radiation represent a prerequisite for the highly anisotropic tube like structure with highest aspect-ratios. The hollow structures within the prototype PSF/MTF plate phantom were filled with an MR-active solution and MR-scanned (fig.2a) on a microscopy-insert6,7 on a human UHF MR-scanner (B=7T). An example of the PSF-evaluation procedure is shown (fig.2). Profiles crossing a row (frequency encoding) or column (phase encoding) with a series of different tubes d<pixel-size were parametrized using a Gaussian fit. The Full-Width-at-Half-Maximum (FWHM) parameter was used as a measure of the PSF.RESULTS
Two optimized final prototype resolution phantoms are shown in fig.1. As an example a coronal MR-scan of the two orthogonal tube-sets covering all 36 tubes was performed (fig.2a). The row, featuring the diameters d44=20, d34=24, d24=28 and d14=32µm, still can be visualized. Profile data, passing this row were used for obtaining the parameter FWHM as a measure of the PSF using a Gaussian-fitting regression-analysis (fig.2b). The modulation-depth a and CNR reduces with smaller tubes mainly due to the partial-volume coverage of the MR-active areas by the pixel. The obtained estimates of the PSF for the frequency-encoding-direction for the different tubes differ only slightly (48,6+-2,3µm) and within fitting errors.DISCUSSION/CONCLUSION
The conceptual design of a prototype phantom for quick qualitative and quantitative checking of the spatial resolution based on the PSF is presented. The orthogonal sets of grids were designed for slice selective MRI with anisotropic voxels with pixel-size between 256 and 1µm (i.e. for MR-micro-imaging on UHF human scanners and up to the microscopic range of best-performing MRI-animal-scanners in two independent spatial encoding directions). Prototype phantoms with a slightly adapted design using Deep-X-Ray-Lithography and Synchrotron-radiation were manufactured. The realized resolution-phantom comprises a) two orthogonal sets of 36 tubes for the measurement of the PSF for frequency- and phase-encoding at different spatial positions (isoplanatism no precondition) and b) two hexagonal tube grids for the evaluation of the MTF on one single PMMA-plate with simple MR-profile based evaluation. The application of the evaluation concept is demonstrated on an example for slice-selective 2-DFT microscopy on a human high-field MR-scanner using a micro-imaging insert with pixel size of 36x37µm2. The results on PSF (48,6+-2,3µm) show quantitatively the difference between pixel-size (ps=37µm) and actual spatial resolution defined as FWHM Gaussian-fit to the image of a smaller object (PSF). The PSF-evaluation for even smaller tubes (e.g. here d<20µm might be limited by the available SNR, which is reduced by the partial volume coverage of the smaller tubes by the pixel. Single tubes with sizes below the voxel-size can be visualized against a dark background on the cost of modulation (CNR) loss. Modern human UHF MRI-scanners approach the microscopic spatial scale with pixel-size<100µm. Standardized objects for the quantitative determination of spatial resolution in MR-microimaging and -microscopy from d=256 up to d≈4µm, as presented here, represent a prerequisite for quantitative proof and improvements of hard- and software in MR-based imaging of microscopic structural-morphologic details for establishing a non-invasive MRI-based histology.Acknowledgements
This project was supported by the KNMFi-project 2015-014-008252.References
1. Rossmann K. Point Spread-Function; Line Spread-Function and Modulation transfer function. Radiology 1969;93: 257-272.
2. European Norm EN 61223-3-7 (IEC 62B/575/CDV) 2005.08.01; Evaluation and routine testing in medical imaging Departments; Part 3-7: Acceptance and constancy tests – Determination of essential image characteristics of magnetic resonance equipment.
3. American College of Radiology; MR accreditation program; Phantom test Guidance for Use of the Small MRI Phantom (https://www.acraccreditation.org/modalities/mri: SmallPhantomGuidance.pdf (accessed 11/2021).
4. Fellner C, Muller W, Georgia J, Taubenreuther U, Fellner FA, Kalender WA. A high-resolution phantom for MRI. Magnetic Resonance Imaging 2001;19:899–904.
5. Saile V, (ed.), Wallrabe U, (ed.), Tabata O (ed.), Korvink JG (ed.). LIGA and Its Applications; in: Advanced Micro & Nanosystems 7,1; Wiley-VCH (2009) ISBN 978-3-527-31698-4.
6. Berg A, Potthast A, Starewicz P. MR-MICROSCOPY ON A HUMAN 7T-SCANNER. Proc. ISMRM, Stockholm, Sweden 2010:1048.
7. Berg A
and Börner M.Quantification of microscopic spatial resolution on MR-scanners
using micro-phantoms manufactured with Deep-X-ray Lithography based on the MTF. Proc. Int. Soc. Magn. Reson.
Med. 2020: 4267.
Figures