3859
Quantification of the impact of Gadolinium agent on amide-proton-transfer weighted MRI: an ex vivo and in vivo study
Qian Yang1, Zhou Liu1, Yin Wu2, Long Qian3, and Dehong Luo1
1National Cancer Center/National Clinical Research Center for Cancer/Cancer Hospital & Shenzhen Hospital,Chinese Academy of Medical Sciences and Peking Union Medical College, Shenzhen, China, 2Paul C. Lauterbur Research Center for Biomedical Imaging, Shenzhen Institute of Advanced Technology, Chinese Academy of Sciences, Shenzhen, China, 3MR Research, GE Healthcare, Beijing, China
1National Cancer Center/National Clinical Research Center for Cancer/Cancer Hospital & Shenzhen Hospital,Chinese Academy of Medical Sciences and Peking Union Medical College, Shenzhen, China, 2Paul C. Lauterbur Research Center for Biomedical Imaging, Shenzhen Institute of Advanced Technology, Chinese Academy of Sciences, Shenzhen, China, 3MR Research, GE Healthcare, Beijing, China
Synopsis
The clinical value of Amide proton transfer (APT) imaging in brain tumors has been intensively studied and validated. However, whether and how much Gadolinium-based (Gd) agent in clinical dosage has impact on the APT-weighted signal in clinical scenarios remains controversial. Hence, this study designed an in vitro study using a phantom with a gradient dosage of Gd-based agent and then validated the result in 6 patients with brain tumors. The result revealed that APT effect was significantly influenced by Gd contrast agent both in the phantom in vitro study and in vivo study.
Introduction:
In recent years, APT
imaging has been intensively studied and its clinical value has been
established in evaluating brain tumor, based on which FDA has approved its
commercial use in brain tumors [1-3]. With the wide clinical use,
the question was raised that whether and how much Gadolinium-based (Gd-based)
agent in clinical dosage has impact on the APT effect. In theory, the
magnetization transfer ratio asymmetry analysis (MTRasym) is T1
dependent, hence residual Gd in post-contrast imaging may affect the presence
of the CEST imaging [4]. However, two recent studies have reported
quite the contradictory results in terms of potential impact of Gd has on the
APT effect [4,5]. Hence, the purpose of this study is to verify the
possible impact of gadolinium contrast agent on amide-proton-transfer weighted
(APTw) MRI, and to quantify to what extent the contrast agents alter
the APT effect.
Materials and Methods:
A phantom was made
by mixing a gradient of 24 dosages of Gd-based contrast agent with 10 mL pure
egg white (EW) in each tube, with reference to the clinical dosage (fig.1). Six
patients with brain tumor had undergone routine clinical brain MR scan, in
which APT-weighted imaging and T1 mapping was added before and after the
administration of Gd. MRI study was performed on a 3T MR
scanner (Discovery MR 750w, General Electric Healthcare, Waukesha, WI) using a 8-channel
head and neck coil. Chemical shift-selective fat suppression and
single-shot fast spin echo (FSE) readout were used (4 radiofrequency saturation
pulses with duration of 500 ms for each pulse and without inter-pulse delay, RF
saturation power B1 of 2 μT, TR = 6189 ms with minimum TE, slice
thickness = 4 mm, field of view = 12×12 cm2, matrix size = 96×96).
In addition to an unsaturated scan, 69 CEST-weighted images with frequency
offsets of -7 to 7 ppm in 0.5 ppm increments were acquired. To correct B0
inhomogeneity, a water saturation shift referencing (WASSR) map was collected
with B1 of 0.5 μT (frequency offsets including ±240, ±192, ±144,
±96, ±48 and 0 Hz). On an in-house MATLAB platform, APT values were calculated and measured
for each tube of the phantom, and different regions of interest (ROIs) of the
brain, including peripheral edema, tumor area, white matter (WM) and gray
matter (GM). Similarity between the pre-contrast and post-contrast APT map was
quantified using cosine similarity. Paired student t-test was used to evaluate
the pixel-wise difference in the APT values between the same ROI of
pre-contrast and post-contrast APT maps.
Results and Discussions:
The
results of ex vivo experiment show that the three scans have a high consistency
(ICC = 0.998), suggesting the satisfactory reproducibility of APT sequence in
our study. Along with the increase of the MRI contrast agent concentration, the
average APT value of each tube in the phantom shows a downward trend. When the
added Gd content is less than 1 μL, the average value of APT remains relatively
stable and fluctuates around 12% (ranging from 11.61% to 13.42%) (fig.2). However, when the Gd content added exceeds 1 μL, the APT
value of the egg white considerably dropped. Until the added Gd content reaches
about 20 μL, the decline rate of APT value gradually stabilizes and maintains
at about 2% (ranging from 1.88% to 2.13%) (fig.3). Therefore, the in vitro experiment demonstrated the definite impact of
Gd on APT effect that the APT signal dropped along with the increased
concentration of Gd. As reported, the asymmetry analysis of the magnetization
transfer ratio is closely related to the T1 effect[4,6], and the T1 relaxation
time of the tissue is shortened after the injection of Gd, both of which might
explain the clear impact of Gd on APT asymmetry signal.
The results of in
vivo experiments showed that for the entire brain tissue (n = 6), brain gray
matter and white matter (n = 5) and enhanced tumor lesions (n = 7) (fig.4), the
pixel-wise APT value of each corresponding ROI showed significant changes (P
< 0.05) between before and after the contrast agent enhancement. For
non-enhanced tumor lesions (n = 3), the APT value did not change significantly
(P > 0.05) between before and after enhancement. In the edema area
surrounding the tumor lesion (n = 2), compared with the counterpart before
enhancement, the APT value was significantly reduced after enhancement (P < 0.05)
(fig.5). The results of this study showed that the
APT value of the tumor lesions with enhancement has significant changes, while
most of the non-enhanced areas of the tumor have no significant changes. This
finding is consistent with the result of in vitro study that Gd could have an
obvious impact on APT signal by considerably shorten the T1 relaxation time in
tumor tissue.
Conclusion: Both in vitro phantom study and in vivo study
demonstrated the significant impact of Gd-based contrast agent on APT effect,
especially for highly enhanced brain tumor, suggesting that it should be
avoided to perform APT weighted imaging after contrast enhanced imaging in
clinical setting.
Acknowledgements
No acknowledgement found.References
1. Su C , Zhao L , Li S , et al. Amid proton transfer (APT) and magnetization transfer (MT) MRI contrasts provide complimentary assessment of brain tumors similarly to proton magnetic resonance spectroscopy imaging (MRSI)[J]. European Radiology, 2018. 2. Sotirios B , Demetriou E , Topriceanu C C , et al. The role of APT imaging in gliomas grading: A Systematic Review and Meta-Analysis[J]. European Journal of Radiology, 2020, 133. 3. Kamimura K , Nakajo M , Yoneyama T , et al. Histogram analysis of amide proton transfer–weighted imaging: comparison of glioblastoma and solitary brain metastasis in enhancing tumors and peritumoral regions[J]. European Radiology, 2019. 4. Tee Y K , Donahue M J , Harston G W J , et al. Quantification of amide proton transfer effect pre- and post-gadolinium contrast agent administration.[J]. Journal of Magnetic Resonance Imaging, 2015, 40(4):832-838. 5. Torrealdea F, Hearle J, Evans V, et al. APT -CEST post Gadolinium. Should it be avoided? Comparison of pre- & post-Gadolinium CEST on glioma at 3T. ISMRM,2018. 6. JONES R A, HARALDSETH O, SCHJOTT J, et al. Effect of Gd-DTPA-BMA on magnetization transfer: application to rapid imaging of cardiac ischemia [J]. J Magn Reson Imaging, 1993, 3(1): 31-9.Figures
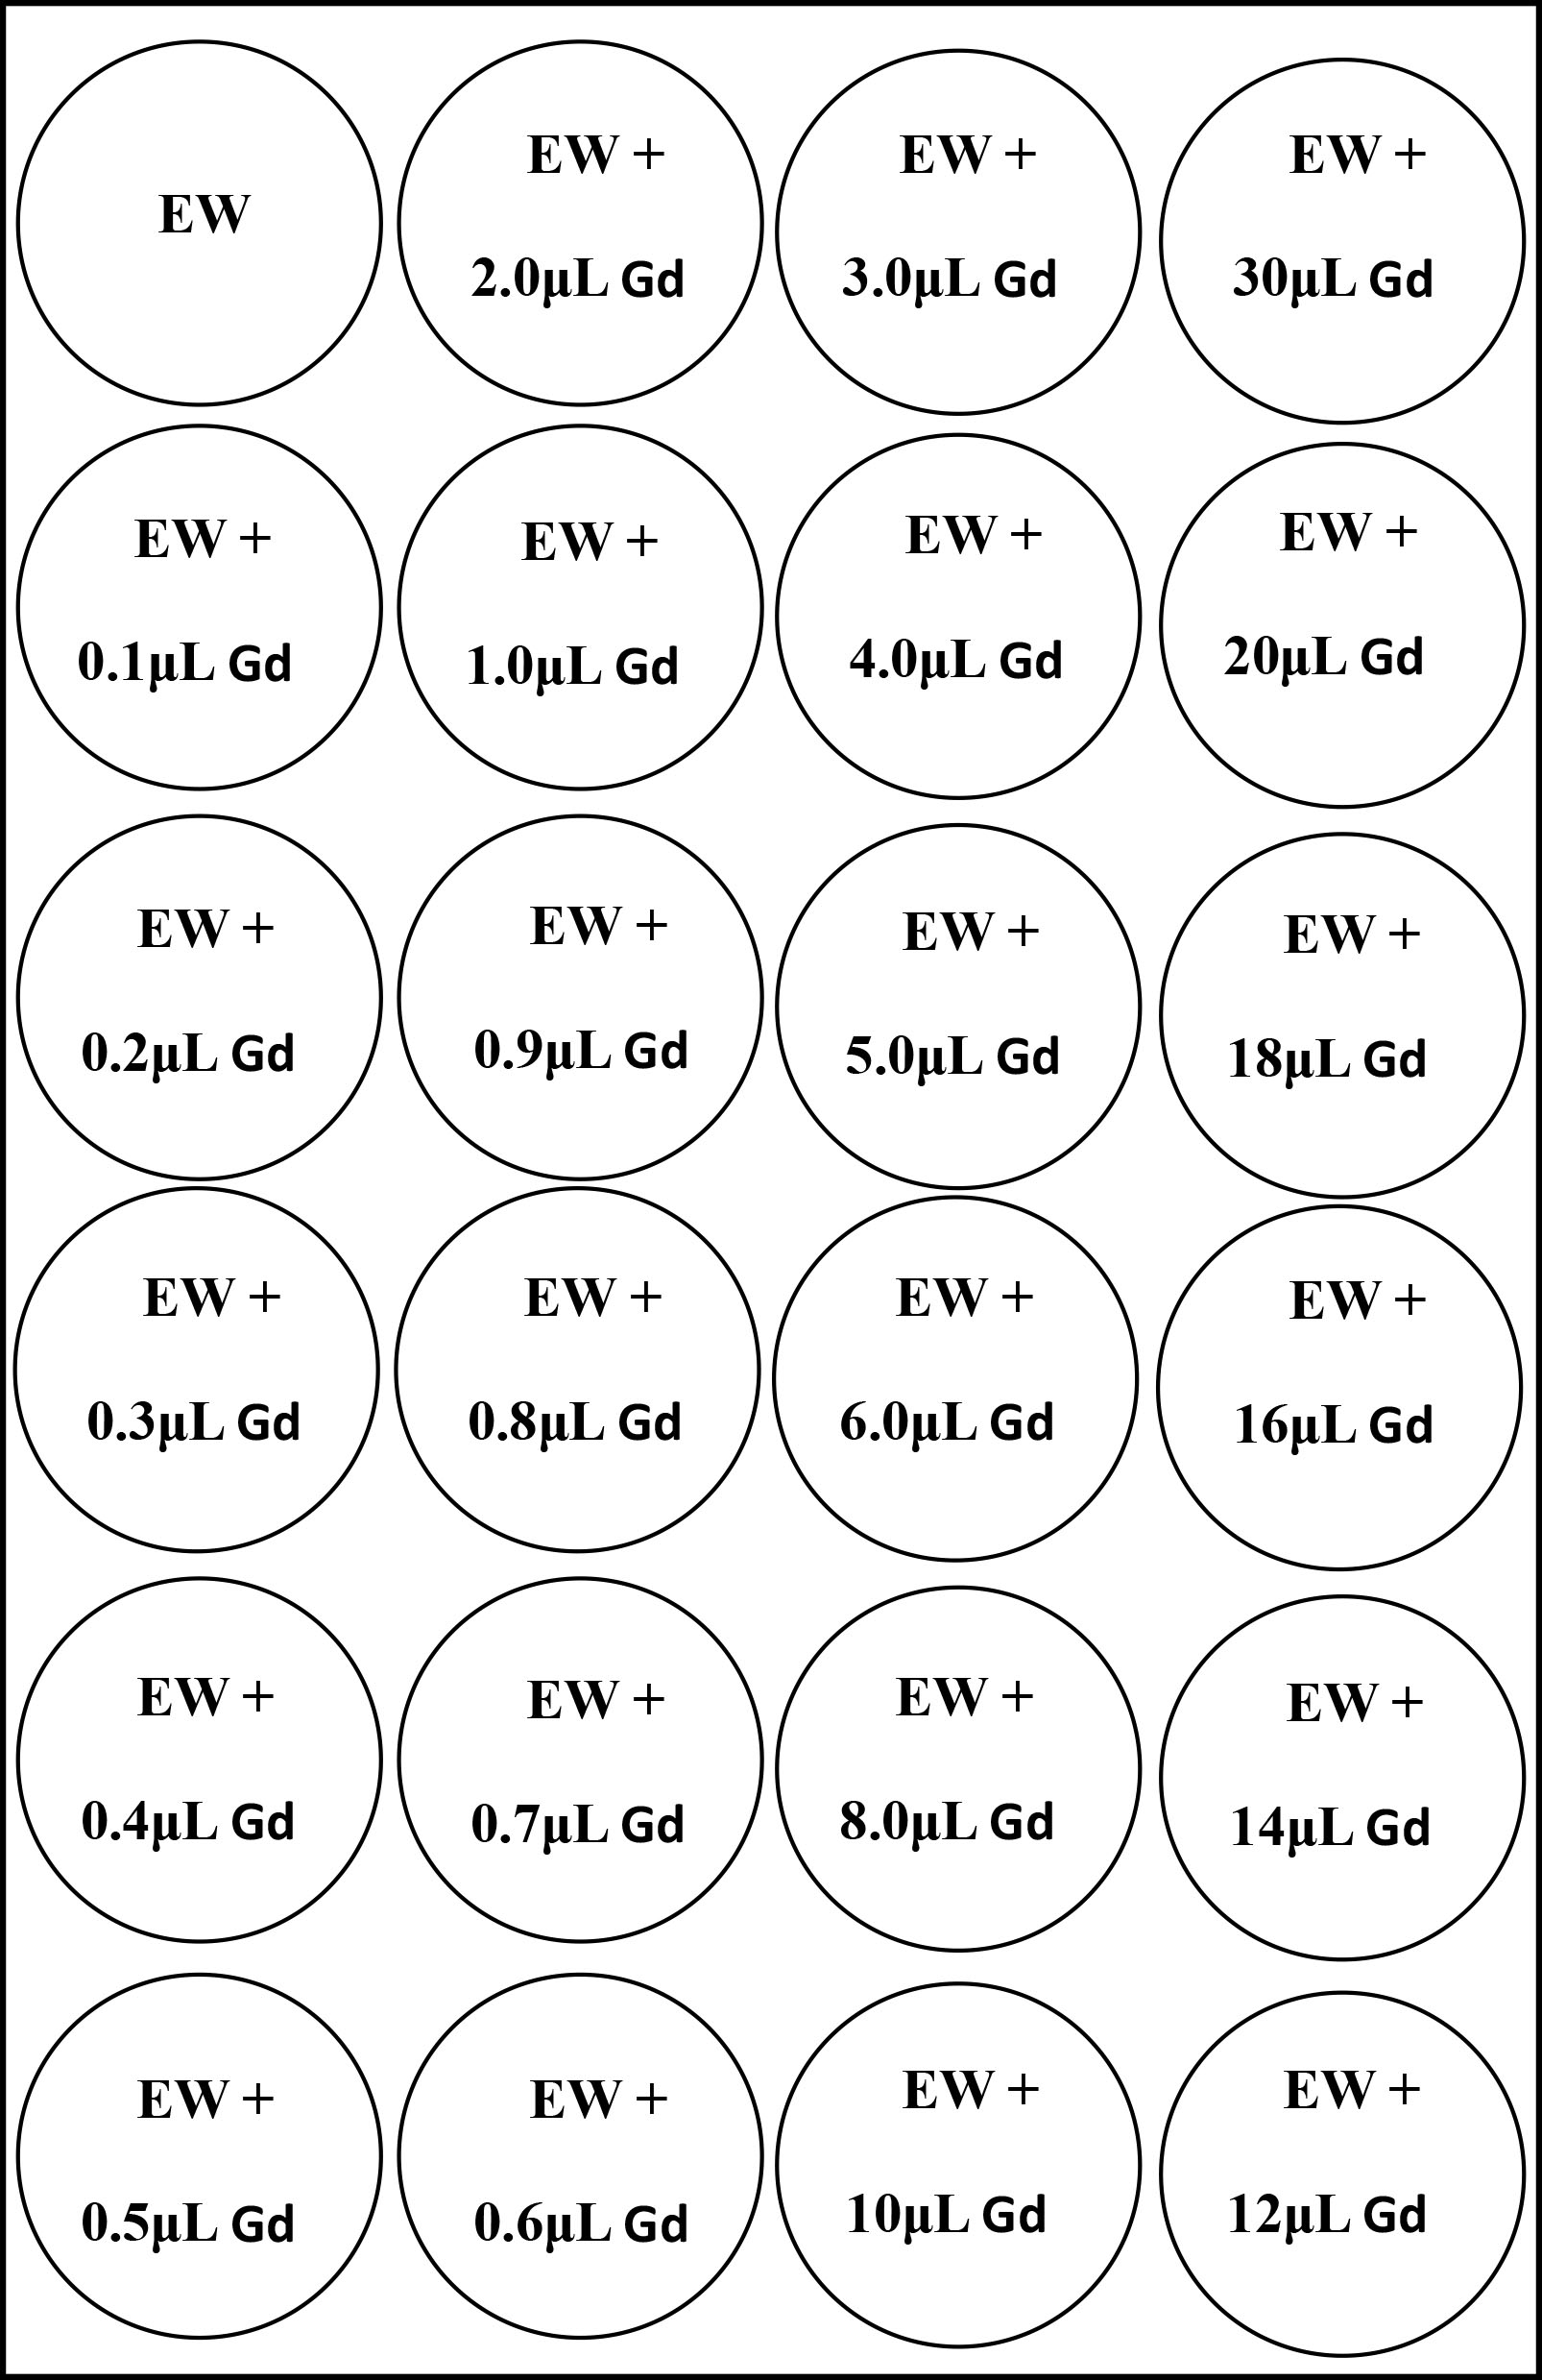
Figure 1: phantom design
EW: egg white, Gd: Gadolinium-based contrast agent
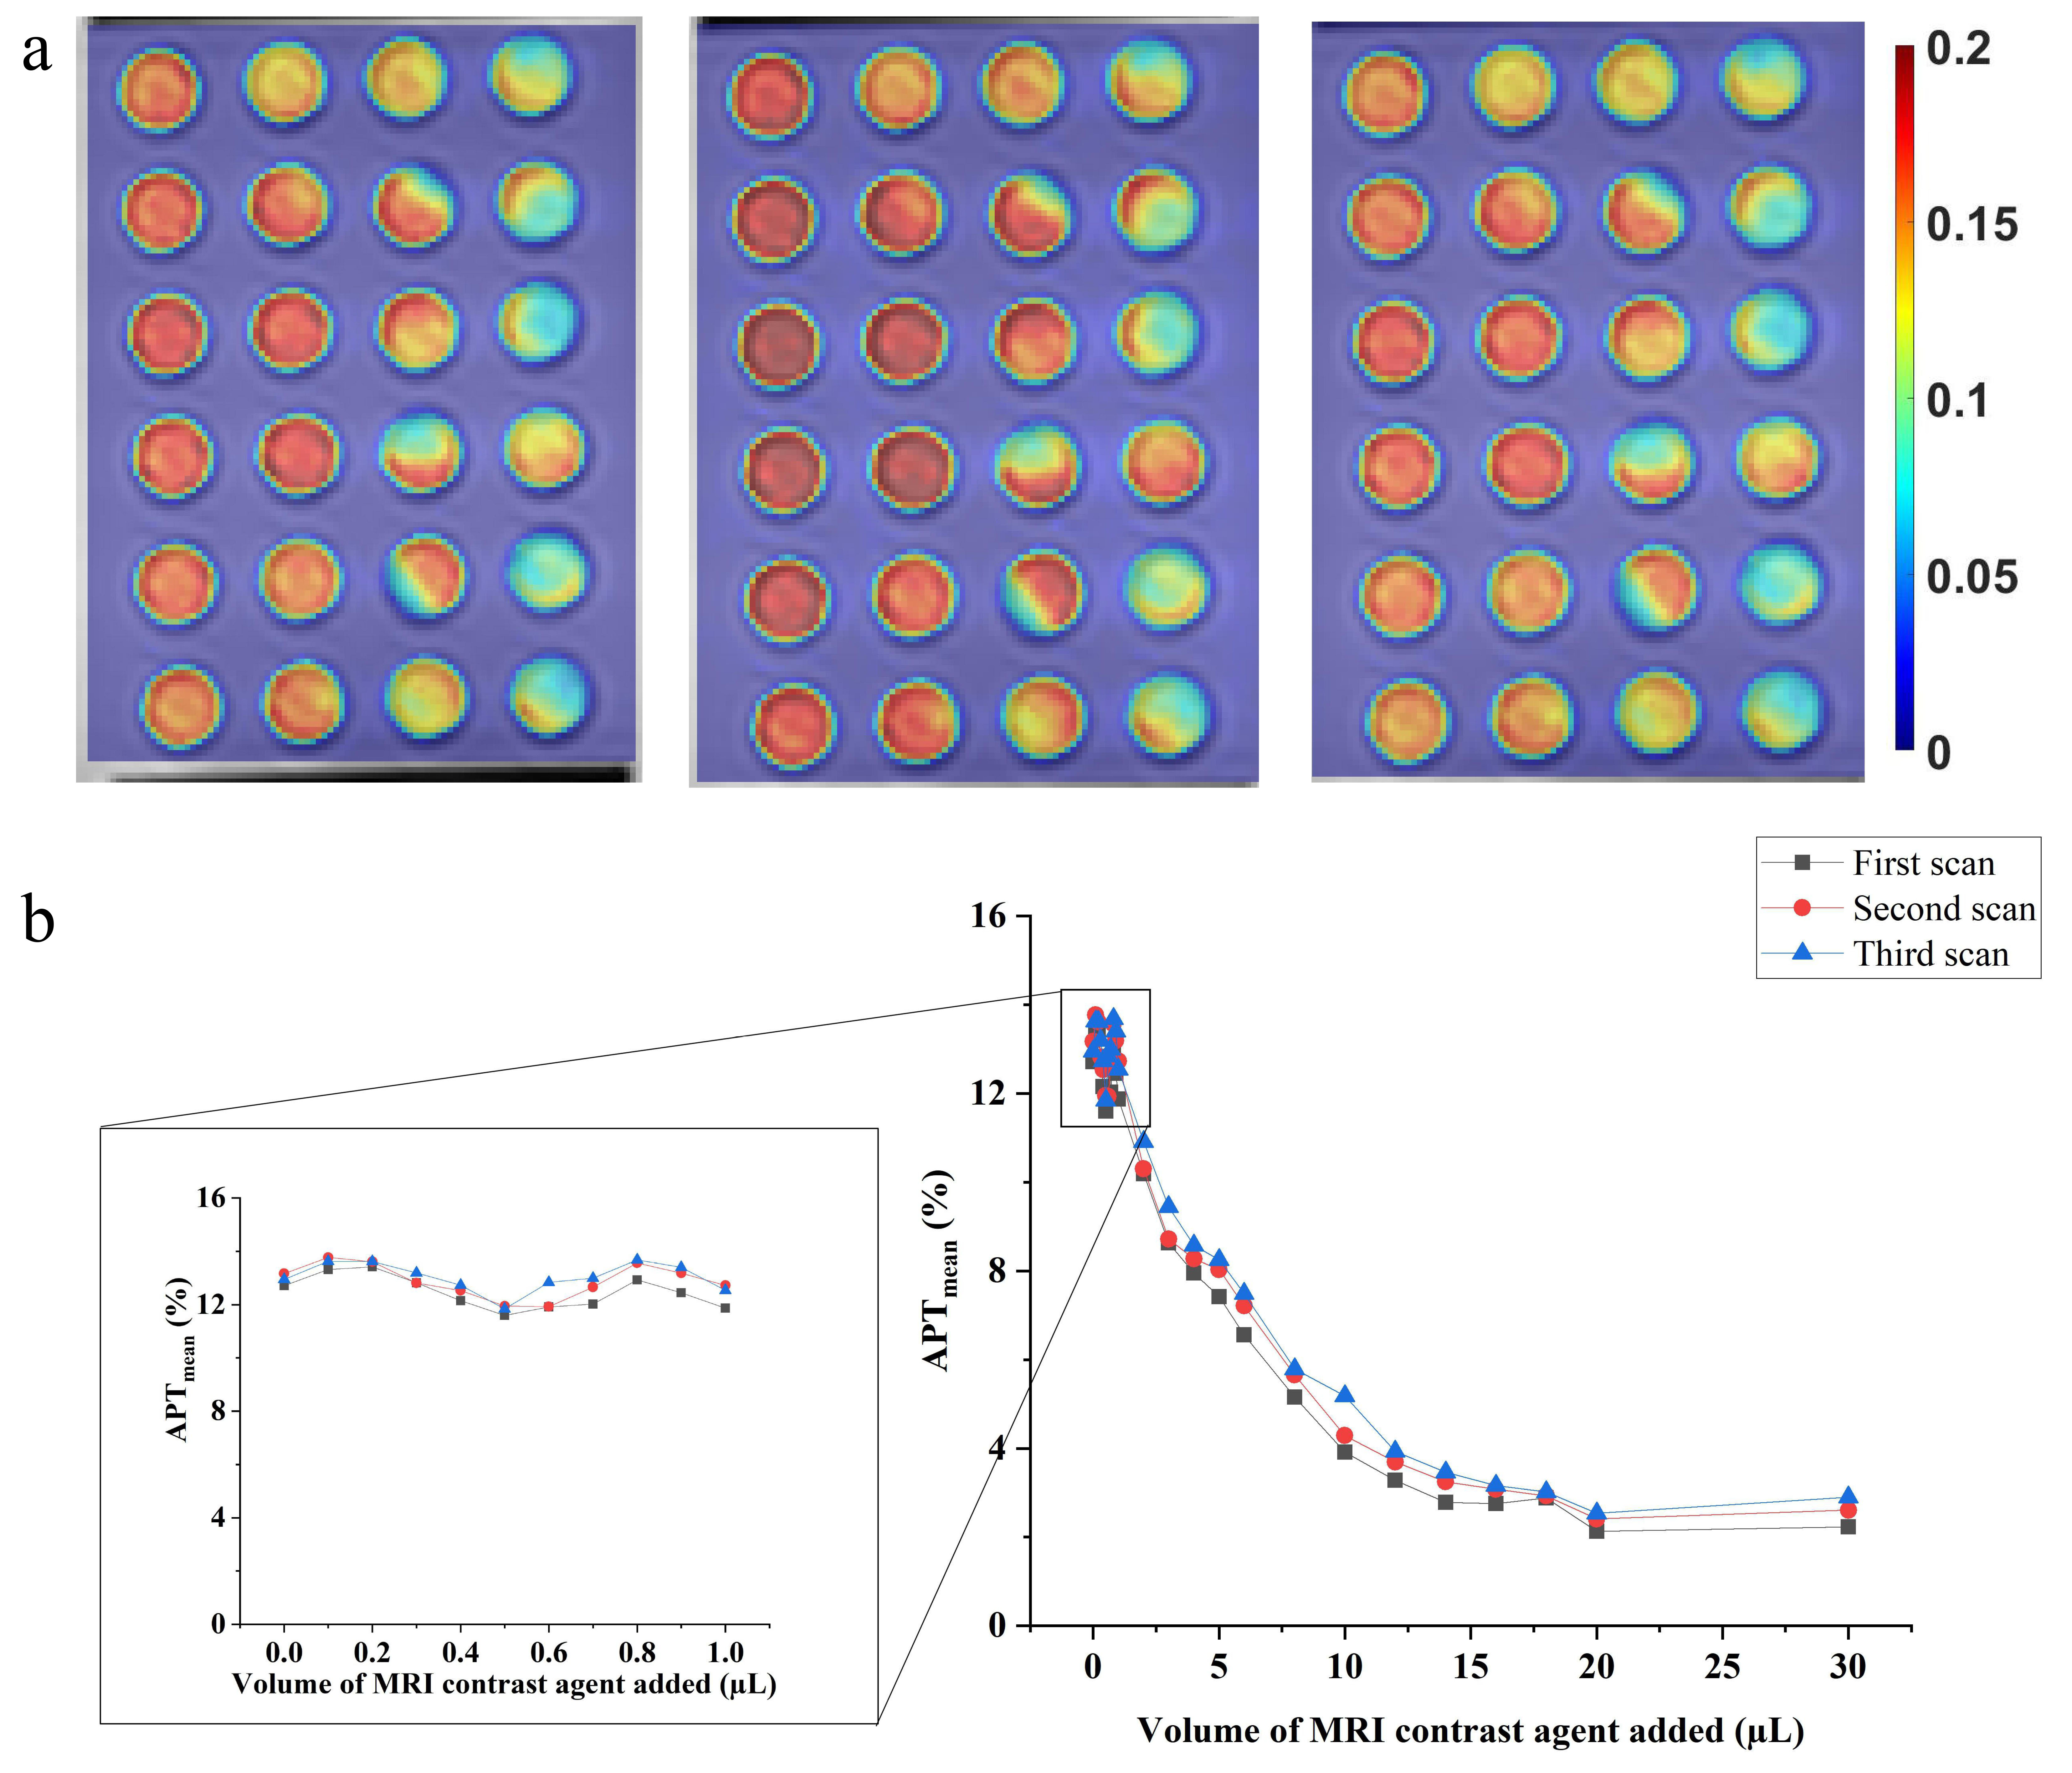
Figure 2: APT map of three consecutive scans
of the phantom (a) and APT signal change along with the incremental addition of
Gd (b)
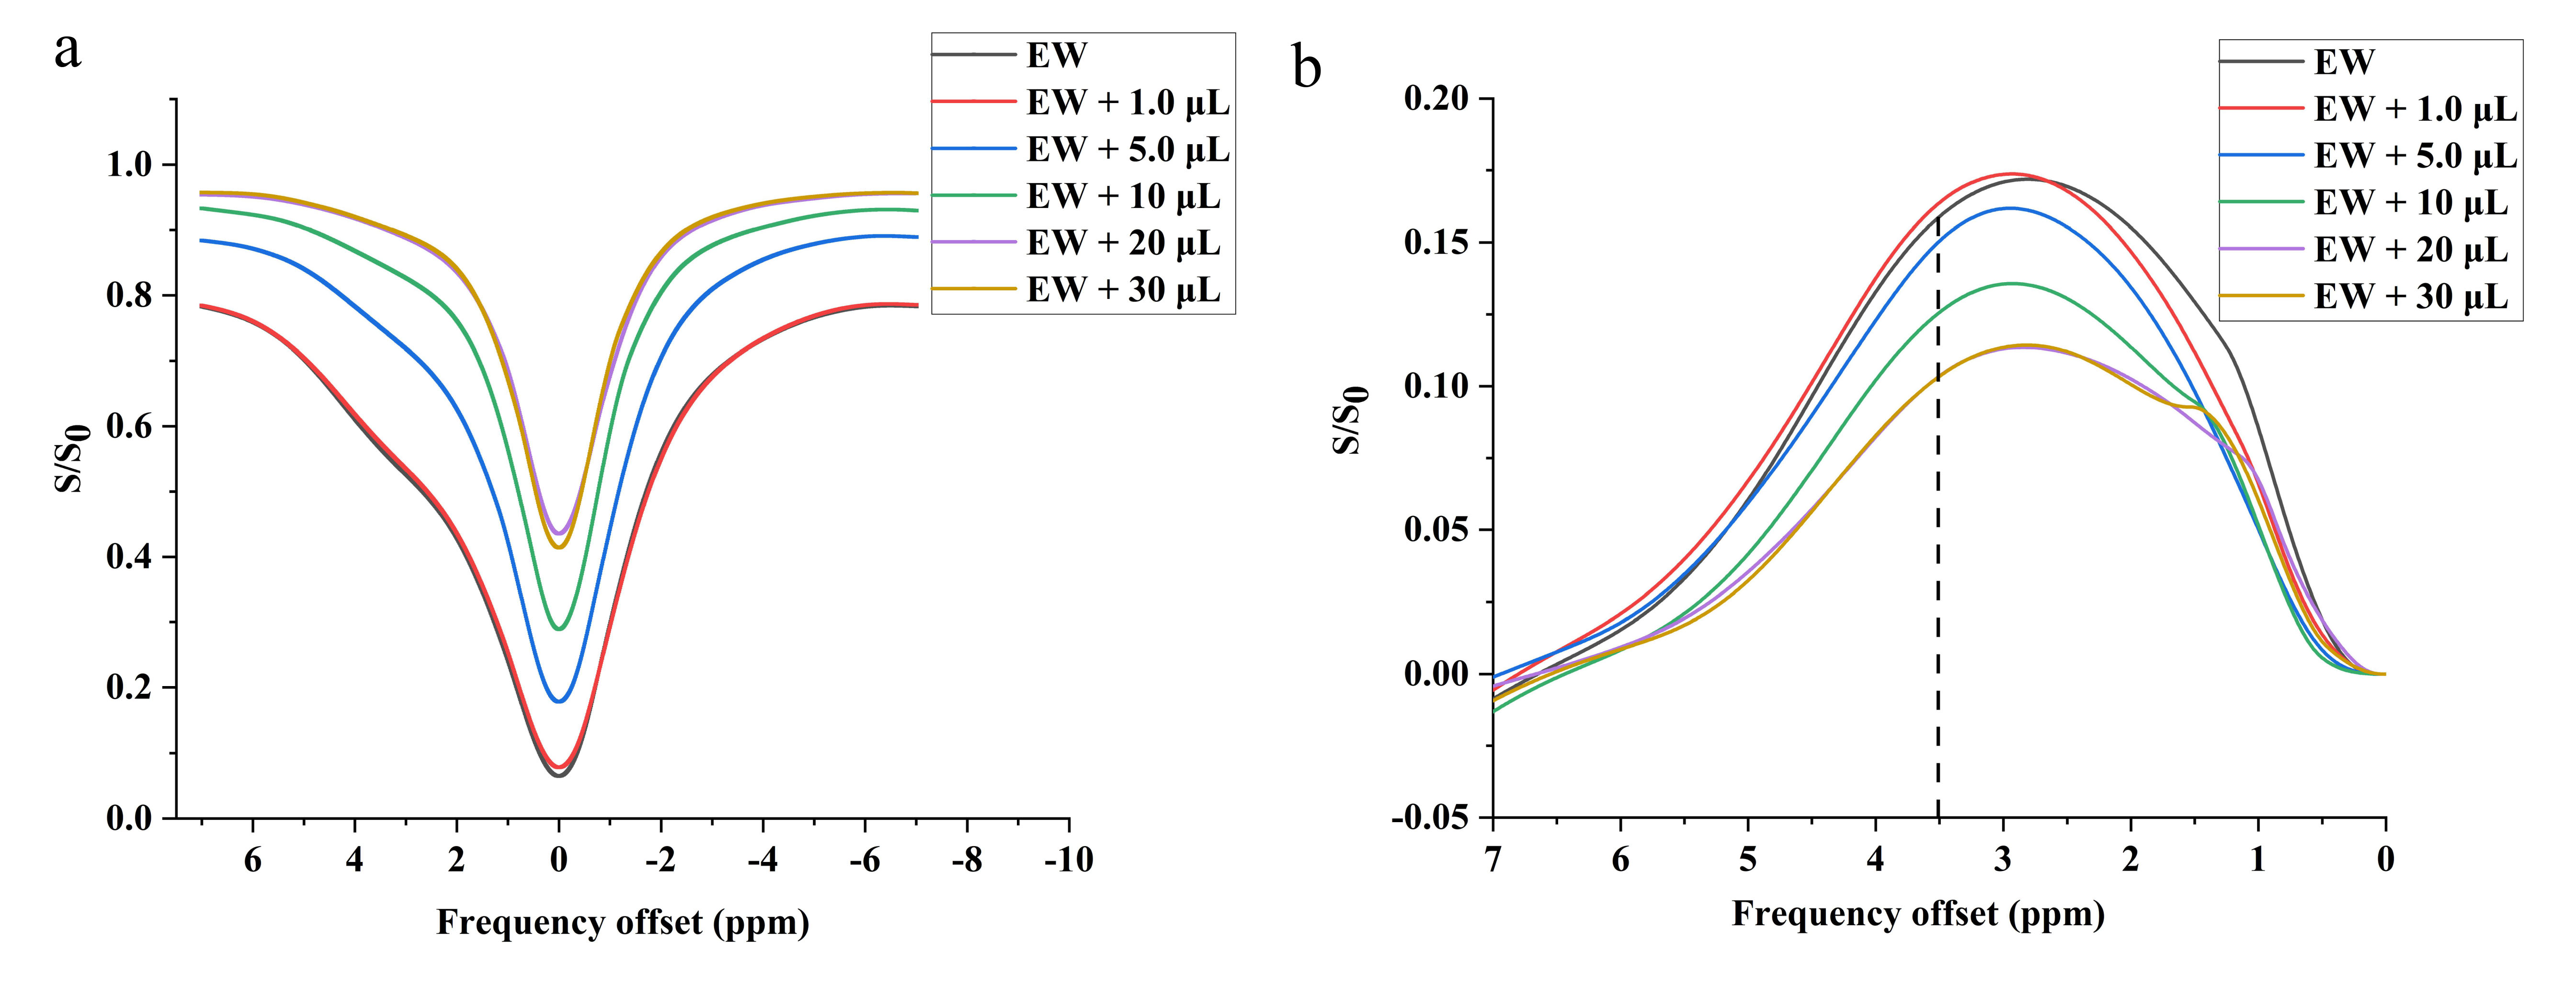
Figure 3: Z-spectrum spectrum of the egg white phantom with
different concentrations of Gd (a), and corresponding magnetic transfer ratio
asymmetry analysis (b)
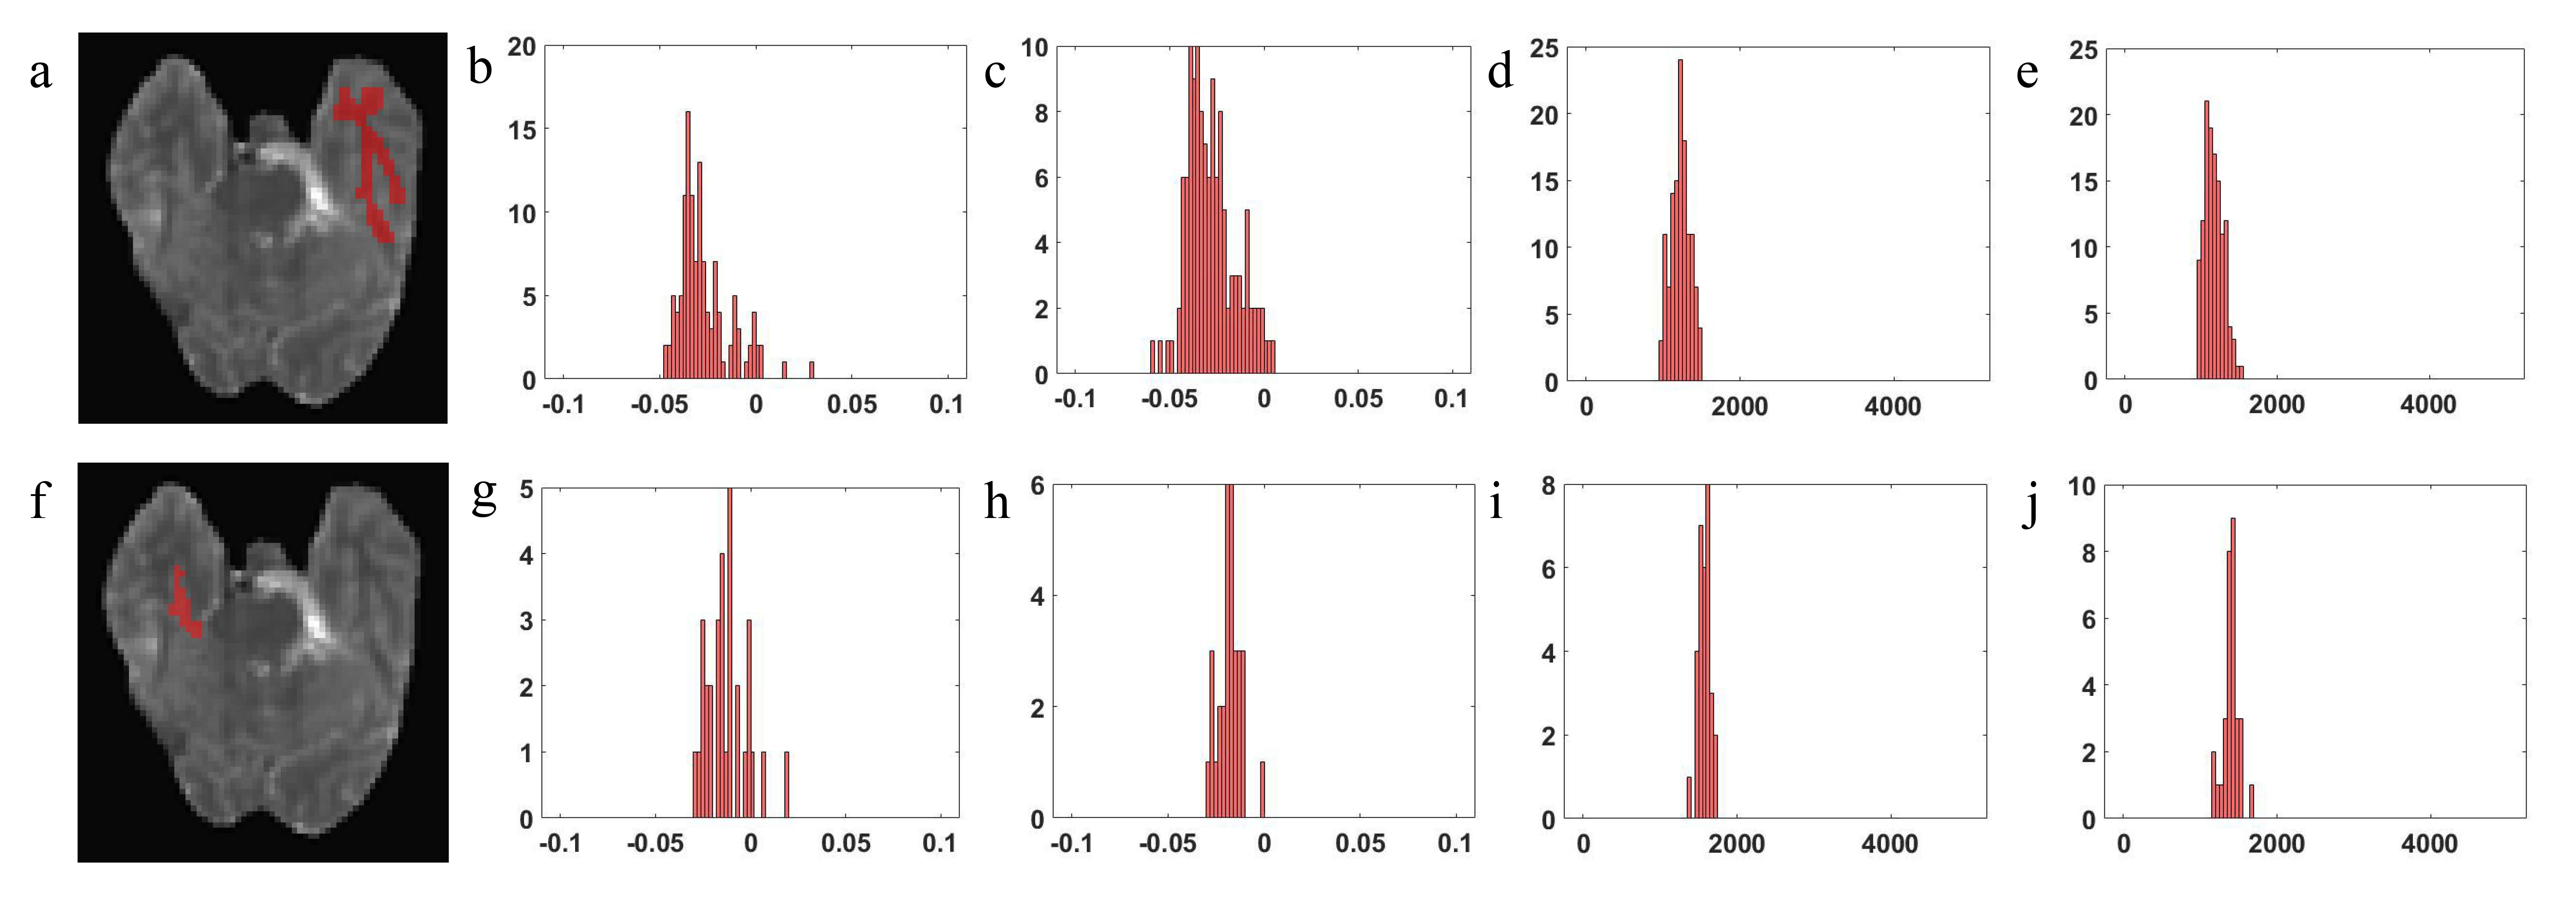
Figure 4: T1 map with manually segmented white matter (a), and corresponding
histogram of APT signal before (b) and after enhancement (c), and corresponding
histogram of T1 map before (d) and after enhancement (e). T1 map with manually
segmented gray matter (f), and corresponding histogram of APT signal before (g)
and after enhancement (h), and corresponding histogram of T1 map before (i) and
after enhancement (j)
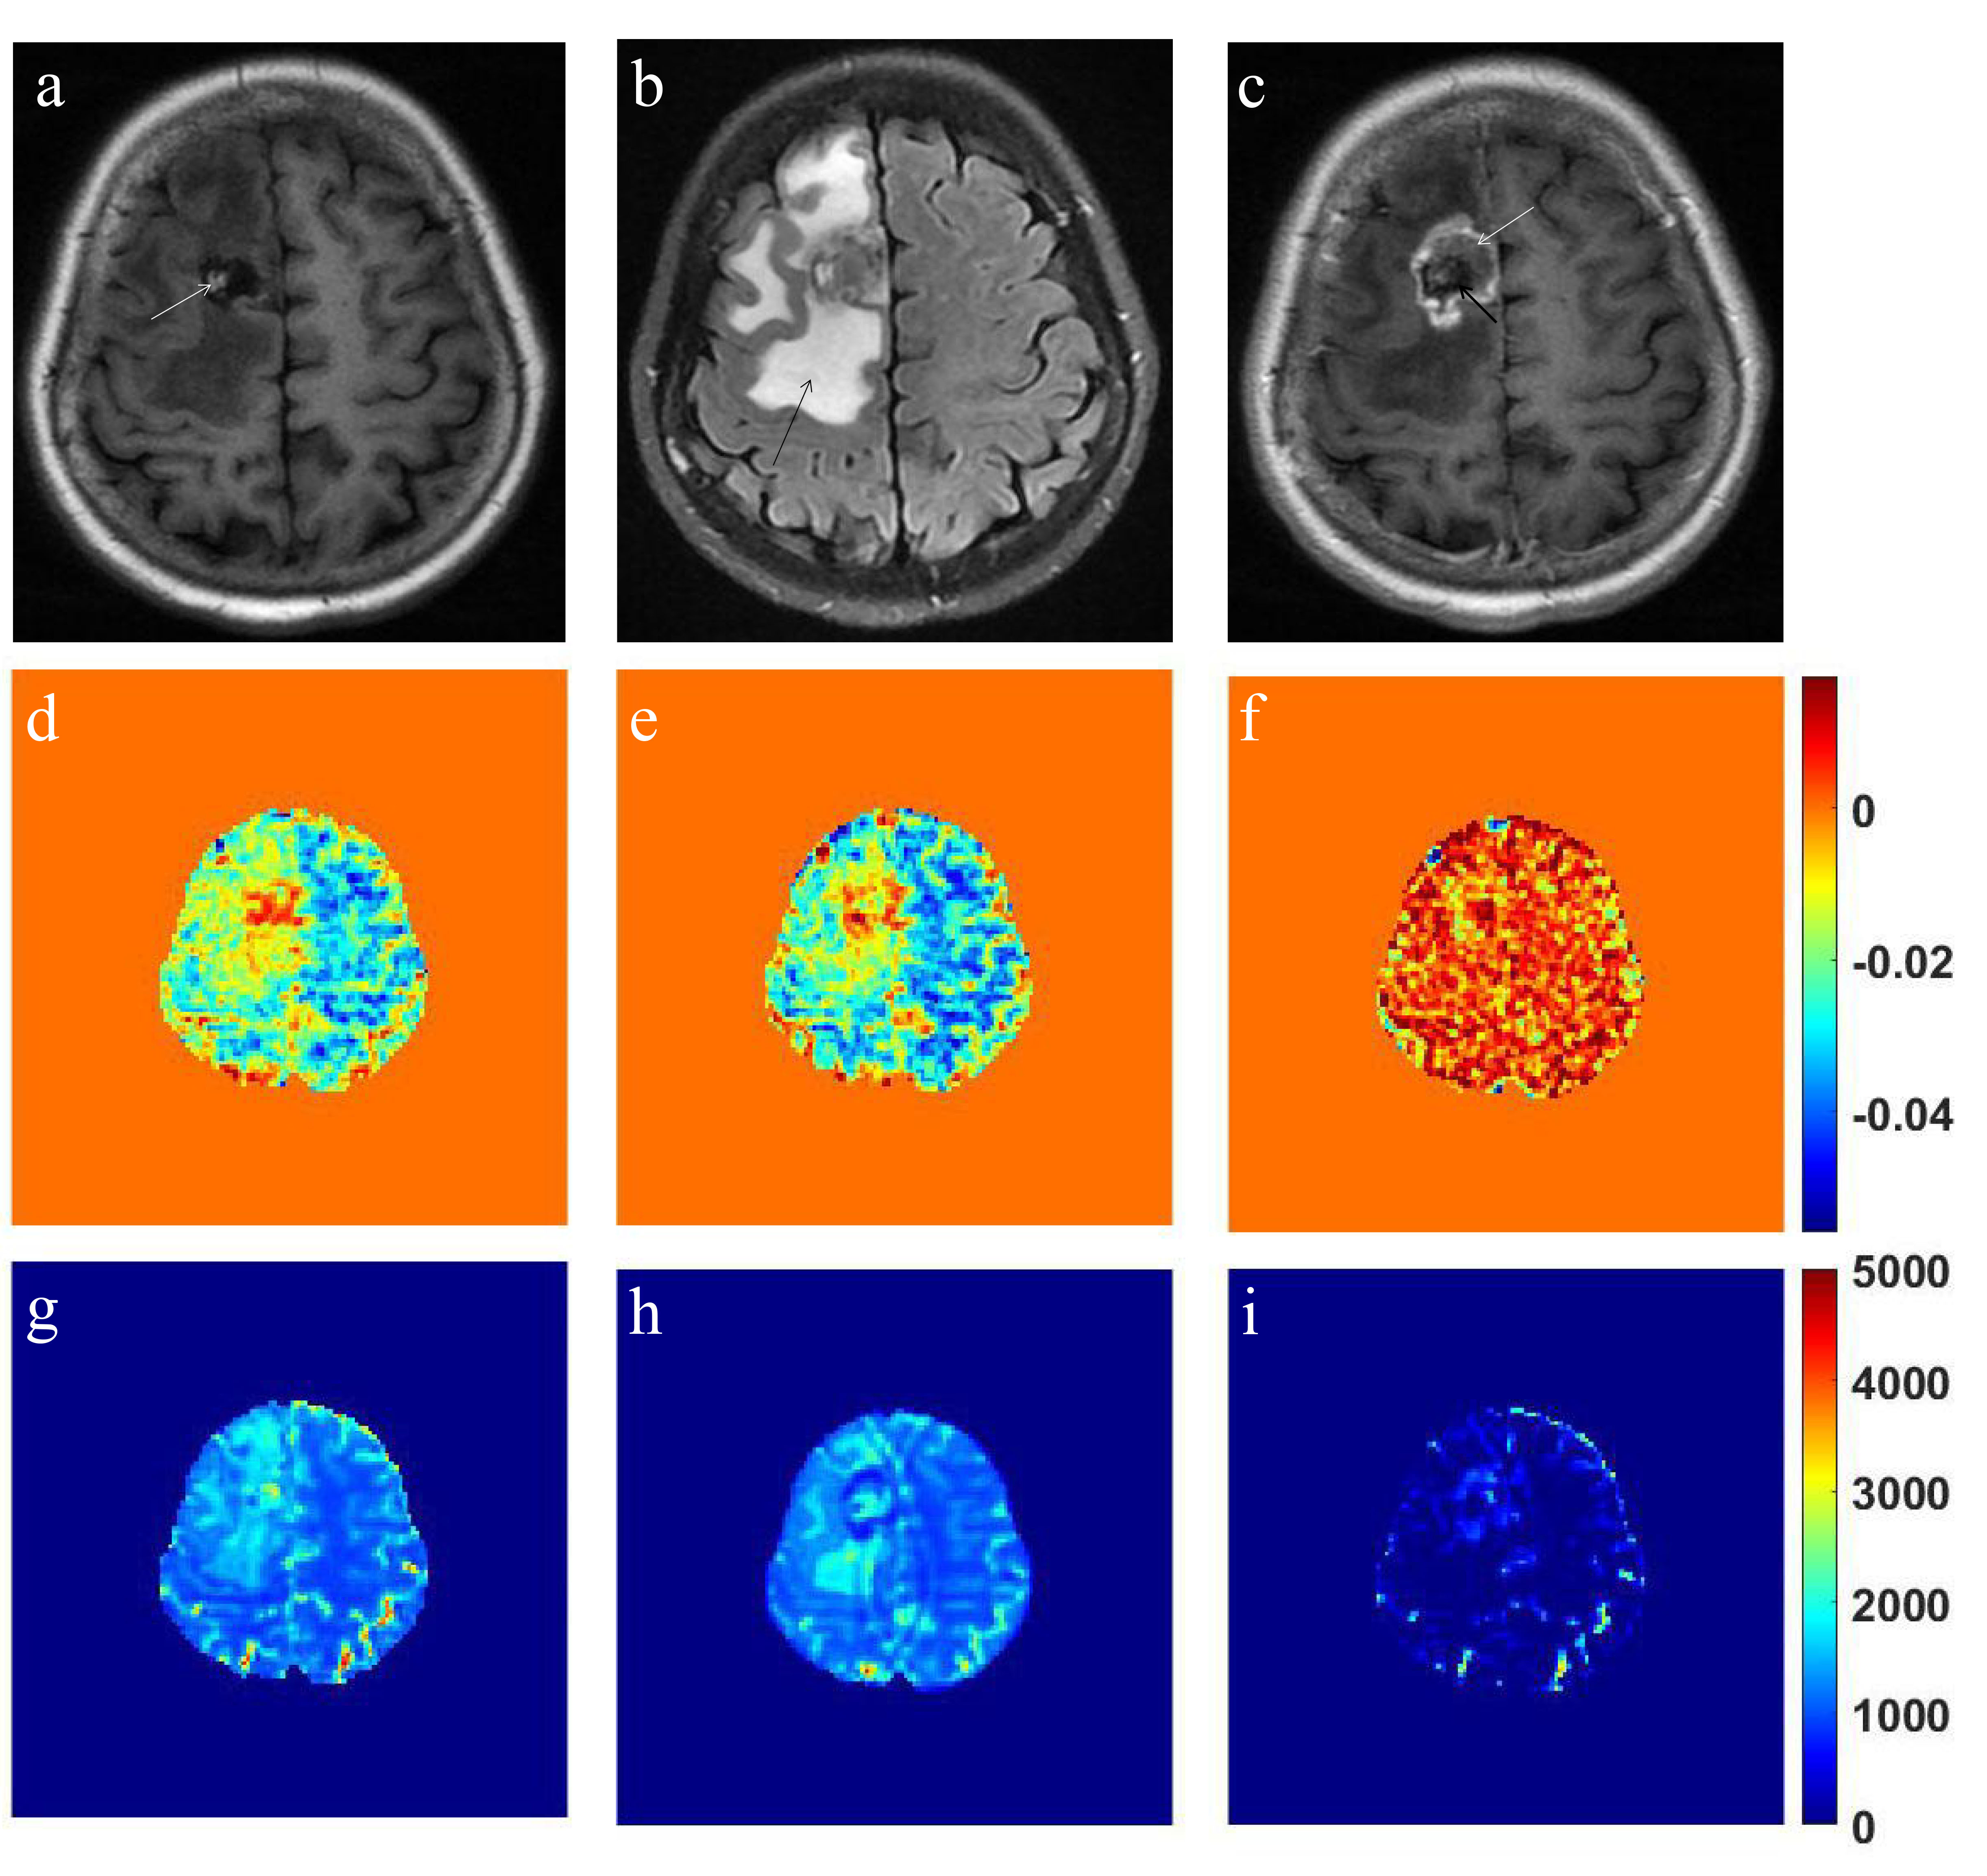
Figure 5: T1-weighted image with hemorrhage (white arrow) (a), corresponding
T2-weighted FLAIR image with clear edema surrounding the tumor (black arrow)
(b) and corresponding post-contrast T1-weighted image with overt enhancement
(white arrow) and no enhancement (black arrow) (c). APT map of pre- (d) and
post-contrast (e) and its subtraction image (f). T1 map of pre- (g) and
post-contrast (h) and its subtraction image (i)
DOI: https://doi.org/10.58530/2022/3859