3857
In vivo measurement of human intraocular water movement using 1H-MRI with H217O saline eye drops
Moyoko Tomiyasu1, Yasuka Sahara1, Etsuko Mitsui1, Hiroki Tsuchiya2, Takamasa Maeda2, Nobuhiro Tomoyori3, Makoto Kawashima3, Tatsuya Higashi1, Atsushi Mizota3, Kohsuke Kudo4, and Takayuki Obata1
1Department of Molecular Imaging and Theranostics, National Institutes for Quantum Science and Technology, Ciba, Japan, 2Department of Medical Technology, National Institutes for Quantum Science and Technology, Ciba, Japan, 3Department of ophthalmology, Teikyo University, Tokyo, Japan, 4Department of Diagnostic and Interventional Radiology, Hokkaido University Hospital, Sapporo, Japan
1Department of Molecular Imaging and Theranostics, National Institutes for Quantum Science and Technology, Ciba, Japan, 2Department of Medical Technology, National Institutes for Quantum Science and Technology, Ciba, Japan, 3Department of ophthalmology, Teikyo University, Tokyo, Japan, 4Department of Diagnostic and Interventional Radiology, Hokkaido University Hospital, Sapporo, Japan
Synopsis
We observed the movement of 17O-labelled water (H217O) in the eyes of three volunteers using dynamic T2W 1H-MRI (3T). After a drop of H217O saline in the right eye, the signal intensity in the right anterior chamber decreased, reaching a minimum at 7–9 min, and then gradually recovered to close to that seen before the eye drop, by about 40 min. Signal decrease and recovery was also observed in the posterior chamber, but not in the vitreous body. These results show that H217O drops flow smoothly into the human anterior chamber and flow out slowly.
Introduction
Abnormalities in the water flow in the anterior chamber cause eye diseases such as glaucoma [1]. Gadolinium, as an MRI contrast agent, does not readily pass through the blood-retinal barrier or the blood-aqueous barrier of capillaries that supply water to the eye; therefore, it is difficult to visualize the flow of ocular aqueous humor. The protons in H217O have various Larmor precession frequencies due to the scalar coupling with 17O [2]. The chemical exchange of protons between H217O and H216O shortens the T2 of the water protons. As a result, the T2WI signal intensity in the region with H217O is lower than that with only H216O. Recently, an in vivo experiment on the human brain using dynamic T2W 1H-MRI of H217O was reported [3]. Our study using eye drops of H217O saline was designed to observe the distribution of H217O in the eye and its flow into and out of the anterior chamber using dynamic T2W 1H-MRI.Methods
Three healthy female volunteers (20–31 years old) participated in our study. The parameters of the dynamic T2W 1H-MRI (3T, Siemens, Erlangen, Germany) were as follows: a half-Fourier, single-shot, turbo-spin echo sequence [4], TR/TE, 3000/444 msec; field-of-view (FOV), 180×180 mm; slice thickness, 3 mm; and matrix, 320×320 pixels, reconstructed to 640×640. The total scan time was 42 min, and each subject performed the following sequence of actions: 1-min, rest (Eyes_closed); 1-min, stare at a single point to avoid eye movement (Eyes_open); 1-min, applied eye drops to her right eye with 10 mol% H217O saline (0.92–1.43 mL; TAIYO NIPPON SANSO, Tokyo, Japan); 9-min, Eyes_open; 5-min, Eyes_closed; 10-min, Eyes_open; 5-min, Eyes_closed; 10-min, Eyes_open. In-house software developed in MATLAB (MathWorks, MA, USA) was used for the data analysis. Images obtained during Eyes_closed periods and those with motion artifacts were not used in the analysis. Three averaged images were created from 10 consecutive images obtained at the following time points: i) just after the application of the eye drop, ii) when the signal intensity was the lowest, and iii) during the signal recovery; then the image obtained prior to the eye drops was subtracted from each of them. To obtain the normalized signal intensity of the right anterior chamber (nAC), in a single image, the right and left anterior chambers were manually selected as regions-of-interest (ROIs), each of size 1.66 mm2 (7×3 pixels), and the right-ROI signal intensity was divided by that of the left. For each of all dynamic images, the ROIs were set at the same position as the two selected ROIs. A linear relationship between H217O concentration and the relaxation rate change (ΔR2) of MR signal intensity has been reported [5, 6]. The ΔR2 of nAC at time t was calculated using the following equation:- ΔR2(t) = [−ln{nAC(t)/nAC(0)}]/TE, (1)
- ΔR2(t) = A{−exp(−Bt) + exp(−Ct)}, (2)
Results
The variations in nAC across time were similar for all subjects: the signal intensity decreased after the eye drop, to a minimum at 7–9 min, and then began to recover, reaching a value close to nAC(0) at 40 min. The subtracted images showed decreases in signal intensity in the anterior and posterior chambers but not in the vitreous body (Fig. 1). The inflow and outflow constants for the three subjects ranged 0.195–0.326 min-1 and 0.026–0.240 min-1, respectively (Fig. 2).Discussion
The time changes of nAC and the inflow and outflow constants were similar for the three subjects. These results show that the H217O saline eye drops flow smoothly into the anterior chamber and flow slowly out again, as can be observed using dynamic T2W 1H-MRI. There have been no reports of H217O being administered to human eyes in vivo, but there are a few reports in animals [6, 7]. Kwong et al. administered H217O to the rabbit eye [6]. Similar observations in rabbit eyes were reported by Obata et al. in 2H-MRI with D2O [8]. With the application of eye drops to the rabbit eye in those studies [6, 8], outflow of H217O and of D2O from the anterior chamber gave similar results, with a constant of about 0.1 min-1. Our outflow constants ranged from 0.026 to 0.240 min-1, which include the above value, but with such a large range in our values, 0.1 cannot clearly be considered ‘similar’. Our large range may indicate that there are large individual differences in humans, including the instability due to the very long scan time. For T2WI, the D2O study reported signal changes in the vitreous body [8], therefore in our study, the possibility of signal changes at the noise level due to the flow of H217O into the vitreous body cannot be ruled out.Conclusions
Our results using dynamic T2W 1H-MRI showed that H217O saline eye drops were distributed in the human anterior and posterior chambers and smoothly flowed into, and slowly out of, the anterior chamber. Further measurements on healthy subjects are needed to confirm differences in age and other factors.Acknowledgements
This work was supported by a Grant-in-Aid (Public/Private R&D Investment Strategic Expansion PrograM: PRISM) from the Cabinet Office, Japan.
References
- Allingham, R.R., et al., Shields' Textbook of Glaucoma. 7th ed. 2020: LWW. 661.
- Elliott, S.J., et al., NMR Lineshapes and Scalar Relaxation of the Water-Endofullerene H217O@C60. Chemphyschem, 2018. 19(3): p. 251-255.
- Kudo, K., et al., Indirect Proton MR Imaging and Kinetic Analysis of 17O-Labeled Water Tracer in the Brain. Magn Reson Med Sci, 2018. 17(3): p. 223-230.
- Patel, M.R., et al., Half-fourier acquisition single-shot turbo spin-echo (HASTE) MR: comparison with fast spin-echo MR in diseases of the brain. AJNR Am J Neuroradiol, 1997. 18(9): p. 1635-40.
- Hopkins, A.L. and R.G. Barr, Oxygen-17 compounds as potential NMR T2 contrast agents: enrichment effects of H217O on protein solutions and living tissues. Magn Reson Med, 1987. 4(4): p. 399-403.
- Kwong, K.K., et al., Measurement of water movement in the rabbit eye in vivo using H217O. Magn Reson Med, 1991. 22(2): p. 443-50.
- Kwong, K.K., et al., Proton NMR imaging of cerebral blood flow using H217O. Magn Reson Med, 1991. 22(1): p. 154-8.
- Obata, T., et al., Deuterium magnetic resonance imaging of rabbit eye in vivo. Magn Reson Med, 1995. 33(4): p. 569-72.
Figures
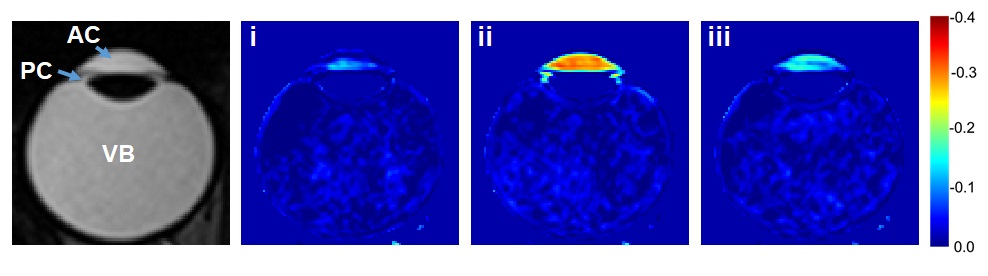
Figure
1. Representative T2W image and
subtracted images from the right eye (20 years old). T2W
image (left-most), obtained before the application of the H217O
drop. Averaged images obtained at the following times : i) just after the eye
drop, ii) when the signal intensity was the lowest, and iii) during the signal
recovery, are shown after subtraction of the averaged image before the eye drops.
The image acquisition time points are shown in Figure 2. AC = anterior chamber,
PC = posterior chamber, VB = vitreous body.
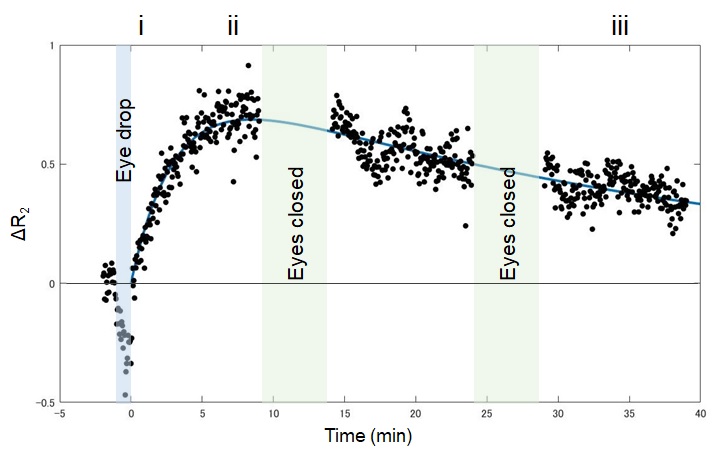
Figure 2. Representative
relaxation rate changes (ΔR2s) calculated using normalized signal intensity of
the right anterior chamber, obtained from dynamic T2W 1H-MRI (20 years old). A biexponential curve is
fitted with A{− exp(–Bt) + exp(−Ct)}. Time t = 0 is the end of the eye drop. A
= 0.926 sec-1, B = 0.326 min-1, and C = 0.026 min-1.
The labels (i – iii) at the top of the plot correspond to the data collection
times for creating the subtracted images in Figure 1.
DOI: https://doi.org/10.58530/2022/3857