3855
Prediction of IDH, 1p/19q and TERTp Status: combination of APTw value of tumor solid and peritumoral area1Lanzhou University Second Hospital, Lanzhou, China, 2Philips Healthcare, Xi'an, China
Synopsis
This study aims to analyze the metabolic information in both tumor solid and peritumoral area of gliomas to predict its genotype by using Amide Proton Transfer weighted (APTw) imaging. As a complementary method of pathological evaluation, APTw based MRI technique could provide a prediction of the gliomas genotype. Unlike other studies focus on tumor core region, our research investigated the APTmean value of tumor solid and the peritumoral area. Interestingly, the results showed that the AUC value of peritumoral area was higher than the tumor solid. The APTw images may serve as a potential marker for the genotyping of gliomas.
Introduction
The fifth edition of the WHO classification of tumors of the central nervous system emphasizes the role of molecular diagnosis in gliomas1. Among these molecular alterations,isocitrate dehydrogenase (IDH), telomerase reverse transcriptase gene promoter (TERTp), and 1p/19q codeletion are significantly associated with overall survival rate2. For the limitation of pathological evaluation3, MRI derived macro-information can help predicting the gliomas genotype, planning optimal therapeutic strategies. Amide proton transfer weighted (APTw) imaging, a molecular imaging technique, can reveal tumor metabolism information non-invasively. Previous studies just demonstrated that APT has potential ability to predict one or two molecular alterations of gliomas4. Nevertheless, few of researchers take full use of the APT derived information, both the tumor solid and the peritumoral area, to differentiate gliomas genotyping into subgroup genotypes. In this study, we intend to investigate the value of APTw imaging in peritumoral and tumor solid area to predict the genotype of gliomas before surgeryMethods
Twenty-one patients with pathological confirmed the WHO grade 2 and 3 gliomas were enrolled, using three molecular alterations: mutations in the TERT promoter, mutations in IDH, and codeletion of chromosome arms 1p and 19q (1p/19q codeletion) divided into three molecular groups, the triple-positive group (10 patients), only the IDH-mutation group (6 patients) and the IDH-mutation with 1p/19q co-deletion group (5 patients). All patients underwent MR imaging on a 3T scanner (Ingenia CX, Philips Healthcare, the Netherlands) using a 32 channel phase array head coil. The APTw imaging was performed with 3D TSE-DIXON sequence. B0 corrected APT images were reconstructed automatically online by the Philips InteliSpace workstation. In order to accurately define the tumor borders, the APTw images were automatically co-registered to the FLAIR and post-contrast 3D-T1W images by performing a rigid transformation of the datasets. Imaging analysis of peritumoral area and tumor solid on multiple brain levels of APTw maps was performed by two radiologists (both with 6 or more years of experience) independently. Three separate ROIs with an area of 25–30 mm2 were placed on the peritumoral area (within 2cm from the edge of the tumor) and tumor solid of each level, avoiding intra-tumoral blood vessels, hemorrhage, cystic or necrotic regions, and the mean value for APT was recorded (see Figure1). The intraclass correlation coefficient (ICC) was used to evaluate the inter-observer consistency and reproducibility of the quantitative measurements. Differences between three groups were analyzed using One-way analysis of variance (ANOVA). Receiver operator characteristic (ROC) and area under curve (AUC) was performed to determine the diagnostic efficiency. All the statistical analyses were performed through SPSS software.Results
The APTmean of the tumor solid and the peritumoral area were significantly different among all groups (all p < 0.05). Positive correlations with statistical significance were found between the APTmean of the tumor solid and the peritumoral area (p<0.001)(see Figue2). The ROC curve analysis showed that the APTmean of the peritumoral area performed better than the APTmean of the tumor among all groups, while the combined diagnostic efficiency had the best diagnostic accuracy (see Figure3). The ICC value showed that the two radiologists had good agreement on the data measurement (ICC: 0.90,0.96;95%CI:0.83-0.95,0.89-0.98).Discussion
Molecular biomarkers become more and more important in providing diagnostic information. Eckel-Passow JE et al. analyzed the mutation status of IDH, 1p/19q and TERTp and based upon these three molecular makers to stratify grades 2 and 3 gliomas into different subgroups, associated with clinical outcomes independently5. In our study, the APTmean value of both the tumor solid and the peritumoral area showed significantly difference among these three groups: the triple-positive group had the highest APTmean value, while only the IDH- mutation group had the lowest. The recent study found that the 1p/19q non-codeletion gliomas is more likely to be related to the highly malignancy and worse prognosis. Some of these genes affect the tumor invasion, cell migration, angiogenesis, and implicated in drug resistance6. Furthermore, TERTp keeps silent in most somatic cells, and is reactivated in cancer cells, endowing them with unrestricted proliferation capacity. The proliferative advantage of TERTp mutation may cause the reduction of protein synthesis7. Both of the two alterations lead to decrease in APTmean value. In addition, our results also show that the APTmean value of the peritumoral area is more capable in distinguishing genotype subgroups than the tumor solid area. A possible explanation for this might be that the peritumoral area seemed to have more active tricarboxylic acid cycle than the tumor solid8. Besides, in order to help transition from epithelial to mesenchymal markers, the cells of gliomas in peritumoral area have an increase of fibronectin and laminin in the extracellular matri9. Thus, the APTmean value in the peritumoral area might provide more metabolic information for predicting the genotype of gliomas. Furthermore, the best diagnostic preference that achieved by the combination of peritumoral area and tumor solid APTmean value suggests the APTw method can provide a promising way to differentiate gliomas genotype and help to give an additional imaging evidence to clinical diagnosis.Acknowledgements
This study was supported Health Industry Research Program Funding Project of Gansu Province (GSWSKY2020-68).References
1.Louis DN, Perry A, Wesseling P et al. The 2021 WHO Classification of Tumors of the Central Nervous System: a summary. Neuro Oncol. 2021 Aug 2;23(8):1231-1251.
2. Schiff D, Van den Bent M, Vogelbaum MA et al. Recent developments and future directions in adult lower-grade gliomas: Society for Neuro-Oncology (SNO) and European Association of Neuro-Oncology (EANO) consensus. Neuro Oncol. 2019 Jul 11;21(7):837-853.
3. Perry A, Wesseling P. Histologic classification of gliomas. Handb Clin Neurol. 2016;134:71-95.
4. Jiang S, Zou T, Eberhart CG, et al. Predicting IDH mutation status in grade II gliomas using amide proton transfer-weighted (APTw) MRI. Magn Reson Med. 2017;78(3):1100-1109.
5.Eckel-Passow JE, Lachance DH, Molinaro AM et al. Glioma Groups Based on 1p/19q, IDH, and TERT Promoter Mutations in Tumors. N Engl J Med. 2015 Jun 25;372(26):2499-508.
6. Chai RC, Zhang KN, Chang YZ, et al. Systematically characterize the clinical and biological significances of 1p19q genes in 1p/19q non-codeletion glioma. Carcinogenesis. 2019 Oct 16;40(10):1229-1239.
7. Hafezi F, Perez Bercoff D. The Solo Play of TERT Promoter Mutations. Cells. 2020 Mar 19;9(3):749.
8. Oizel K, Chauvin C, Oliver L, et al. Efficient Mitochondrial Glutamine Targeting Prevails Over Glioblastoma Metabolic Plasticity. Clin Cancer Res. 2017;23(20):6292-6304.
9. Biasoli D, Sobrinho MF, da Fonseca AC, et al. Glioblastoma cells inhibit astrocytic p53-expression favoring cancer malignancy. Oncogenesis. 2014;3(10):e123.
Figures
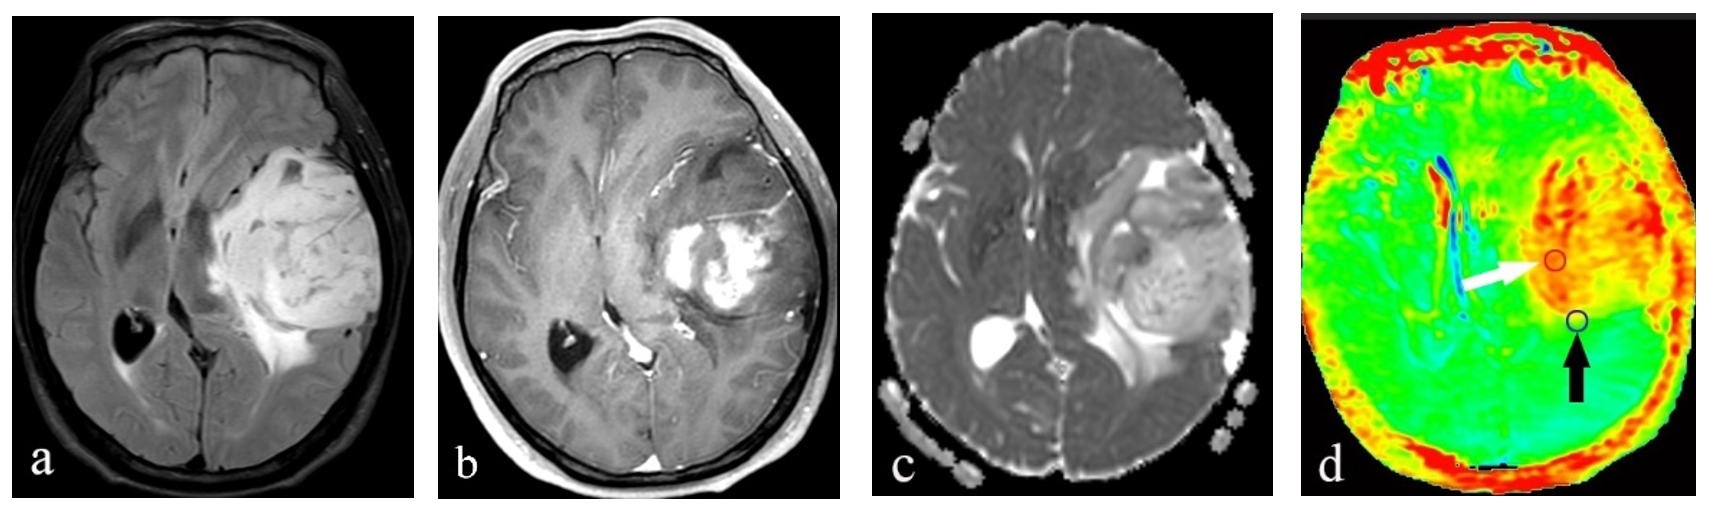
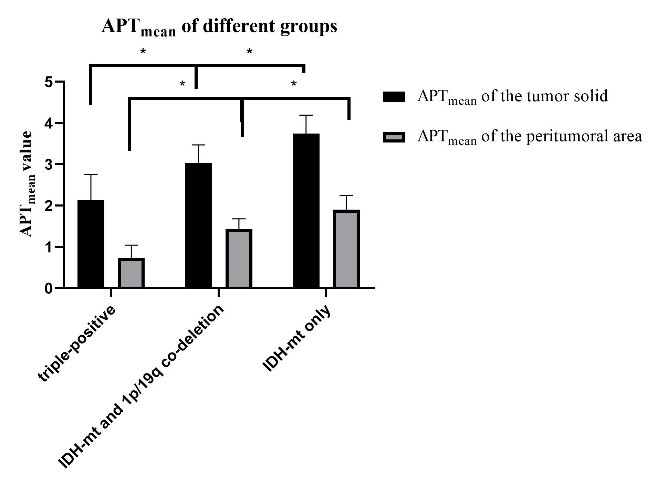
Figure 2. Comparison of all parameters of different sub-classifications.
Note: *P < 0.05
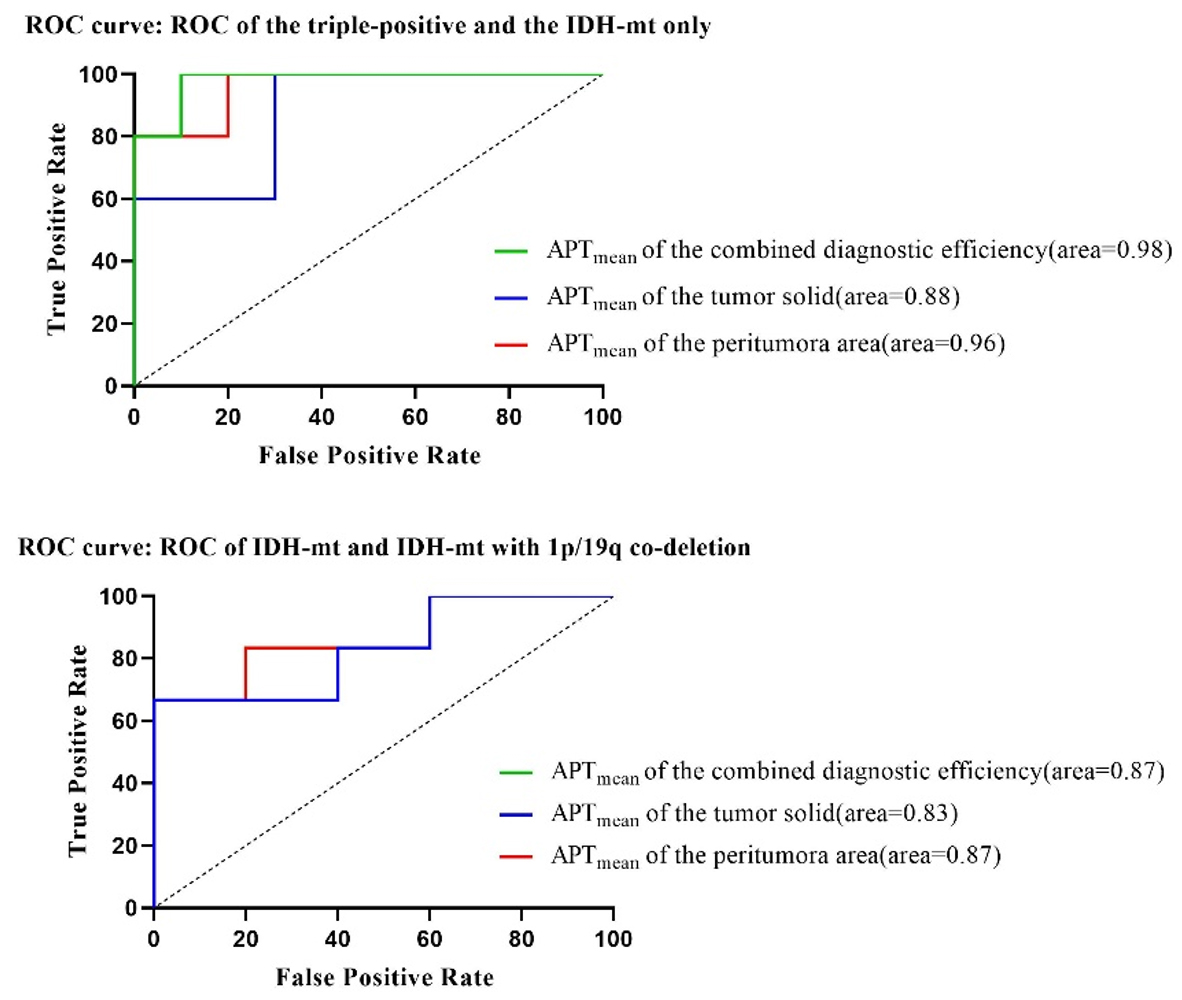
Figure 3. ROC analysis for distinguishing sub-classifications with all parameters.
Note: ROC curves illustrate the performance of all parameters. The green line (APTmean of the combined diagnostic efficiency) overlaps the blue line (APTmean of the tumor solid).