3853
Characterization and correction of the hepatic iron effects on T1rho relaxation in the liver at 3.0 Tesla
Yurui QIAN1, Jian Hou1, Baiyan Jiang1,2, Vincent Wai-Sun Wong3, Queenie Chan4, Yixiang Wang1, Winnie Chiu-Wing Chu1, and Weitian Chen1
1Department of Imaging and Interventional Radiology, The Chinese University of Hong Kong, Hong Kong, Hong Kong, 2Illuminatio Medical Technology Limited, Hong Kong, Hong Kong, 3Medicine & Therapeutics, The Chinese University of Hong Kong, Hong Kong, Hong Kong, 4Philips Healthcare, Hong Kong, Hong Kong
1Department of Imaging and Interventional Radiology, The Chinese University of Hong Kong, Hong Kong, Hong Kong, 2Illuminatio Medical Technology Limited, Hong Kong, Hong Kong, 3Medicine & Therapeutics, The Chinese University of Hong Kong, Hong Kong, Hong Kong, 4Philips Healthcare, Hong Kong, Hong Kong
Synopsis
Spin-lock T1rho is a non-invasive MR imaging method. It has the potentials for the assessment of chronic liver diseases. However, liver iron content can potentially confound T1rho quantification of the liver. In this work, we reported a method to correct the influence of liver iron content on T1rho quantification of the liver at 3.0T.
Introduction
Previous studies(1–3) reported T1rho has potential in assessment of liver diseases. However, Liver iron content (LIC) may confound T1rho quantification(4). In this study, we proposed a method to correct this effect in hepatic T1rho imaging. The results show that this method can be used to mitigate the influence from iron on T1rho quantification of the liver.Methods
Based on the Bloch-McConnell equations, the R1rho (=1/T1rho) relaxation rate at on-resonance spin-lock can be derived as(5): $$R1rho = Reff + Rex [1]$$Here Reff is the water relaxation rate in the rotating frame, and Rex is the relaxation rate due to chemical exchange. For on resonance spin-lock, Reff equals to the tissue intrinsic R2 of tissue. Note the tissue intrinsic R2 is sensitive to the magnetic susceptibility variation at the microscopic level caused by irons, and Rex is primarily affected by chemical exchange effect (6) and insensitive to iron level. Thus, by denoting the R1rho without influence from iron as icR1rho and the change of the intrinsic R2 due to iron as ∆R2, we have:$$icR1rho ≈ R1rho - ΔR2 [2]$$The goal of correction of influence from iron on T1rho measurement is to determine ΔR2. Santyr et al (7) derived in theory that the T2 measured using CPMG pulse sequences is comparable to T1rho when the echo spacing in CPMG T2 equals half of the inverse of spin-lock frequency (FSL) under the condition that the echo spacing is much longer than the duration of the refocusing RF pulses. Thus, we expect iron may have similar effect on T1rho relaxation as that on T2 measured using CPMG pulse sequences. In this work, we propose the following equation to calculate ΔR2:$$ΔR2 = k0·k1·k2·ΔLIC(mg/g, dry) [3]$$Here ΔLIC is the difference between actual LIC and reference value of normal LIC (=1 mg/g at dry weight). The constant k0 characterizes the linear correlation between CPMG R2 and liver iron content (LIC) at 1.5 T. According to Doyle et al (8), k0 = 2.11 [1/(sec·mg/g), dry weight]. The coefficient k1 represents the ratio of CPMG R2 from 1.5 T to 3.0 T. According to Wang et al (9), k1 = 1.41. In Eq. [3], we introduced a new constant k2 as the transfer ratio from CPMG R2 to R1rho. We measure k2 in vivo using a pulse sequence for simultaneous acquisition of T1rho and T2 in the liver (10).The study was conducted under the approval of the institutional review board. Total 110 subjects (male 55, female 55, age 57.8±10.5 years old) were recruited in this study. All scans were conducted using a 3.0 T MRI scanner (Achieva TX, Philips Healthcare). A 32-channel cardiac coil was used as the receiver and the body coil was used as the RF transmitter. The liver iron content (LIC) was measured using the method described in(11). T1rho imaging was performed using the pulse sequence described in (12). The imaging parameters include: TR 2000 ms, TE 20 or 17 ms, resolution 1.5×1.5 mm or 2×2 mm, thickness 7 mm, TSL 0, 10, 30, 50 ms, and frequency of spin-lock 300 Hz. SPAIR (Spectral Attenuated Inversion Recovery) was used for fat suppression. The data sets were acquired within a single breathhold of 10 seconds for one slice. Fifty-three subjects received simultaneous T1rho and T2 imaging. The imaging parameters were same as those described in (10). The data sets for simultaneous T1rho and T2 mapping were acquired within a single breathhold of 14 seconds for one slice. The mean of the T1rho and T2 from the same ROIs were used for correlation and linear regression analysis.Results and Discussion
Figure 1 shows simultaneously acquired R2 (1/T2) and R1rho (1/T1rho) maps. Figure 2 shows the linear regression results from the R2 and R1rho. The k2 was calculated as the slope of the regression (0.48±0.03, 95% confidence level). Figure 3 shows the results before and after the correction using the proposed method. Note the iron corrected R1rho has no statistical correlation with LIC after the correction. The Spearman correlation coefficient reduced from R=0.51 (P-value < 1e-3) before the correction to R=0.08 (P-value < 0.39) after the correction using data sets from all subjects.Spin-lock is reported a promising technology for probing chemical exchange effect(13). The T1rho value after iron correction may have improved specificity to the chemical exchange effect. T1rho is also sensitive to water content change. The proposed correction method can potentially improve the application of T1rho for assessment of liver diseases associated with water content change, such as inflammation.Conclusion
We proposed a method to correct the influence from iron on liver T1rho quantification at 3.0 T. The preliminary in-vivo results demonstrate the method can significantly reduce the influence from iron on T1rho imaging of the liver.Acknowledgements
This study was supported by a grant from the Hong Kong Health and Medical Research Fund (HMRF) 06170166, a grant from the Innovation and Technology Commission of the Hong Kong SAR (Project MRP/046/20X), and a grant from the Research Grants Council of the Hong Kong SAR (Project SEG CUHK02).References
- Wang YXJ, Yuan J, Chu ESH, Go MYY, Huang H, Ahuja AT, et al. T1ρ MR imaging is sensitive to evaluate liver fibrosis: An experimental study in a rat biliary duct ligation model. Radiology. 2011; 2.
- Xie S, Qi H, Li Q, Zhang K, Zhang L, Cheng Y, et al. Liver injury monitoring, fibrosis staging and inflammation grading using T1rho magnetic resonance imaging: An experimental study in rats with carbon tetrachloride intoxication. BMC Gastroenterol. 2020
- Takayama Y, Nishie A, Asayama Y, Ushijima Y, Okamoto D, Fujita N, et al. T1ρ Relaxation of the liver: A potential biomarker of liver function. J Magn Reson Imaging. 2015
- Wáng YXJ, Chen W, Deng M. How liver pathologies contribute to T1rho contrast require more careful studies. Quantitative Imaging in Medicine and Surgery. 2017.
- Trott O, Palmer AG. R 1ρ relaxation outside of the fast-exchange limit. Journal of Magnetic Resonance. 2002.
- Jin T, Kim SG. Quantitative chemical exchange sensitive MRI using irradiation with toggling inversion preparation. Magn Reson Med. 2012;68(4):1056–64.
- Santyr GE, Henkelman RM, Bronskill MJ. Variation in measured transverse relaxation in tissue resulting from spin locking with the CPMG sequence. J Magn Reson. 1988;79(1):28–44.
- Doyle EK, Thornton S, Toy KA, Powell AJ, Wood JC. Improving CPMG liver iron estimates with a T1-corrected proton density estimator. Magn Reson Med. 2021;(November 2020):1–12.
- Wang C, Reeder SB, Hernando D. Relaxivity-iron calibration in hepatic iron overload: Reproducibility and extension of a Monte Carlo model. NMR Biomed. 2021;(e4604).
- Chen W, Wong VW-S, Chan Q, Wang Y-XJ, Chu WC-W. Simultaneous acquisition of T1rho and T2 map of liver with black blood effect in a single breathhold. In: ISMRM 25th Annual Meeting. Hawaii; 2017.
- Paisant A, d’Assignies G, Bannier E, Bardou-Jacquet E, Gandon Y. MRI for the measurement of liver iron content, and for the diagnosis and follow-up of iron overload disorders. Press Medicale
- Chen W, Chan Q, Wáng YXJ. Breath-hold black blood quantitative T1rho imaging of liver using single shot fast spin echo acquisition. Quant Imaging Med Surg. 2016;6(2):168–77.
- Jin T, Kim SG. Advantages of chemical exchange-sensitive spin-lock (CESL) over chemical exchange saturation transfer (CEST) for hydroxyl- and amine-water proton exchange studies. NMR Biomed. 2014;27(11):1313–24.
Figures
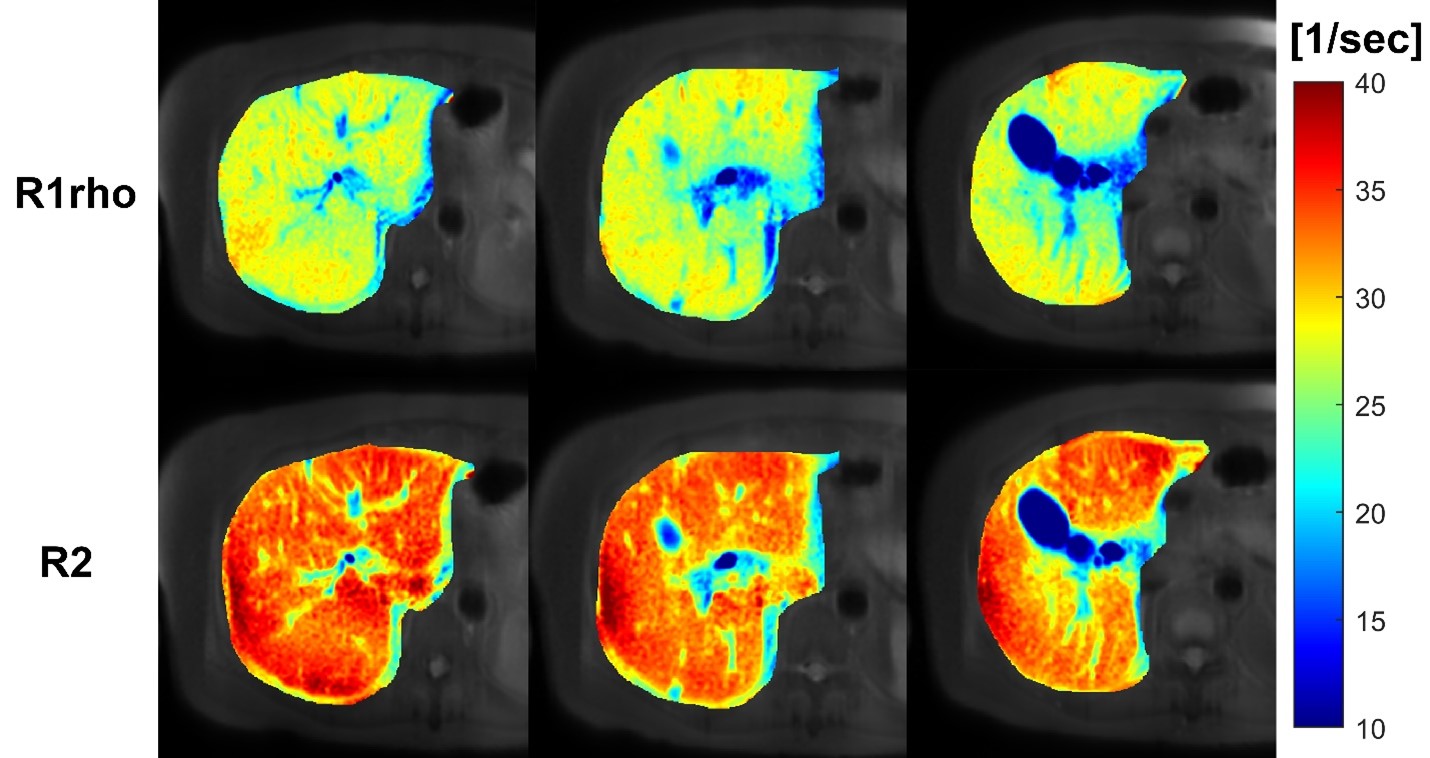
Fig. 1. Liver relaxation rate R1rho and R2 maps of
three slices from one subject. The R1rho map and R2 map of each slice were
acquired within a single breath-hold of 14 seconds.
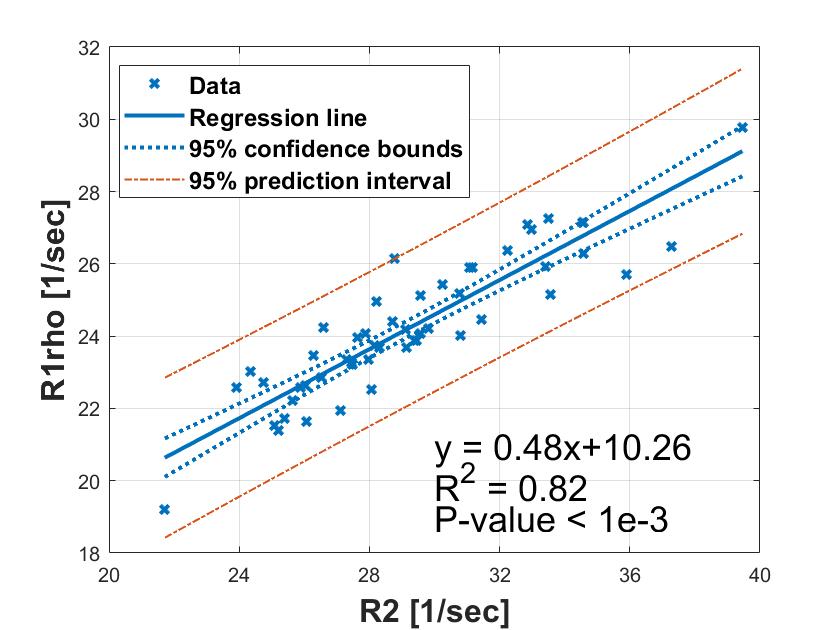
Fig. 2. Linear
regression analysis of R1rho and R2. The slope of regression is 0.48±0.03
with 95% confidence level, p-value < 1e-3. Data were collected from fifty-three subjects using
a breath-hold simultaneous T1rho and T2 imaging pulse sequence.
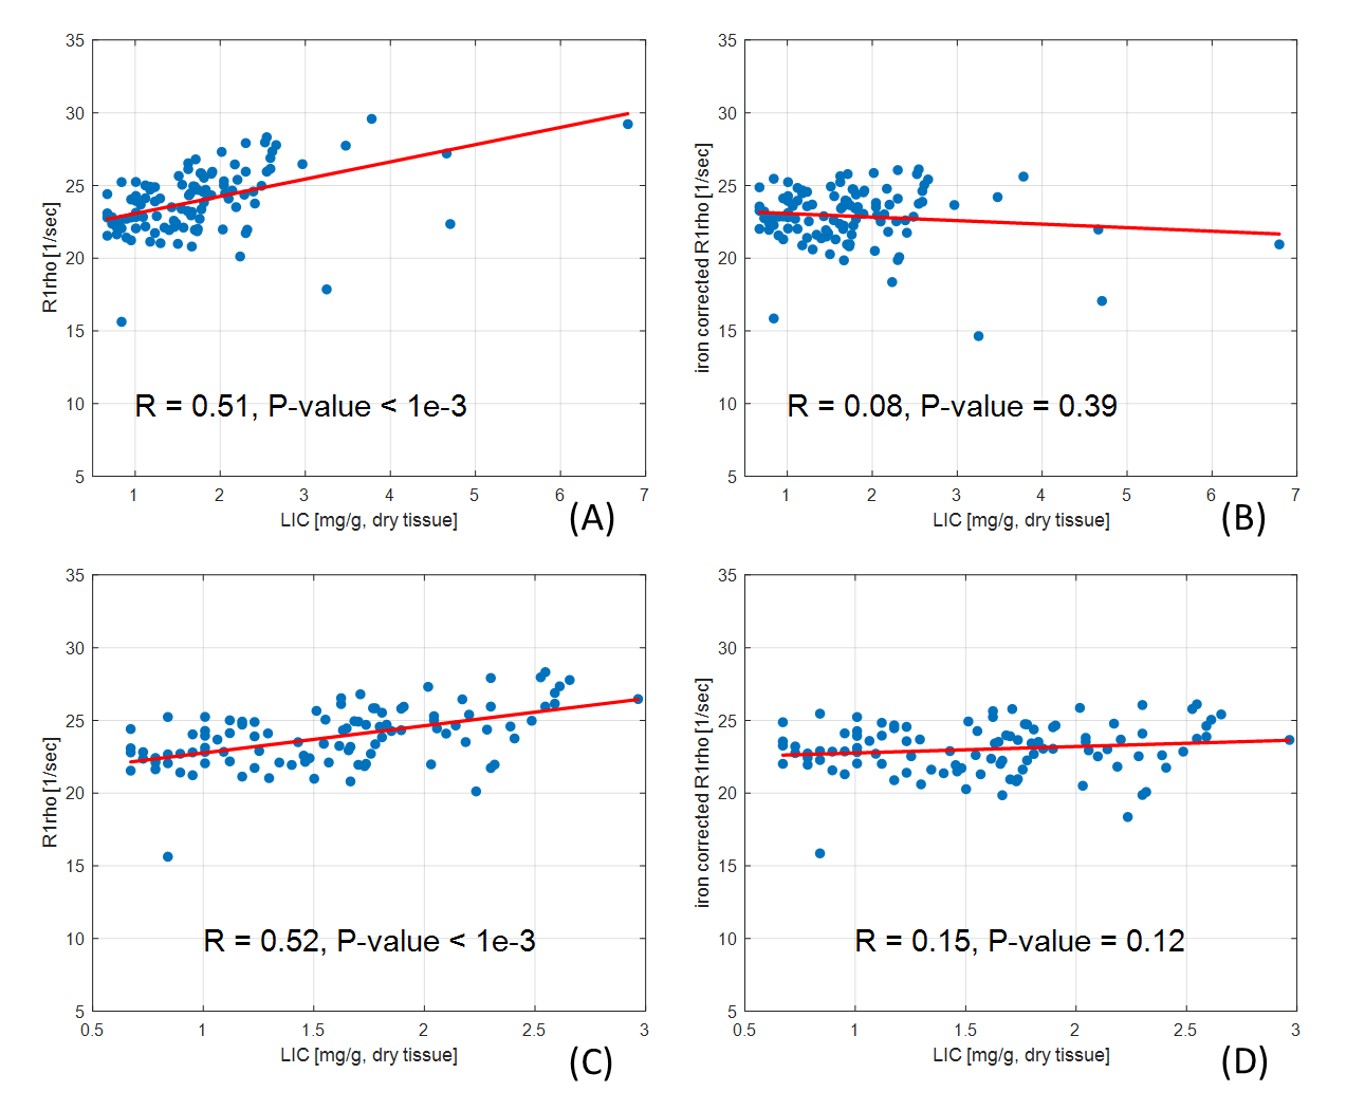
Fig. 3. Spearman correlation
analysis of R1rho before and after the proposed correction method. Spearman correlation coefficients (R) are shown
in the plots. (A) and (C) are R1rho without the correction of iron effect. (B)
and (D) are R1rho after the correction of iron effect using the proposed method.
Note there is no statistical linear correlation after using the proposed correction
method (P-value > 0.05). (A) and (B) show the results from all subjects. (C)
and (D) show the results from subjects with LIC < 3 [mg/g, dry].
DOI: https://doi.org/10.58530/2022/3853