3852
Non-invasive assessment of PD-L1 expression status in non-small cell lung cancer using multi-parametric 18F-FDG PET/MRI1Department of Medical Imaging, Zhengzhou University People’s Hospital & Henan Provincial People’s Hospital, Zhengzhou, China, 2Department of Medical Imaging, Henan Provincial People’s Hospital, Zhengzhou, China, 3Department of Medical Imaging, Henan University People’s Hospital & Henan Provincial People’s Hospital, Zhengzhou, China, 4Department of Medical Imaging, Xinxiang Medical University Henan Provincial People’s Hospital, Zhengzhou, China, 5Central Research Institute, UIH Group, Shanghai, China, 6Beijing United Imaging Research Institute of Intelligent Imaging, UIH Group, Beijing, China
Synopsis
18F-Fluorodeoxyglucose positron-emission tomography/magnetic resonance imaging (18F-FDG PET/MRI) allows multimodal quantitative MRI sequences to be scanned in parallel with PET imaging, providing a more multidimensional reflection of lesion information. Our results showed that intravoxel incoherent motion (IVIM), amide proton transfer-weighted imaging (APTWI), and metabolism related parameters can be beneficial for the non-invasive assessment of PD-L1 expression in NSCLC patients, and the combination of SUVmax, D, and MTRasym(3.5ppm) may serve as a prognostic biomarker to guide immunotherapy.
Introduction
Programmed cell death ligand 1(PD-L1) is a transmembrane protein and its expression has been increasingly shown to play an important role in the treatment of non-small cell lung cancer (NSCLC)[1]. Multi-parametric positron-emission tomography / magnetic resonance imaging (PET/MRI), including 18F-FDG PET, diffusion-weighted imaging (DWI), intravoxel incoherent motion (IVIM), and amide proton transfer-weighted imaging (APTWI), is sensitive to the glucose metabolism, water molecular diffusion, microcirculation perfusion and mobile protein and peptide metabolism in biological tissues [2, 3]. Currently, only a few small number of studies have separately explored the value of IVIM or APTWI in the noninvasive assessment of subtype, cell proliferation, or epidermal growth factor receptor (EGFR) expression in lung cancer [4, 5]. This study aimed to investigate the contributory value of 18F-FDG PET, DWI, IVIM, and APTWI-related parameters for non-invasive prediction of PD-L1 expression statue in NSCLC, in turn providing new insights for the clinical diagnosis and prognostic assessment of the patients involved.Material and Methods
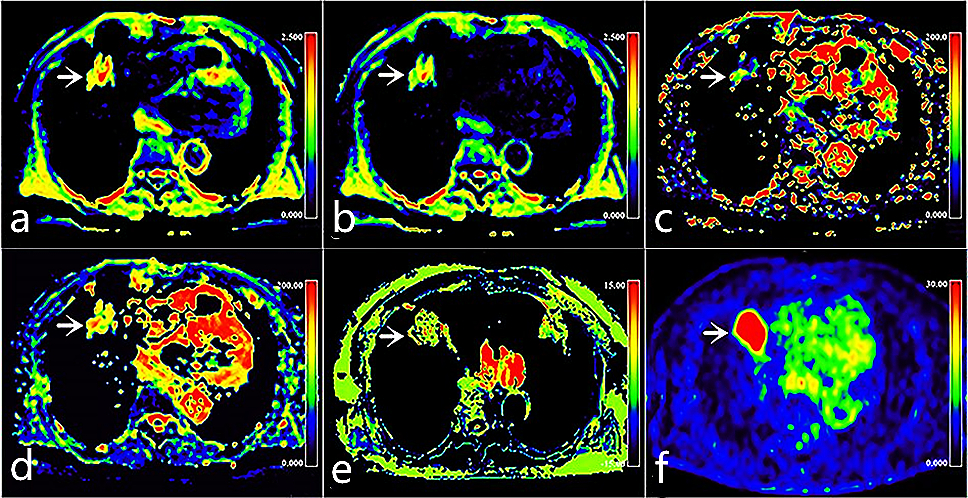
A total of 70 enrolled subjects were classified into PD-L1 positive and negative groups. A hybrid 3.0 T PET/MR system (uPMR 790, UIH, Shanghai, China) with a 12-channel phased-array body coil was was performed. The PET scan was initiated 60 minutes after injection of 18F-FDG (0.11 mCi/kg). A Dixon method-based water-fat imaging sequence was performed for attenuation correction and ordered subset maximum expected iteration methods were used to reconstruct the images. The DWI and IVIM were performed by using two (0, 800 s/mm2) and ten (0, 25, 50, 100, 150, 200, 400, 600, 800, and 1000 s/mm2) b values, respectively. For APTWI: ETL = 39, B1 = 1.3 μT and 2.5 μT, Gaussian pulse, 100 ms duration, 10 repeats, Δ spanned from [-4.5 4.5] ppm in 31 steps, plus one S0 with no CEST saturation pulse for normalization; 11 low power B1 = 0.13 μT, Δ spanned from [-1.0 1.0] ppm images were collected as WASSAR images for B0 map correction. All images were performed with specialized software in the advanced-analysis toolkit of the UIH Workstation (uWS-MR: R005). SPSS 26.0 and R 3.53 were employed for statistical analyses. The Mann-Whitney U test or independent-sample t-test was utilized for data comparison. The area under the receiver operating characteristic (ROC) curve (AUC) was applied to describe the diagnostic efficacy, and the differences were compared using the DeLong test. Logistic regression analyses were performed to filter the best combination of parameters. A control model was established by the bootstrap (1000 samples), and its performance was verified with calibration curves and ROC curves.Results
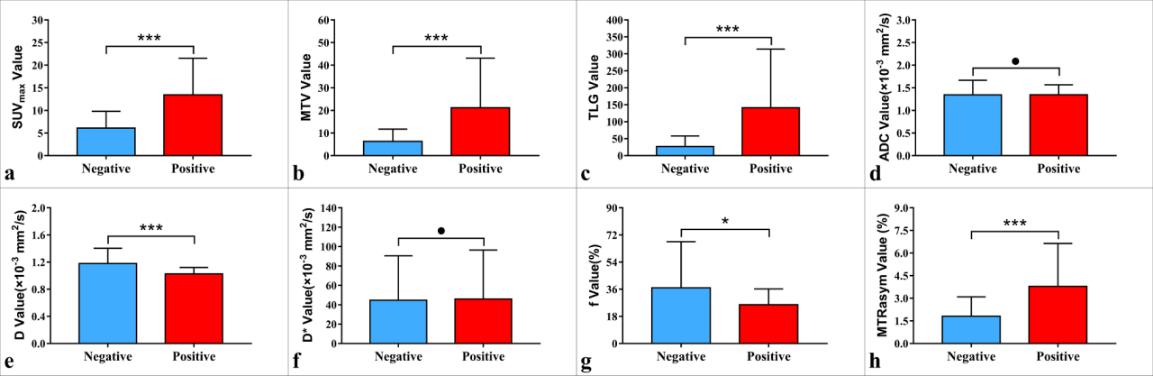
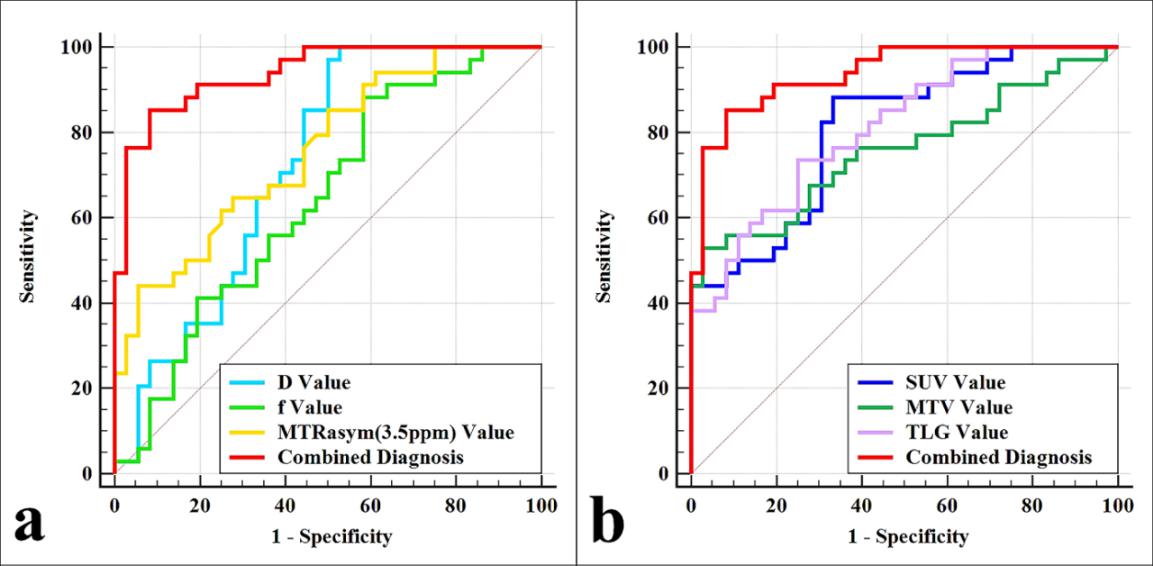
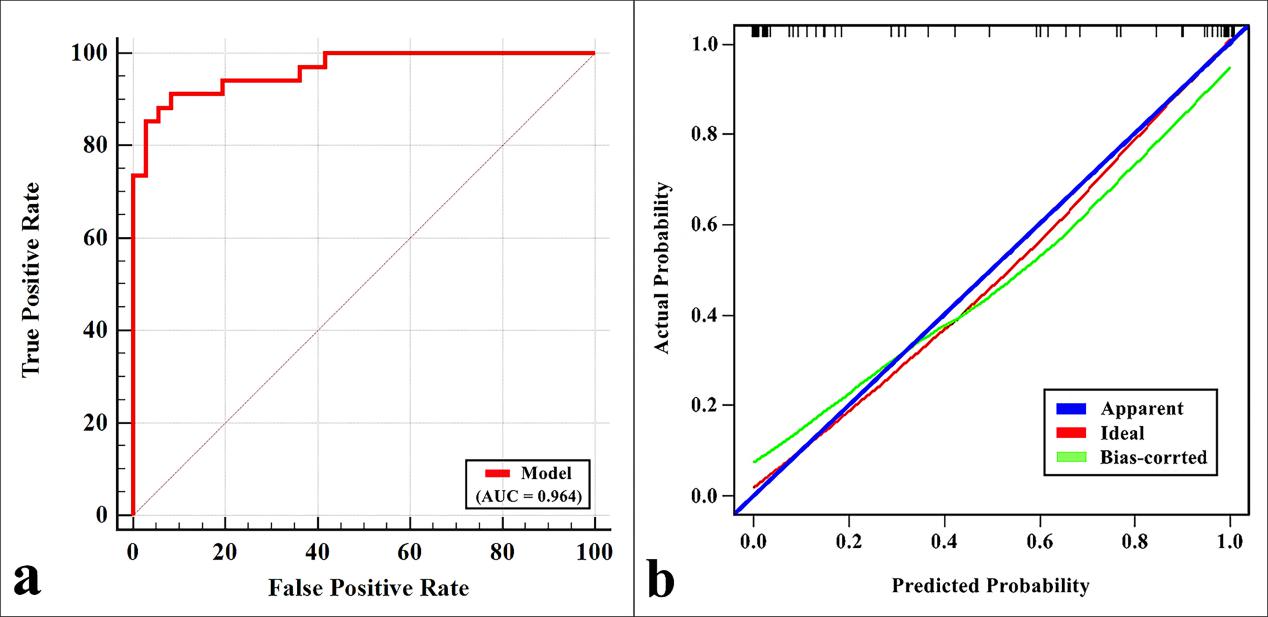
MTRasym (3.5 ppm), SUVmax, MTV, and TLG were higher and D and f were lower in PD-L1 positive NSCLC than in PD-L1 negative NSCLC (all P < 0.05), and there was no significant difference in ADC and D* between the two groups ( P = 0.960, 0.689). Univariate analysis showed that sex, maximum diameter, stage, grade, ADC, D, f, MTRasym (3.5 ppm), SUVmax, MTV, and TLG were predictors (all P < 0.1), and multivariate analysis revealed that only SUVmax, D, and MTRasym (3.5 ppm) were independent predictors. The combination of MTRasym (3.5 ppm), D, and SUVmax had the strongest predictive value for the differentiation of PD-L1 positive and PD-L1 negative NSCLC (AUC, 0.939; sensitivity, 85.29 %; specificity, 91.67 %; P all < 0.001). The verification model showed the combination of MTRasym (3.5 ppm), D, and SUVmax had the strongest predictive value, and its ROC curve and calibration curve showed good accuracy (AUC, 0.964) and consistency.Discussion
Compared with PD-L1 negative NSCLC, PD-L1 positive NSCLC contain more Glut1, and HIF-1α, more active cell proliferation, greater microvascular density, and more microscopic necrosis, which not only leads to a greater the uptake of 18F-FDG, also can limit the diffusion velocity of water molecules, and increase the level of blood perfusion and the contents of mobile proteins and polypeptides, leading to changes in signal intensity (SI) of multi-parametric 18F-FDG PET/MRI [6, 7, 8]. The rich microcirculatory perfusion of lung cancer and the poor reproducibility of D* may be the main reasons for no difference in ADC and D values between PD-L1 negative and positive groups in this study, respectively.Conclusion
Multi-parametric 18F-FDG PET/MRI is beneficial for the non-invasive assessment of PD-L1 expression status in NSCLC patients, and the combination of SUVmax, D, and MTRasym(3.5ppm) may serve as a prognostic biomarker to guide immunotherapy.Acknowledgements
This work was supported by the National Key R&D Program of China (2017YFE0103600), the National Natural Science Foundation of China (81720108021 and 31470047), the Zhongyuan Thousand Talents Plan Project - Basic Research Leader Talent (ZYQR201810117), the Zhengzhou Collaborative Innovation Major Project (20XTZX05015), and the Key Project of Henan Province Medical Science and Technology Project (LHGJ20210001, LHGJ20210005, LHGJ20190602), and the Henan provincial science and technology research projects (212102310689).References
1. Borghaei H, Paz-Ares L, Horn L, et al. Nivolumab versus Docetaxel in Advanced Nonsquamous Non-Small-Cell Lung Cancer. N Engl J Med. 2015;373(17): 1627-163 9.
2. Le Bihan D, Breton E, Lallemand D, Aubin ML, Vignaud J, Laval-Jeantet M. Separation of diffusion and perfusion in intravoxel incoherent motion MR imaging. Radiology. 1988; 168 (2):497-505.
3. Zhou J, Payen JF, Wilson DA, Traystman RJ, van Zijl PC. Using the amide proton signals of intracellular proteins and peptides to detect pH effects in MRI. Nat Med. 2003; 9(8): 1085-1090.
4. Ohno Y, Yui M, Koyama H, et al. Chemical Exchange Saturation Transfer MR Imaging: Preliminary Results for Differentiation of Malignant and Benign Thoracic Lesions. Radiology. 2016;279(2):578-589. 5. Yuan M, Pu XH, Xu XQ, et al. Lung adenocarcinoma: Assessment of epidermal growth factor receptor mutation status based on extended models of diffusion-weighted image. J Magn Reson Imaging. 2017;46(1):281-289.
6. Lopci E, Toschi L, Grizzi F, et al. Correlation of metabolic information on FDG-PET with tissue expression of immune markers in patients with non-small cell lung cancer (NSCLC) who are candidates for upfront surgery. Eur J Nucl Med Mol Imaging. 2016;43(11): 1954-1961.
7. Tekiki N, Fujita M, Okui T, et al. Dynamic contrast-enhanced MRI as a predictor of programmed death ligand-1 expression in patients with oral squamous cell carcinoma. Oncol Lett. 2021;22(5):778.
8. Togao O, Yoshiura T, Keupp J, et al. Amide proton transfer imaging of adult diffuse gliomas: correlation with histopathological grades. Neuro Oncol. 2014;16(3):441-448.
Figures