3850
Amide proton transfer weighted MR imaging in predicting the stiffness of meningiomas: a feasibility study1Radiology, Affiliated Hospital of Jining Medical University, Jining, China, 2Affiliated Hospital of Jining Medical University, Jining, China, 3GE Healthcare MR Research, Beijing, China, 4Zhujiang Hospital, Guangzhou, China
Synopsis
Stiffness of meningioma is an important factor affecting the surgical resection. In this study we aimed to explore if amide proton transfer-weighted MR imaging has clinical potential of predicting meningioma stiffness
Introduction
Meningioma constitutes approximately 36.7% of all primary central nervous system neoplasms. Over 90% of meningiomas have benign behaviours and are classified as WHO grade I[1; 2]. Surgical resection is the first choice for treating meningioma. The majority of meningiomas have a good prognosis if complete resection can be achieved. However, the stiffness of the meningioma is an important factor affecting the difficulty of surgical resection[3]. Previous studies used conventional, semi-quantitative, or quantitative MRI techniques to evaluate the stiffness of meningiomas. The usefulness is however still controversial or the techniques they used were not completely non-invasive[3-6]. Amide proton transfer weighted (APTw) MRI,relying on the mobile proton exchange between amide and bulk water, is sensitive to the concentration of amide protons and intracellular PH changes and thus has been extensively applied in brain tumor differentiation, grading and ischemic stroke detection[7]. For meningioma, multiple APTw studies have been applied to investigated tumor grading and tumor proliferation activity[8; 9]. However, no research has explored so far the feasibility of APTw MRI in predicting the stiffness of meningioma. In this study, we thus aimed to investigate this.Materials and Methods
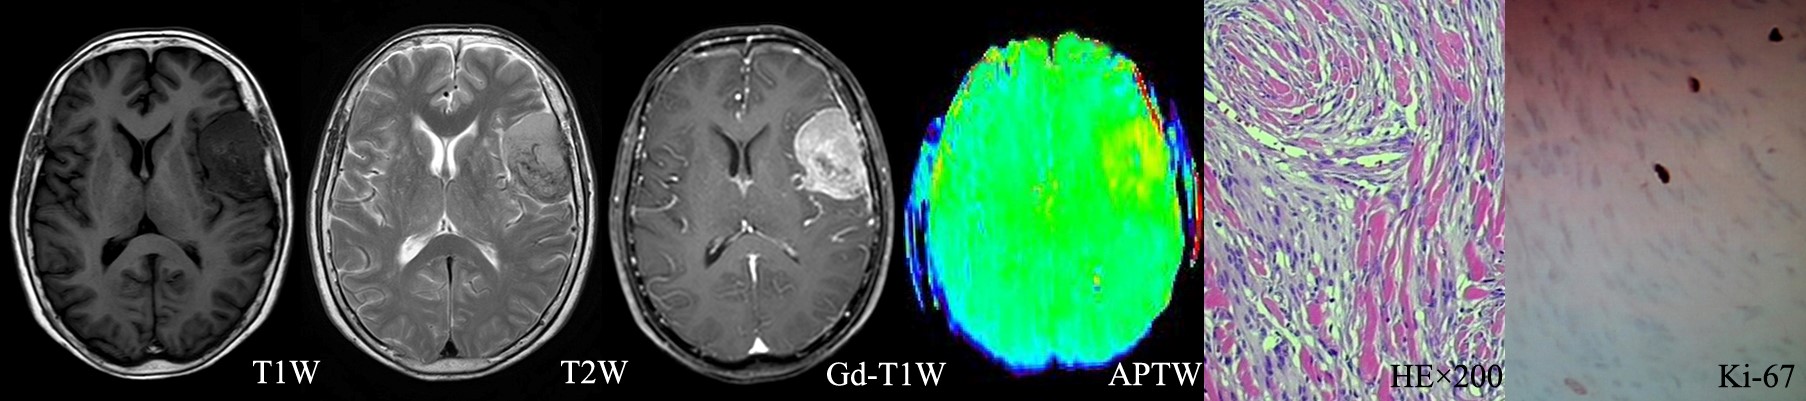
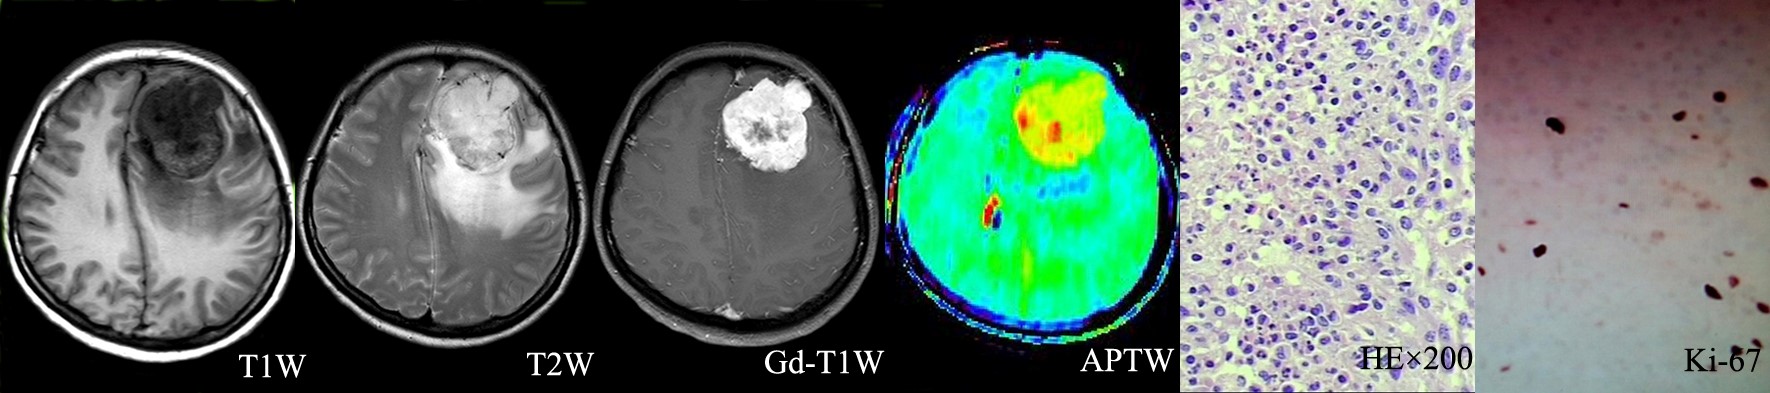
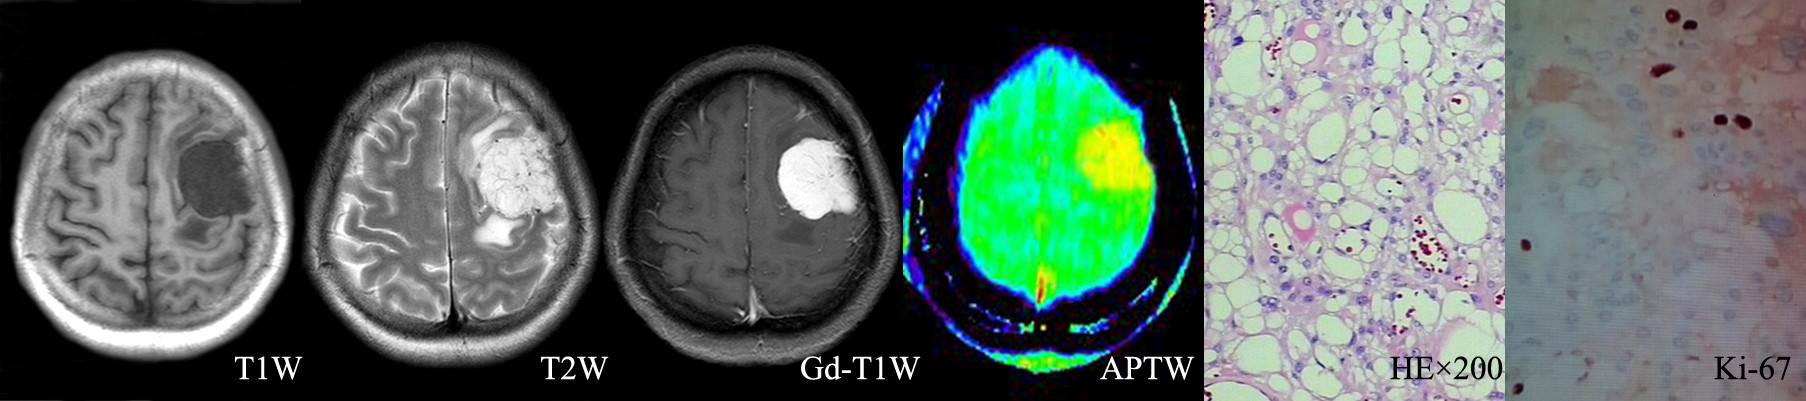
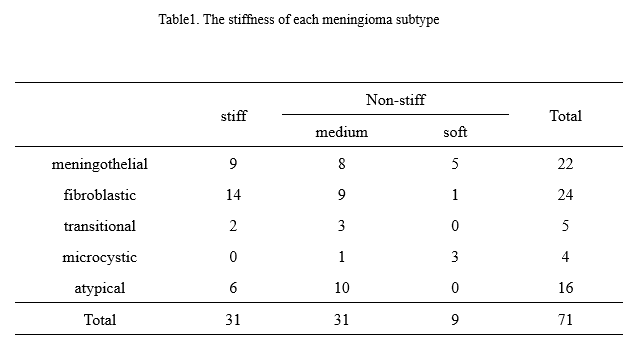
Local Ethics Committee approved this retroprospective study, and informed consent was obtained from all patients. Seventy-one patients who underwent preoperative routine MRI scan as well as APTw MRI were retrospectively assessed. All MR scans were performed on an 3T-MRI system (Discovery MR750w, GE Healthcare, Miwaukee, Wisconsin) with 32channel coil employed. Spin-echo echo-planar-imaging based APTw imaging was acquired. Images at 52 frequencies were acquired, including 49 frequencies ranging from -600 to 600 Hz with an increment of 25 Hz. The applied saturation B1 power was 2µt and the saturation duration was 2000ms. Other scan parameters were of TE=22.6ms, TR=3000ms, FOV=240×240mm2, matrix size=128×128 slice thickness=5mm, number of slice=3. Scan time was 7 mins. All acquired data were analyzed using vendor-provided APT postprocessing software at GE workstation 4.6. The resultant MTRasym ratio mapping for APTw imaging were obtained, and parameters, including the maximum APTw value (APTwmax), minimum APTw value (APTwmin) and mean APTw value (APTwmean), were applied to calculate the solid component at the maximal slice of the tumor. The stiffness of meningiomas were evaluated during the operation according to previous study[10]. All cases were divided into three groups, including 9 for soft, 31 for medium stiff, and 31 for stiff meningioma groups. One-way analysis of variance was used to compare the differences in APTwmin, APTwmean, and APTwmax parameters among soft, medium stiff, and stiff groups. The least significant difference method or Dunnett’s T3 test was selected for subsequent post-hoc test, according to Levene’s variance homogeneity test, to carry out pairwise comparison. Combined both soft and medium stiff group into non-stiff group, two-independent-sample t-test was used to compare the differences of APTwmin, APTwmean and APTwmax parameters between the stiff and non-stiff groups. The receiver operating characteristic (ROC) curve and area under the curve were used to evaluate the diagnostic efficiency of APTw parameters in distinguishing meningiomas with different stiffness. P<0.05 was considered statistically significance.Results and discussion
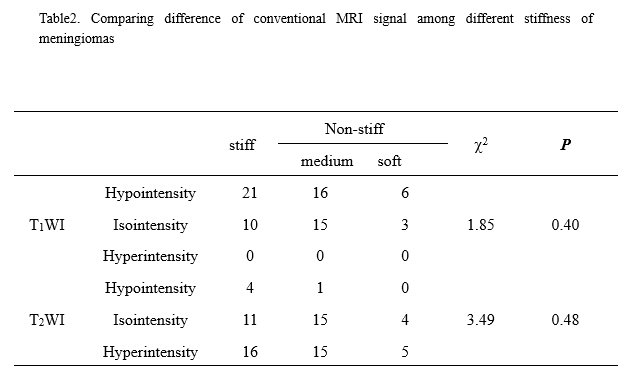
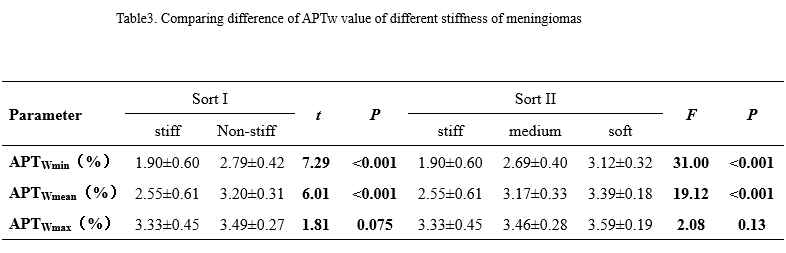
The stiffness of enrolled meningiomas were summaried in table 1. No significant differences in APTwmax were identified among three groups(P=0.13). APTwmin in stiff group was significantly lower than that in soft group and medium stiff group ( both P < 0.001, respectively), and in medium stiff group was significantly lower than that in soft group (P=0.023). APTwmean was significantly lower in stiff group than soft group or medium stiff group (both P<0.001, respectively). However, there was no significant difference between the soft and medium stiff group (P = 0.19). There was no difference in APTwmax between the stiff and non-stiff groups (P=0.075), However, APTwmin and APTwmean were significantly higher in the stiff group (P < 0.001, respectively). According to the ROC analysis, APTwmin was shown with the highest AUC of 0.913. When APTwmin was lower than the cut-off value of 2.4%, meningioma was assessed as stiffness lesion. The sensitivity, specificity, and accuracy were 87.1%, 87.5%, and 85.9%, respectively.Conclusion
In summary, meningiomas with different stiffness have particular characteristics on APTw images. We thus consider that APTw may be a supplementary clinical method, providing a new research direction in predicting meningioma stiffness.Acknowledgements
No acknowledgement found.References
1 Louis DN, Perry A, Reifenberger G, et al The 2016 World Health Organization Classification of Tumors of the Central Nervous System: a summary.
2 Osawa T, Tosaka M, Nagaishi M, Yoshimoto Y (2013) Factors affecting peritumoral brain edema in meningioma: special histological subtypes with prominently extensive edema. Journal of neuro-oncology 111:49-57
3 Miyoshi K, Wada T, Uwano I, et al (2020) Predicting the consistency of intracranial meningiomas using apparent diffusion coefficient maps derived from preoperative diffusion-weighted imaging. Journal of neurosurgery. 10.3171/2020.6.jns20740:1-8
4 Cepeda S, Arrese I, García-García S, et al (2021) Meningioma Consistency Can Be Defined by Combining the Radiomic Features of Magnetic Resonance Imaging and Ultrasound Elastography. A Pilot Study Using Machine Learning Classifiers. World neurosurgery 146:e1147-e1159
5 Shiroishi MS, Cen SY, Tamrazi B, et al (2016) Predicting Meningioma Consistency on Preoperative Neuroimaging Studies. Neurosurgery clinics of North America 27:145-154
6 Watanabe K, Kakeda S, Yamamoto J, et al (2016) Prediction of hard meningiomas: quantitative evaluation based on the magnetic resonance signal intensity. Acta radiologica (Stockholm, Sweden : 1987) 57:333-340
7 Zhou J, Payen JF, Wilson DA, Traystman RJ, van Zijl PC (2003) Using the amide proton signals of intracellular proteins and peptides to detect pH effects in MRI. Nature medicine 9:1085-1090
8 Joo B, Han K, Choi YS, et al (2018) Amide proton transfer imaging for differentiation of benign and atypical meningiomas. European radiology 28:331-339
9 Yu H, Wen X, Wu P, et al (2019) Can amide proton transfer-weighted imaging differentiate tumor grade and predict Ki-67 proliferation status of meningioma? European radiology 29:5298-5306
10 Sitthinamsuwan B, Khampalikit I, Nunta-aree S, Srirabheebhat P, Witthiwej T, Nitising A (2012) Predictors of meningioma consistency: A study in 243 consecutive cases. Acta neurochirurgica 154:1383-1389
Figures