3849
Voxel-based quantitative mapping of glioma heterogeneity for the differentiation of IDH genotype using CEST-MRI1Institute of Science and Technology for Brain-Inspired Intelligence, Fudan University, Shanghai, China
Synopsis
The identification of the isocitrate dehydrogenase mutant (IDHMUT) glioma and IDH wild-type (IDHWT) glioma has significant diagnostic, prognostic, and therapeutic implications. In this work, we evaluated the non-invasive prediction of IDH mutation status in glioma mice by employing a combination of high spectral resolution CEST MRI at 11.7T together with data analysis using machine learning approaches. We demonstrated that in vivo CEST signals correspond very well with glioma genotypes. Among several CEST signals, the signals at Δω =3.5 ppm may serve as the major indicator to differentiate the IDH genotype glioma from other types.
Introduction
The identification of isocitrate dehydrogenase (IDH) mutation in gliomas has significant diagnostic, prognostic, and therapeutic implications1. Chemical exchange saturation transfer (CEST) MRI has emerged as a noninvasive imaging technique for tumor metabolism with high sensitivity and spatial resolution2–4. Voxel-based quantitative mapping of CEST contrasts may provide more information for showing glioma heterogeneity and thus be used to detect different glioma genotypes, such as IDH mutation. In the present work, we obtained high-resolution CEST MRI for glioma mice brain at 11.7T and quantified different CEST contrasts using Lorentzian difference (LD) analysis and multi-pool Lorentzian fit5. We aim to quantify the contributions of the isolated CEST signals in differentiating glioma from normal tissue and IDH genotype using machine learning algorithms6,7.Materials and Methods
Animal model: All experimental protocols were approved by the Animal Ethics Committee of Fudan University. Male C57BL/6 mice (20−22g) were purchased from Shanghai SLCA laboratory animal Co., Ltd (Shanghai, China). GL261 glioma cells were stereotaxically injected into the right striatum to establish two glioma models, IDHWT and IDHMUT.Data Acquisition: MRI experiments were performed at an 11.7T BioSpec 117/16 USR MRI system equipped with a CryoProbeTM (Bruker BioSpin, Ettlingen, Germany).T2-weighted images of the whole brain were acquired using a RARE sequence with the following parameters: TR/TE, 3000/30 ms; spatial resolution, 0.07 × 0.07 × 0.6 mm3. Single-slice CEST images were obtained by a continuous wave (CW) RF irradiation (B1= 1mT) followed by a RARE sequence to readout with parameters: TR/TE=5000/38ms, spatial resolution, 0.2 × 0.2 × 0.6 mm3. Saturation offsets were distributed between –10 and 10ppm with denser sampling between –5 and 5ppm and S0 was set at 200 ppm.
Data analysis: After normalization, B0 correction, and adaptive denoising8, Lorentzian difference (LD) analysis and multi-pool Lorentzian fit were combined to extract multiple CEST effects5. CEST residual spectra created by subtracting the measured Z spectra from the two-pool fitting spectra were further fitted with six-pool Lorentzian functions (amide, amine (2.7), amine (2.0), hydroxyl, NOE (-1.6), NOE (-3.5)) to isolate each CEST contrast map (Ampmfit). For glioma segmentation, Gaussian Mixture Model (GMM) clustering, an unsupervised clustering model, was used with various combinations of different pool contributions obtained from six-pool fit as the input data. The Dice similarity coefficient was calculated by the mean of ten iterations to evaluate the performance of the model. Then voxel-based approach and extreme gradient boosting (XGboost) were applied for the prediction of IDH genotype. Hyper-parameters were determined by grid search based on 10-fold cross-validation and the contribution of each pool was quantified by calculating the feature importance.
Results and Discussion
Figure 1(a) shows a Z spectrum (red) in a normal mouse brain and corresponding two-pool Lorentzian fit (blue). The LD (green) shows distinct peaks at 3.5ppm, 2ppm and -3.5ppm, and relative distinct peaks at 2.6~2.7ppm, 1ppm~1.2ppm, and -1.8ppm~-1.6ppm. Therefore, as shown in Figure 1(b), six pools were contained in the following multi-pool fitting. Figure 1(c), (d) shows mean value of six-pool spectra from all voxels in IDHWT (n=6) and IDHMUT(n=7) glioma regions, respectively. Note that glioma CEST signals in IDHWT group were generally higher than that in IDHMUT group, except for the signal at 1~1.2ppm. Figure 2(a) presents CEST amplitude maps (Ampmfit) acquired with six-pool Lorentzian fits of IDHWT (middle), IDHMUT (bottom), and CON (top) groups, respectively. Compared with contralateral normal brain tissues, both IDHWT and IDHMUT groups show hypo CEST contrasts of L1(3.5), L2(2.7), L3(2.0), L5(-1.6), L6(-3.5) in tumor tissues while higher L4(1.2) signal, especially in IDHMUT group. Histogram analysis (Figure 2(b)) of voxel-based Ampmfit maps reveal a clear distinction between IDHWT and IDHMUT groups except for amine (2.7). Note that signal intensities in normal brain tissue of the three groups are relatively closer. To further investigate the relationship between CEST effects and IDH glioma, we estimated the contributions of different CEST pools in differentiating glioma from normal tissue as well as the IDH genotype using machine learning approaches. Table 1 presents the DICE index of glioma segmentation for various combinations of different pool contributions using the GMM algorithm. The maximum dice of each combination with the same number of pools is underlined and bold. The L6(-3.5) signal showed the most effective for discriminating glioma from normal tissue. However, for the differentiation of the IDH genotype, L6(-3.5) showed the best performance with feature importance of 57%, which may be a marker for the differentiation of the IDH genotype.Conclusion
In this work, we evaluated the non-invasive prediction of IDH mutation status in glioma mice by employing a combination of high spectral resolution CEST MRI at 11.7T together with data analysis using machine learning approaches. Our results demonstrate that among several CEST signals, the signals at Δω =3.5 ppm may serve as the major indicator to differentiate the IDH genotype glioma from other types. Further study of larger sample size is necessary to confirm current conclusion.Acknowledgements
This work was supported by grants from the National Natural Science Foundation of China (81873893), Three-year action plan for key global partners (IDH6282008/050/001/004), and Shanghai Municipal Science and Technology Major Project (2018SHZDZX01), ZJLab, and Shanghai Center for Brain Science and Brain-Inspired Technology.References
1. Louis, D. N. et al. The 2016 World Health Organization Classification of Tumors of the Central Nervous System: a summary. Acta Neuropathologica vol. 131 803–820 (2016).
2. Consolino, L. et al. Non-invasive Investigation of Tumor Metabolism and Acidosis by MRI-CEST Imaging. Front. Oncol. 10, 161 (2020).
3. Paech, D. et al. Assessing the predictability of IDH mutation and MGMT methylation status in glioma patients using relaxation-compensated multipool CEST MRI at 7.0 T. Neuro. Oncol. 20, 1661–1671 (2018).
4. Eberhart, C. G. et al. Predicting IDH mutation status in grade II gliomas using amide proton transfer-weighted (APTw) MRI. Magn. Reson. Med. 78, 1100–1109 (2017).
5. Zaiss, M. et al. Chemical exchange saturation transfer MRI contrast in the human brain at 9.4 T. Neuroimage 179, 144–155 (2018).
6. Zhao, B. et al. AUCseg: An Automatically Unsupervised Clustering Toolbox for 3D-Segmentation of High-Grade Gliomas in Multi-Parametric MR Images. Front. Oncol. 11, 1–8 (2021).
7. Sakai, Y. et al. MRI radiomic features to predict idh1 mutation status in gliomas: A machine learning approach using gradient tree boosting. Int. J. Mol. Sci. 21, 1–27 (2020).
8. Breitling, J. et al. Adaptive denoising for chemical exchange saturation transfer MR imaging. NMR Biomed. 32, 1–14 (2019).
Figures
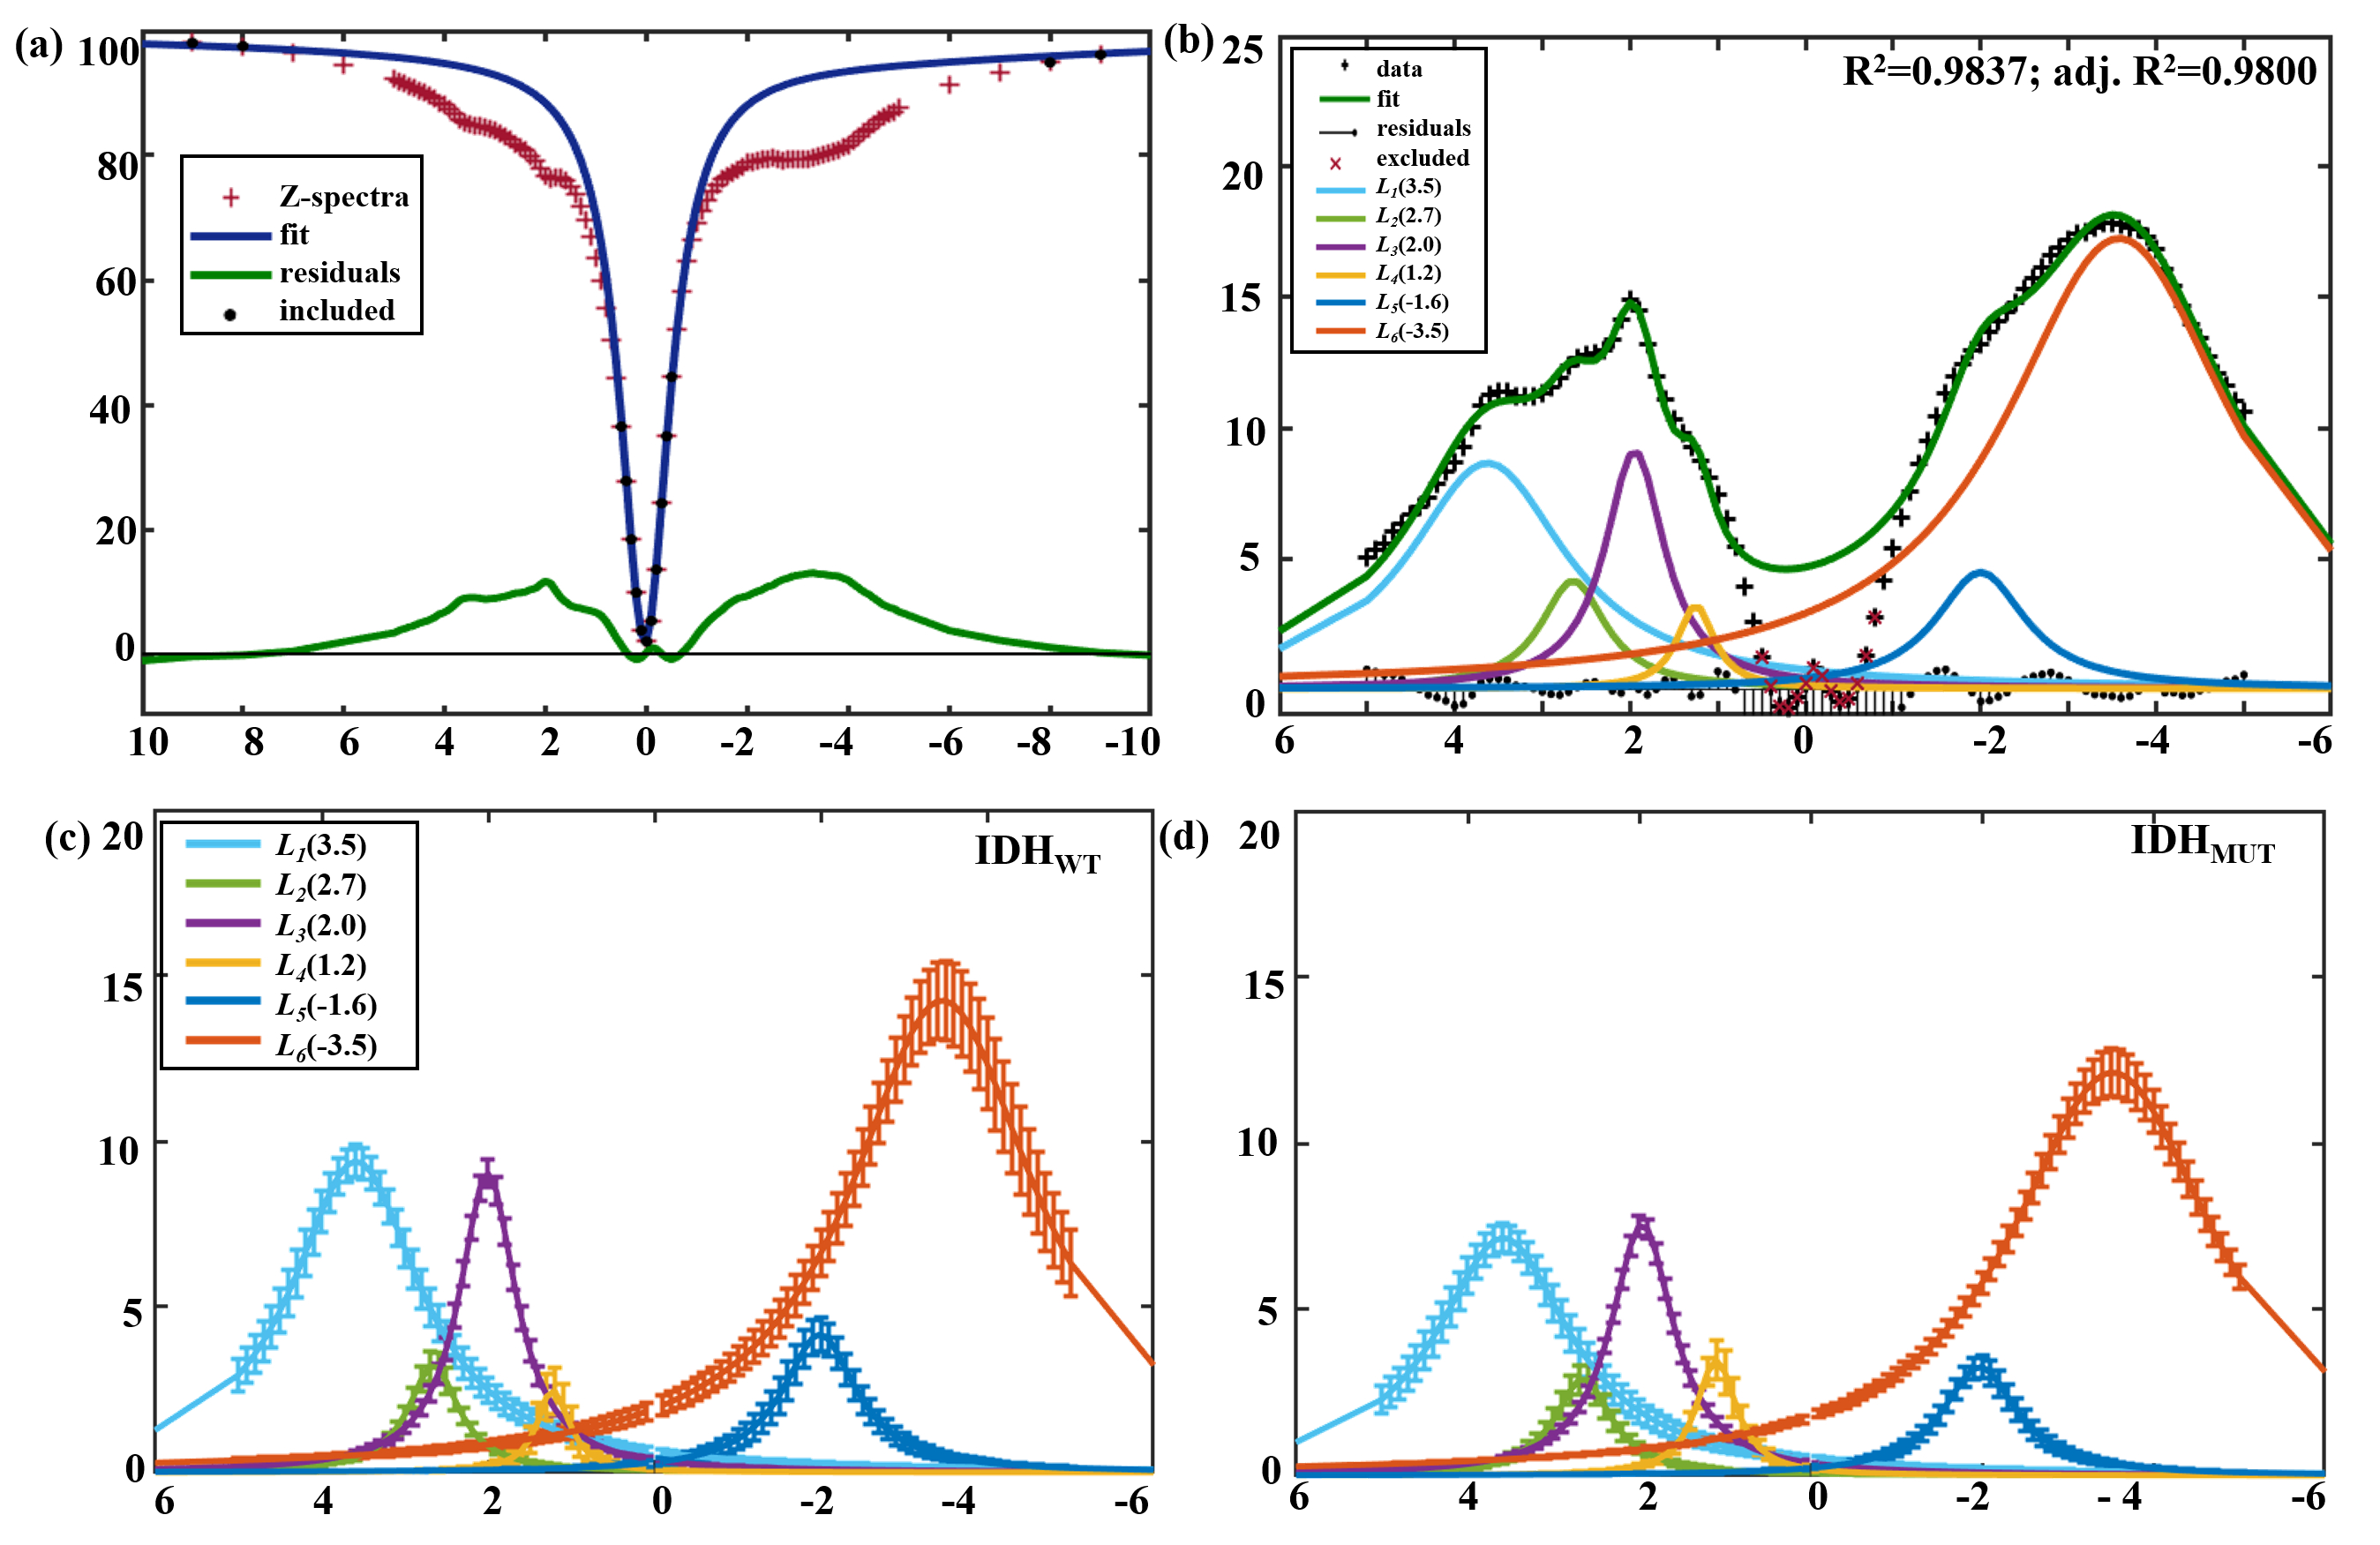
Figure 1 (a) Representative two-pool Lorentzian fitting to remove DS and MT effects in brain tissue of healthy mice. (b) Representative six-pool Lorentzian fitting results in brain tissue of healthy mice. (c), (d) Mean value and standard deviation using six-pool fitting from all voxels in glioma regions from IDHWT (n=6) and IDHMUT(n=7) groups, respectively.
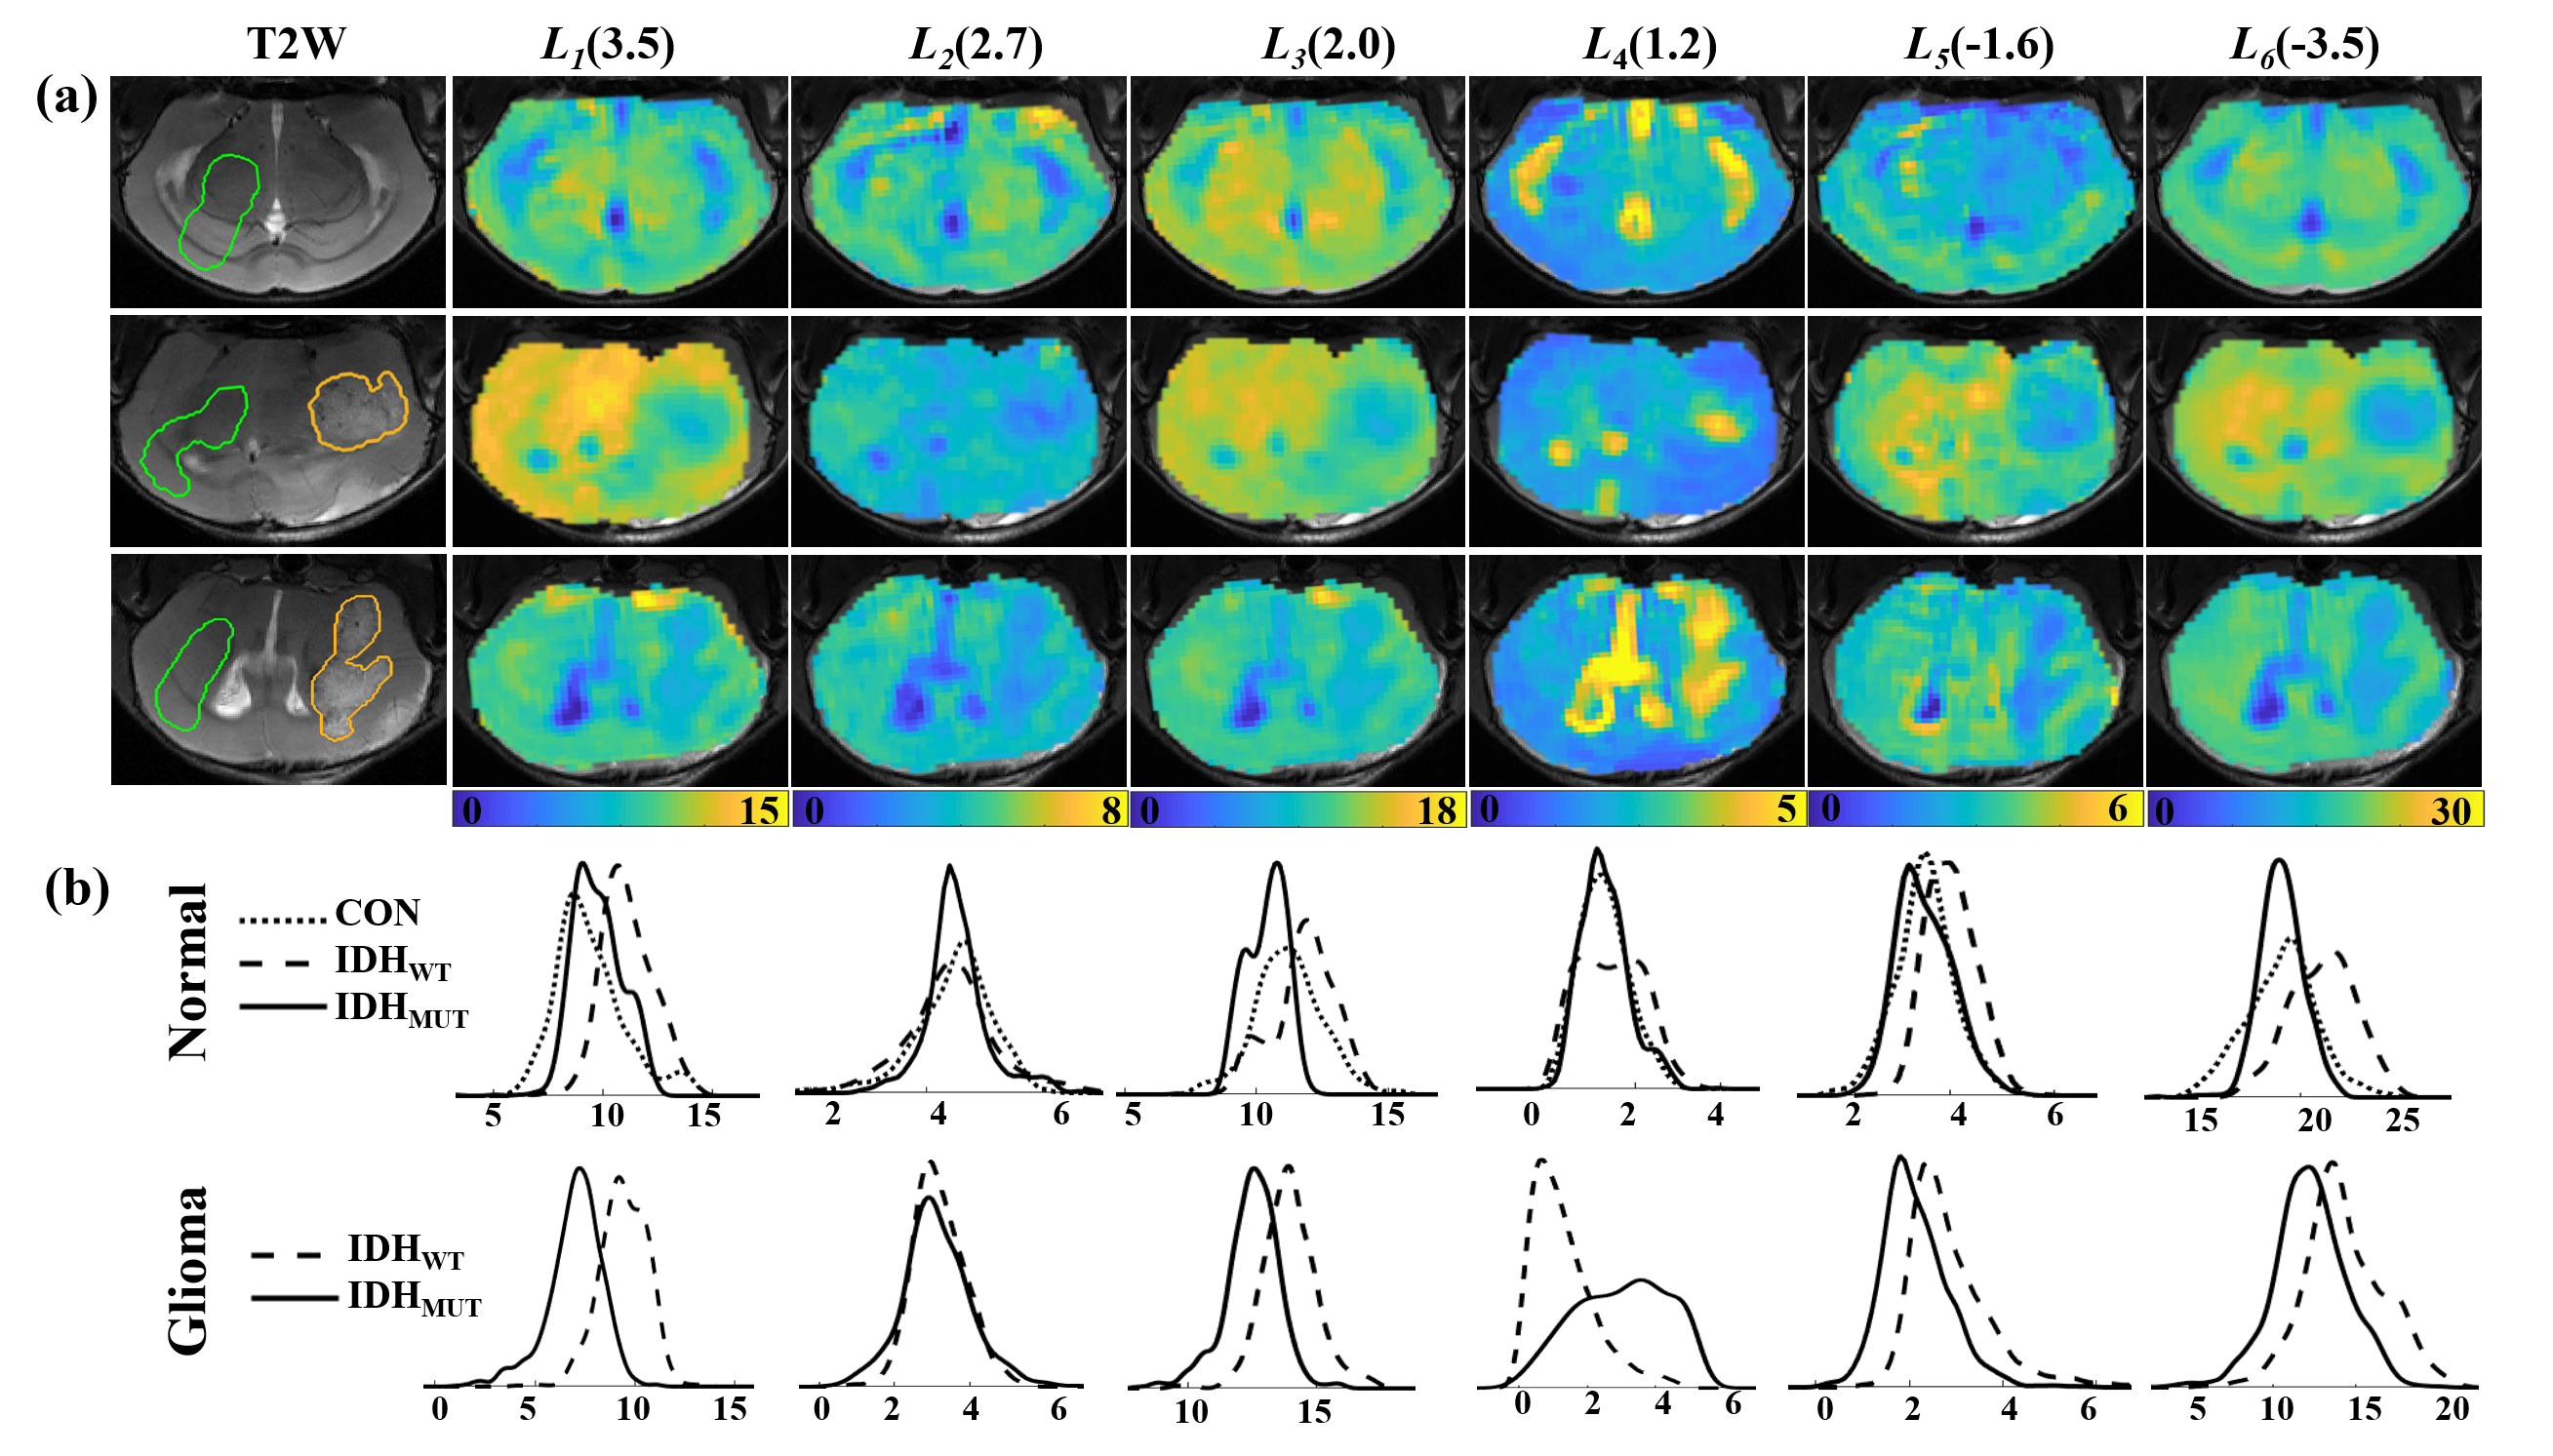
Figure 2 (a) Representative amplitude maps of six-pool Lorentzian fitting (Ampmfit) at different offsets in three groups: IDHWT (middle), IDHMUT (bottom), and CON (top). The glioma (yellow) and normal (green) regions of interest were indicated by the curves superimposed on T2WI in the left column. (b)The histogram analysis based on voxel-based Lorentzian amplitude fitting. Top raw: CEST contrasts come from contralateral normal tissue in groups of IDHWT, IDHMUT, and CON (n=8). Bottom raw: CEST contrasts come from glioma region in IDHWT(n=6) and IDHMUT(n=7) groups.
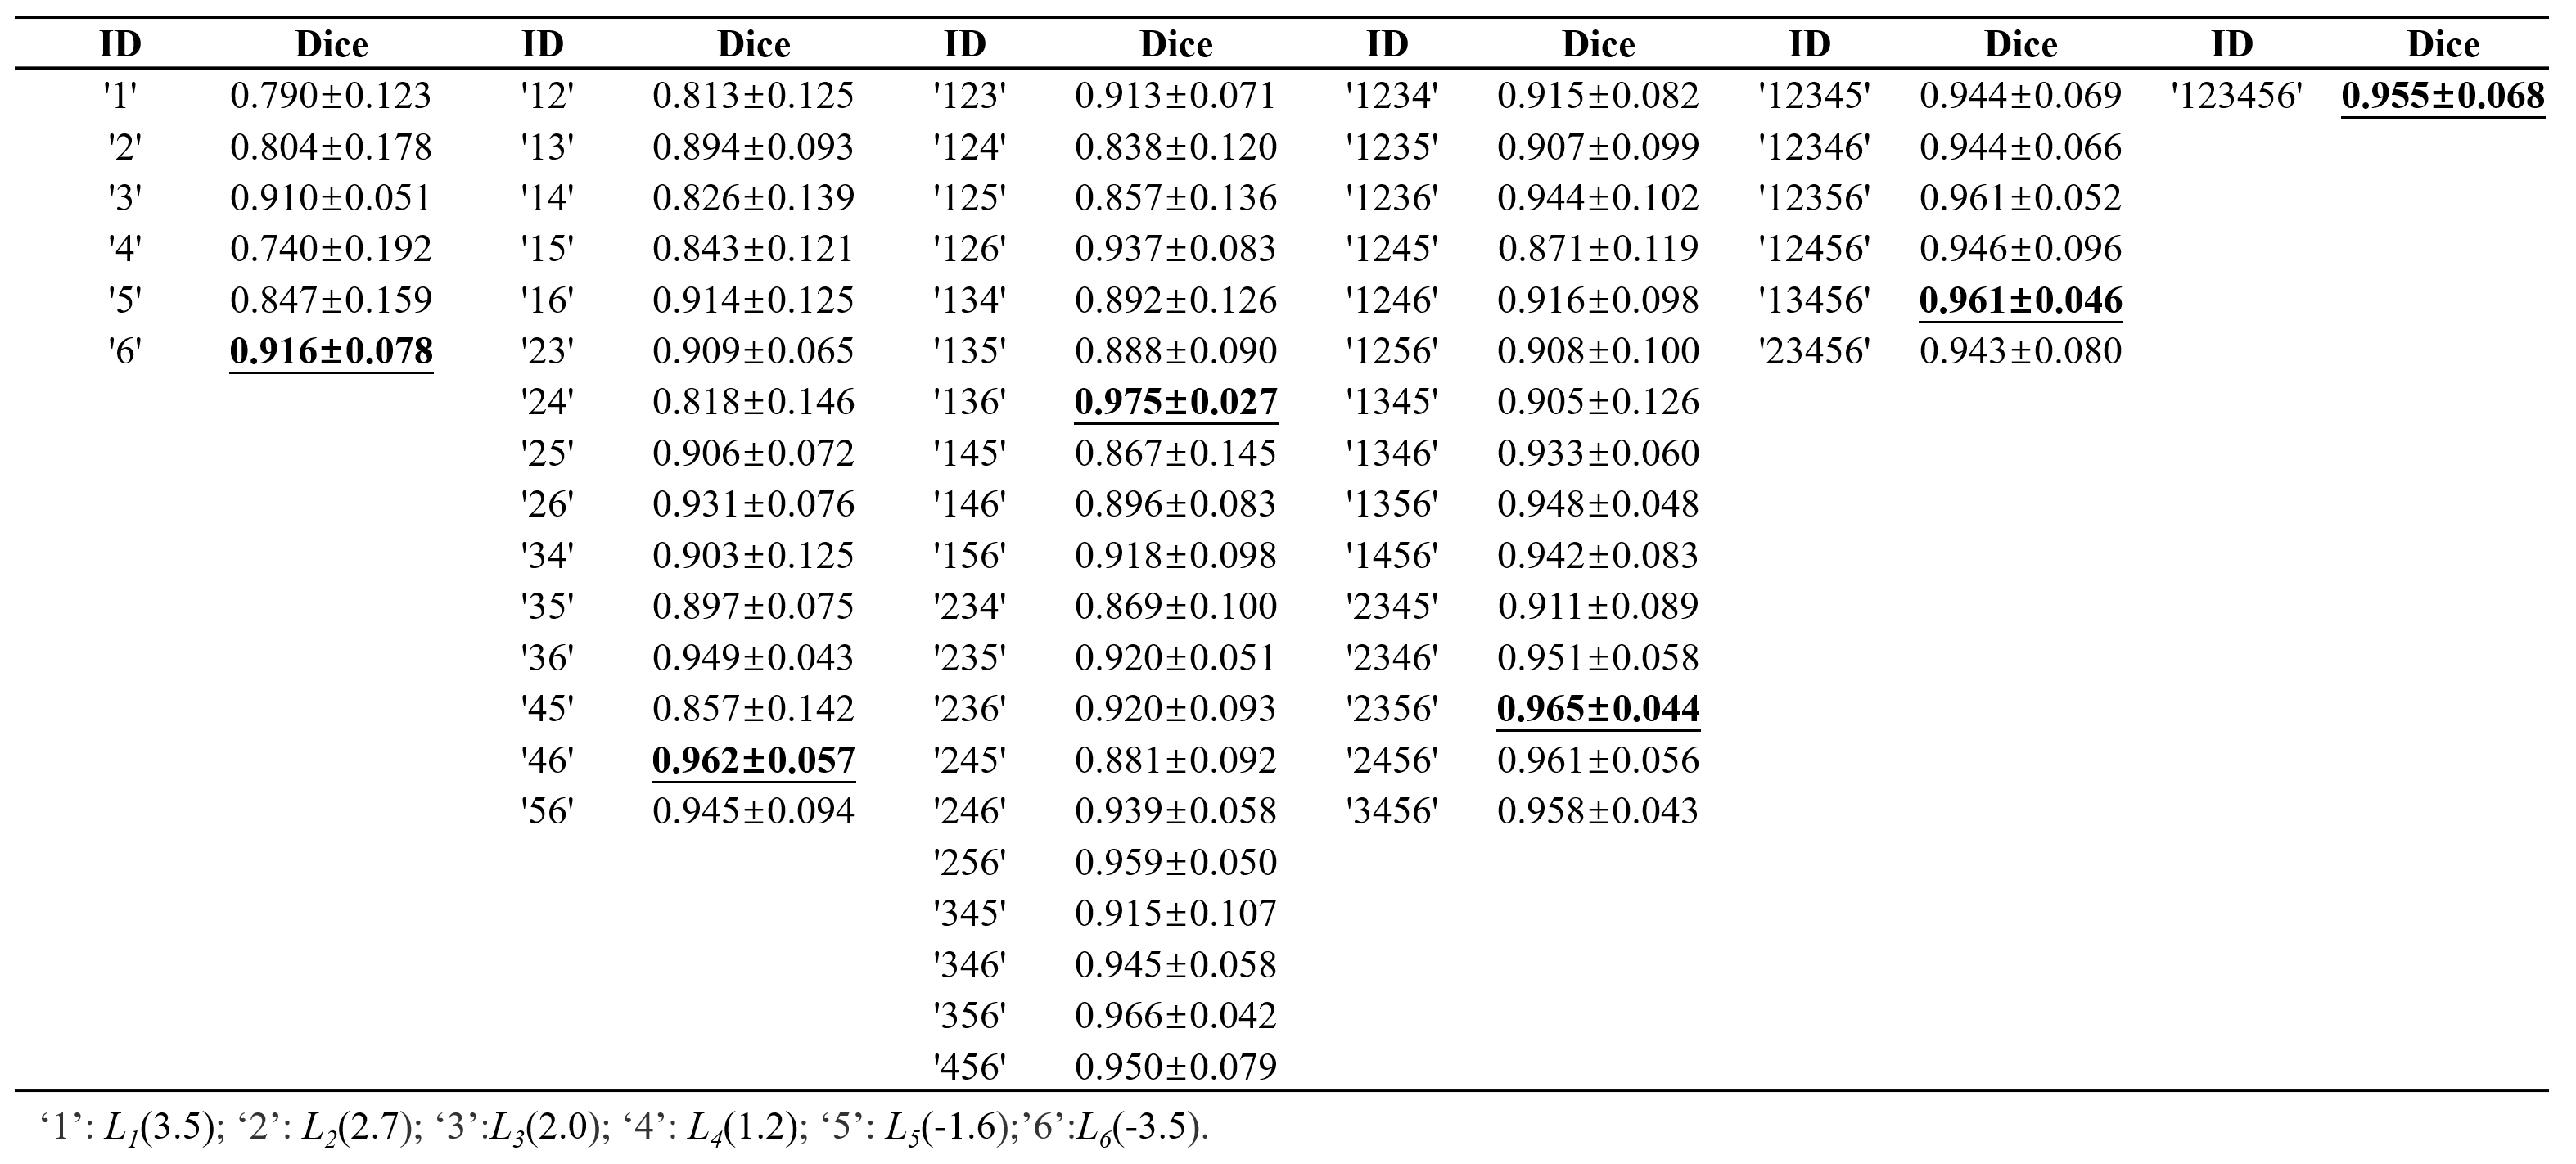
Table 1 DICE index of glioma segmentation for various combinations of different pool contributions.
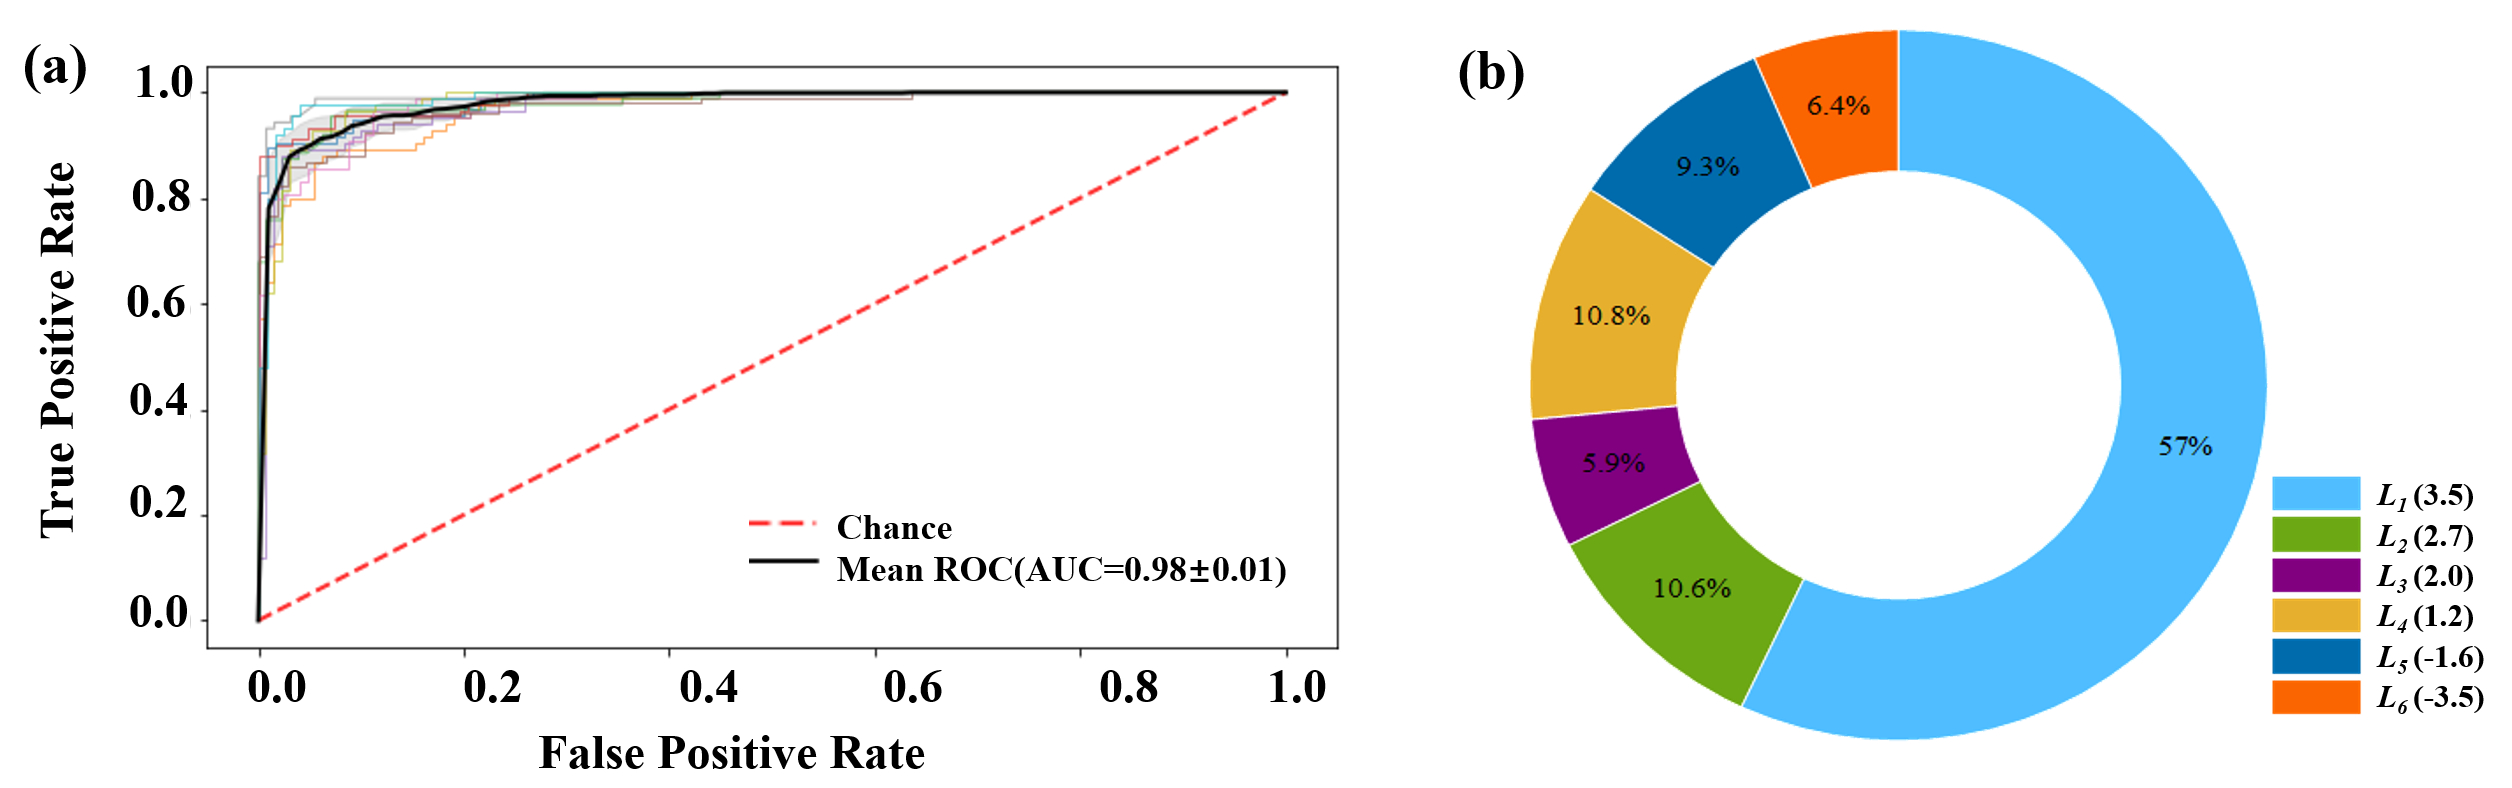
Figure 3 (a) ROC curve of six-pool contrasts using XGBoost classifier with 10-fold cross-validations in prediction differentiation of IDH genotype. (b) The pie chart shows the feature importance of several CEST pools (amide, amine (2.7), amine (2.0), hydroxyl, NOE (-1.6), NOE (-3.5)) for the differentiation of IDH genotype.