3848
Quasi-steady-state reconstruction provides fast equilibrium APT imaging of brain tumor patients at 3T1Shenzhen Institute of Advanced Technology, Chinese Academy of Sciences, Shenzhen, China, 2National Cancer Center/National Clinical Research Center for Cancer/Cancer Hospital & Shenzhen Hospital, Chinese Academy of Medical Sciences and Peking Union Medical College, Shenzhen, China, 3GE Healthcare, Beijing, China, 4Emory University School of Medicine, Atlanta, GA, United States
Synopsis
APT MRI scans are often performed under non-equilibrium conditions, confounding imaging quantification and tissue characterization. This study proposed a quasi-steady-state (QUASS) algorithm for fast and accurate tumor APT imaging. Seven healthy volunteers and nineteen tumor patients were scanned at 3T, with two representative RF saturation times (Ts) and relaxation delays (Td). The routine APT measures significantly varied with Ts and Td (P<.001) and were significantly smaller than the corresponding QUASS indices (P<.001). In contrast, QUASS reconstruction results showed little dependence on scan protocols (P>.05). The QUASS algorithm enables robust APT imaging, promising to expedite and standardize clinical APT tumor MRI.
Introduction
Amide proton transfer (APT) is a specific chemical exchange saturation transfer (CEST) MRI sensitizing to mobile proteins/peptides and tissue pH. Its measurement depends not only on tissue properties but also on scan parameters [1, 2], including the radiofrequency (RF) saturation time (Ts) and the relaxation delay (Td) [3, 4]. However, nearly all CEST scans have been performed under non-equilibrium conditions due to scan time, SAR, or hardware constraints, making APT measurement highly variable among studies. Thus, there is an unmet need to standardize the APT measurements across studies and facilitate its adoption in the clinical setting. This study proposed a quasi-steady-state (QUASS) postprocessing algorithm to reconstruct the equilibrium APT effect from experimental measurements and also demonstrated its feasibility to provide fast and accurate imaging of brain tumor patients at 3T.Materials and Methods
The local Institutional Review Board approved the study. Written informed consents were obtained from all participants. Seven healthy volunteers and nineteen patients with confirmed brain tumors were prospectively enrolled in the study. MRI scans were conducted on a 3T scanner (Discovery MR 750w, GE), including T1 inversion recovery MRI (TR/TE=5 s/7.7 ms, inversion time (TI) = 200, 500, 800, 1100, and 1400 ms), CEST MRI with a fat-suppressed single-shot FSE image readout (TE = 26 ms, saturation power B1=1.0 μT, frequency offsets between ±600 Hz with intervals of 20 Hz in addition to three unsaturated scans), and Gd-enhanced T1w FLAIR imaging (TR/TE/TI=3000/26/870 ms). The CEST signal evolution was modeled during the relaxation recovery and CEST labeling, from which the QUASS CEST effect is derived [5, 6]. The measured and QUASS-reconstructed Z spectra were compared under different CEST labeling times (Ts) and relaxation delays (Td) of 1 s/1 s and 2 s/2 s. In addition, APT, combined magnetization transfer (MT) and nuclear overhauser enhancement (NOE) effects, and direct water saturation were isolated using a 3-pool Lorentzian fitting in white matter (WM) and gray matter (GM) of healthy volunteers and for patients, in contralateral normal-appearing white matter (CNAWM) and tumor regions. The student's t-test was performed between conventional and QUASS CEST measurements, and P values<.05 were considered statistically significant.Results
Figure 1 shows two CEST Z-spectra from an ROI in the WM of a representative healthy volunteer. The Z-spectrum acquired using short Ts/Td (1s/1s) was substantially higher than that with the long Ts/Td of 2s/2s (Figure 1a), resulting in a difference in resolved CEST effects (Figure 1b). In comparison, the QUASS Z-spectra (Figure 1c) were nearly identical for the two sets of Ts/Td parameters. Note that QUASS Z-spectra were lower than the apparent Z-spectra, suggesting that 2s was not sufficiently long to obtain the equilibrium state. In addition, QUASS Z-spectra and resolved APT and combined MT & NOE curves overlapped well between different Ts/Td, indicating robust CEST quantification (Figure 1d).Figure 2 compares apparent and QUASS APT maps of a representative healthy volunteer. The histograms show the apparent APT maps increase with Ts/Td. In comparison, QUASS APT maps were consistent between different Ts/Td values than the apparent APT maps.
Similarly, consistent QUASS CEST MRI results were observed in tumor patients. Figure 3 shows images of a meningioma patient. Compared with the CNAWM, the Gd-enhanced tumor region exhibits hyperintensity in T1 and APT images. The magnitude of the apparent APT effect increased with the Ts/Td. In comparison, QUASS APT images were substantially stronger than the apparent APT images. Whereas the apparent APT effect showed little hyperintensity, the QUASS APT displayed a signal increase in the region of Gd enhancement.
We tested the correlation and consistency of the apparent and QUASS measurements obtained under different Ts/Td. The apparent measurements deviated noticeably from the identity line (Figure 4a). The Bland-Altman plots showed that apparent APT had a significant shift between different Ts/Td (Figure 4b). In comparison, the QUASS measurements were in good agreement (Figure 4c). Also, Bland-Altman plots showed that QUASS APT exhibited excellent consistency (Figure 4d) between different Ts/Td.
Table 1 compares the apparent and QUASS APT measurements under different Ts/Td. For both healthy volunteers (WM and GM) and tumor patients (CNAWM and tumor), the apparent APT signals increased significantly with Ts/Td and were significantly lower than respective QUASS measurements (P<.001). In comparison, QUASS APT signals were consistent with little dependence on Ts/Td (P>.05).
Discussion and Conclusion
APT imaging has been routinely performed under non-equilibrium conditions, and hence the experimental conditions notably confound the experimental findings. Such a complex dependency hinders the transition of APT MRI from a research tool to a versatile and quantitative biomarker ready for multi-center experiments. The proposed QUASS APT protocol addresses this unmet need by minimizing the impact of imaging parameters on APT quantification. As a result, it expedites APT scans without loss in accuracy, improving the quantification of the contrast mechanism. In addition, the approach is promising to help standardize APT imaging analysis and facilitate future multi-center trials.Acknowledgements
Grant Support: National Natural Science Foundation of China (81871348 and 91859102).References
1. Kim J, Wu Y, Guo Y, Zheng H, Sun PZ. A review of optimization and quantification techniques for chemical exchange saturation transfer MRI toward sensitive in vivo imaging. Contrast Media & Molecular Imaging 2015;10:163-178
2. Dula AN, Dewey BE, Arlinghaus LR et al. Optimization of 7-T chemical exchange saturation transfer parameters for validation of glycosaminoglycan and amide proton transfer of fibroglandular breast tissue. Radiology 2015;275:255-261
3. Sun PZ, Lu J, Wu Y, Xiao G, Wu R. Evaluation of the dependence of CEST-EPI measurement on repetition time, RF irradiation duty cycle and imaging flip angle for enhanced pH sensitivity. Physics in Medicine and Biology 2013;58:N229-240
4. Zaiss M, Angelovski G, Demetriou E, McMahon MT, Golay X, Scheffler K. QUESP and QUEST revisited - fast and accurate quantitative CEST experiments. Magnetic Resonance in Medicine 2018;79:1708-1721
5. Sun PZ. Quasi-steady state chemical exchange saturation transfer (QUASS CEST) analysis-correction of the finite relaxation delay and saturation time for robust CEST measurement. Magnetic Resonance in Medicine 2021;85(6):3281-9
6. Zhang XY, Zhai Y, Jin Z, Li C, Sun PZ, Wu Y. Preliminary demonstration of in vivo quasi-steady-state CEST postprocessing-Correction of saturation time and relaxation delay for robust quantification of tumor MT and APT effects. Magnetic Resonance in Medicine 2021;86(2):943-53.
Figures
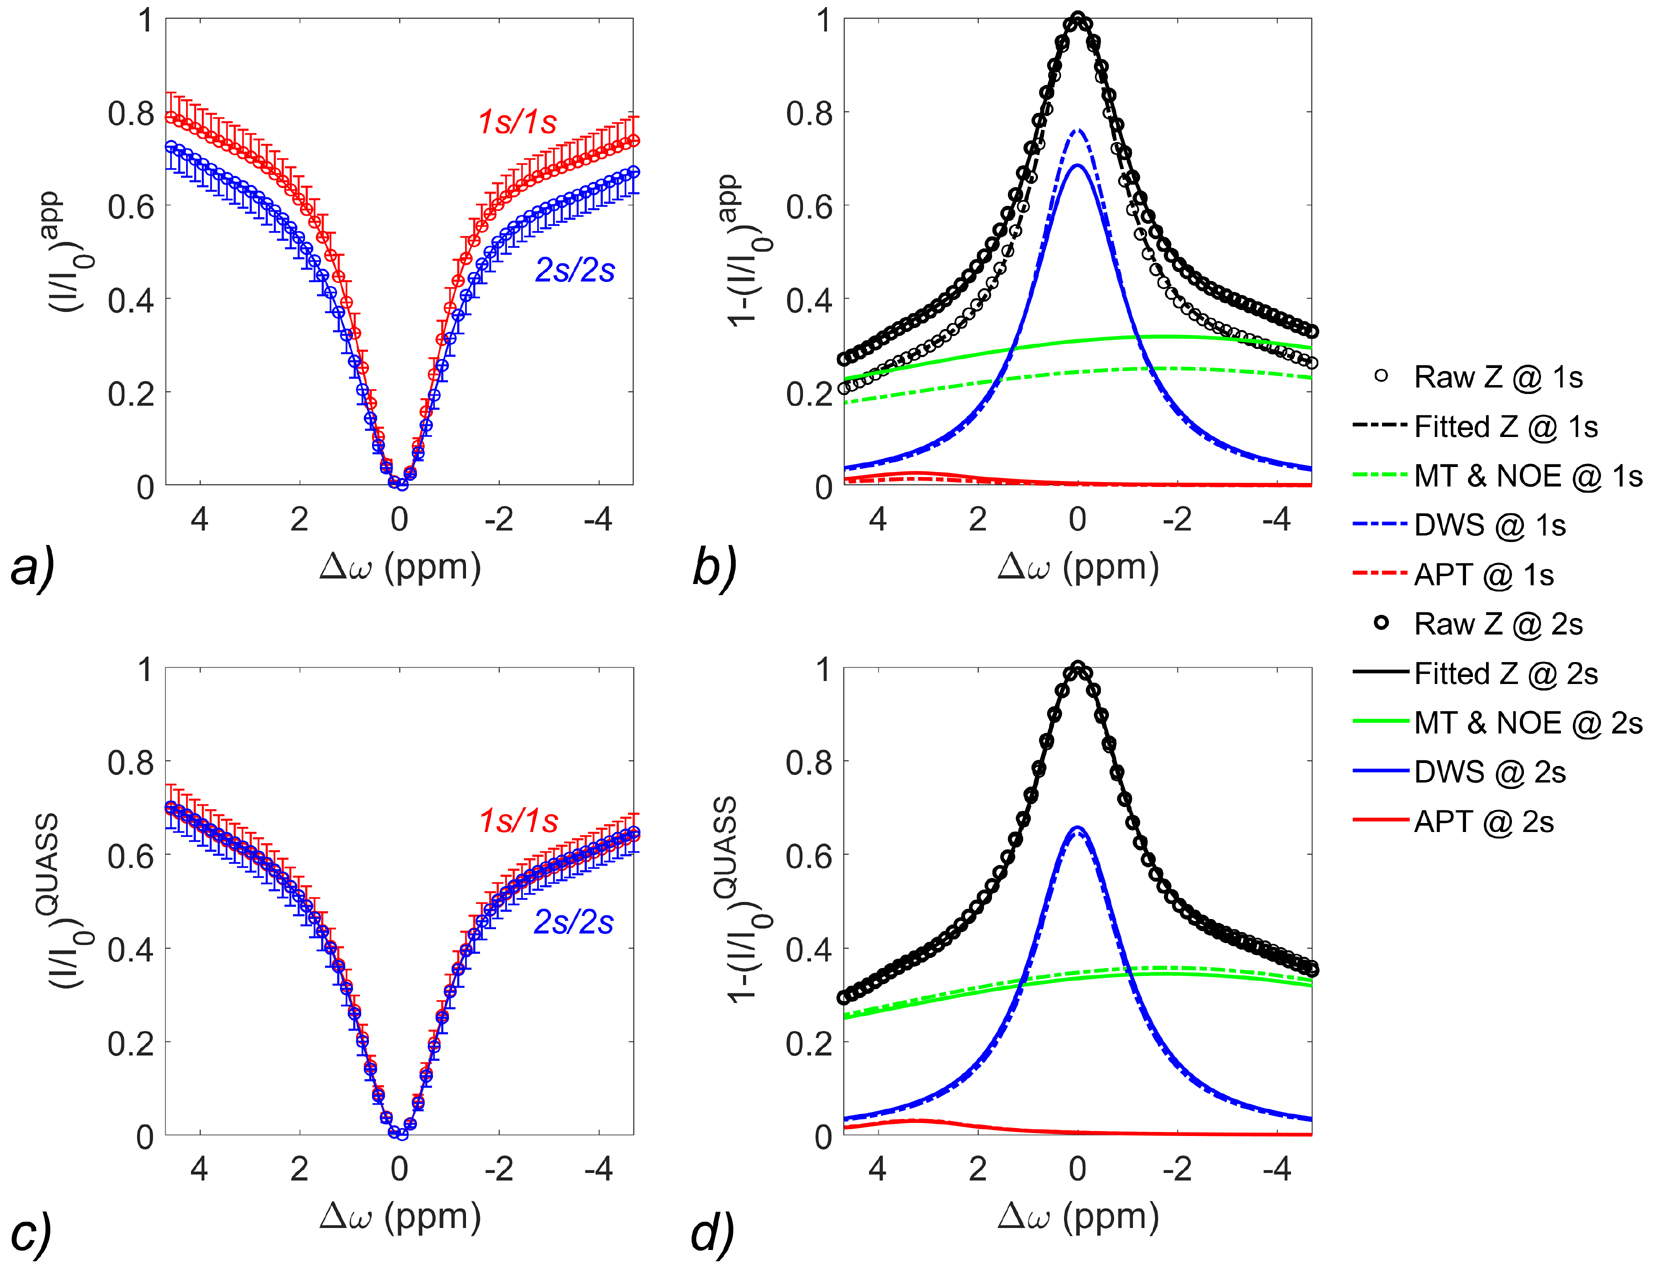
Figure 1. Comparison of (a) apparent Z-spectra and multipool Lorentzian fitting (b) in white matter (WM) from a 28-year-old male volunteer with Ts/Td of 1s/1s and 2s/2s, respectively. The corresponding QUASS Z-spectra (c) and multipool Lorentzian fitting (d).
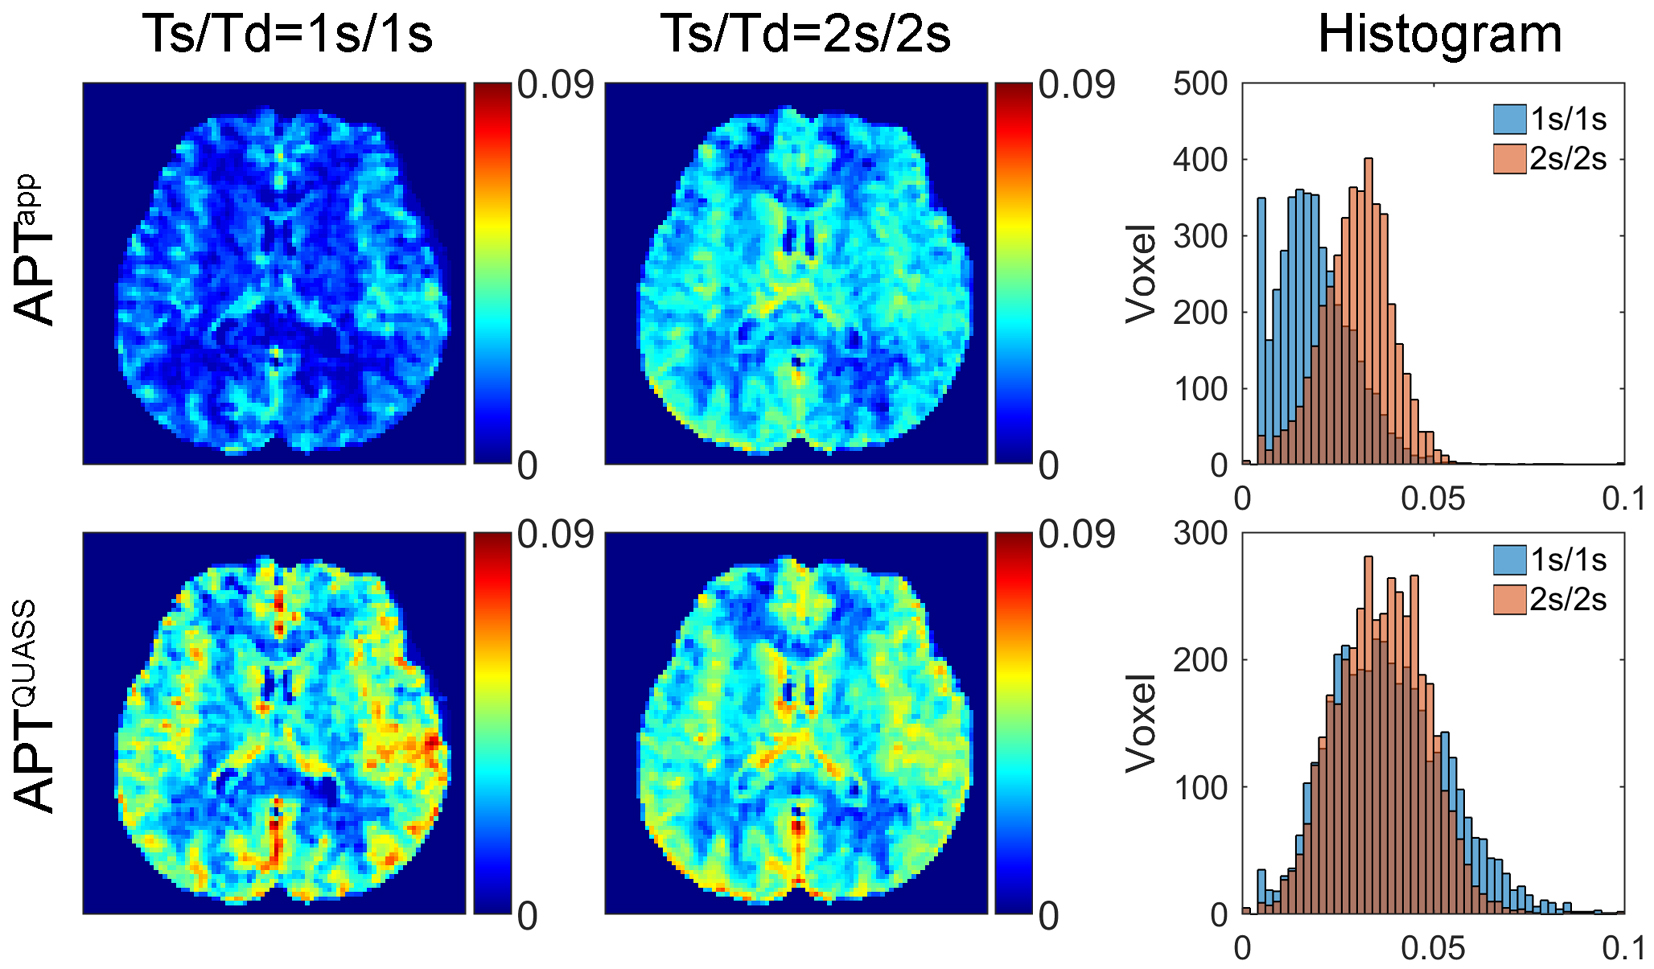
Figure 2. Apparent and QUASS APT maps and their histogram analysis of the whole brain of a representative healthy volunteer with Ts/Td 1s/1s and 2s/2s, respectively.
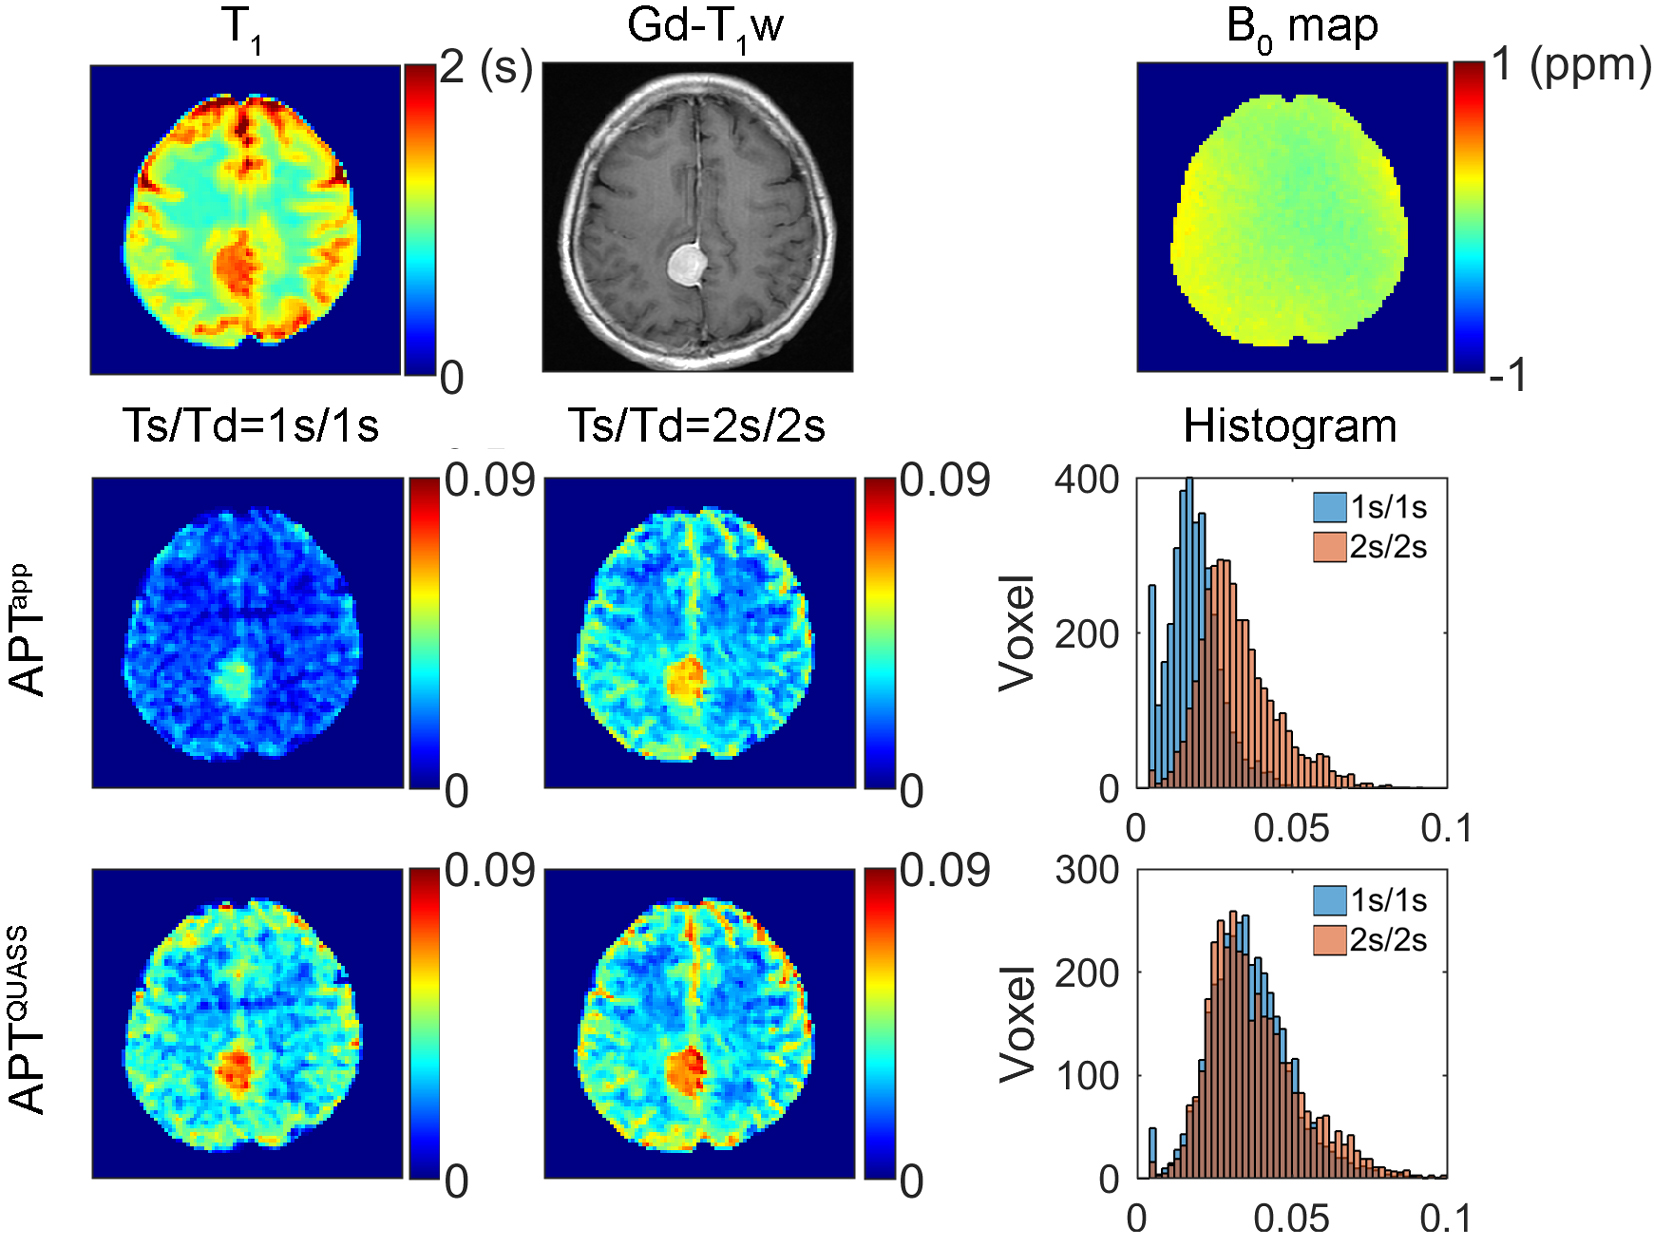
Figure 3. Multi-parametric MR images of a 57-year-old female patient with histologically confirmed meningioma, including T1 map, Gd enhancement T1w image, B0 map, apparent and QUASS APT maps, and their histogram analysis of the whole brain with Ts/Td of 1s/1s and 2s/2s, respectively.
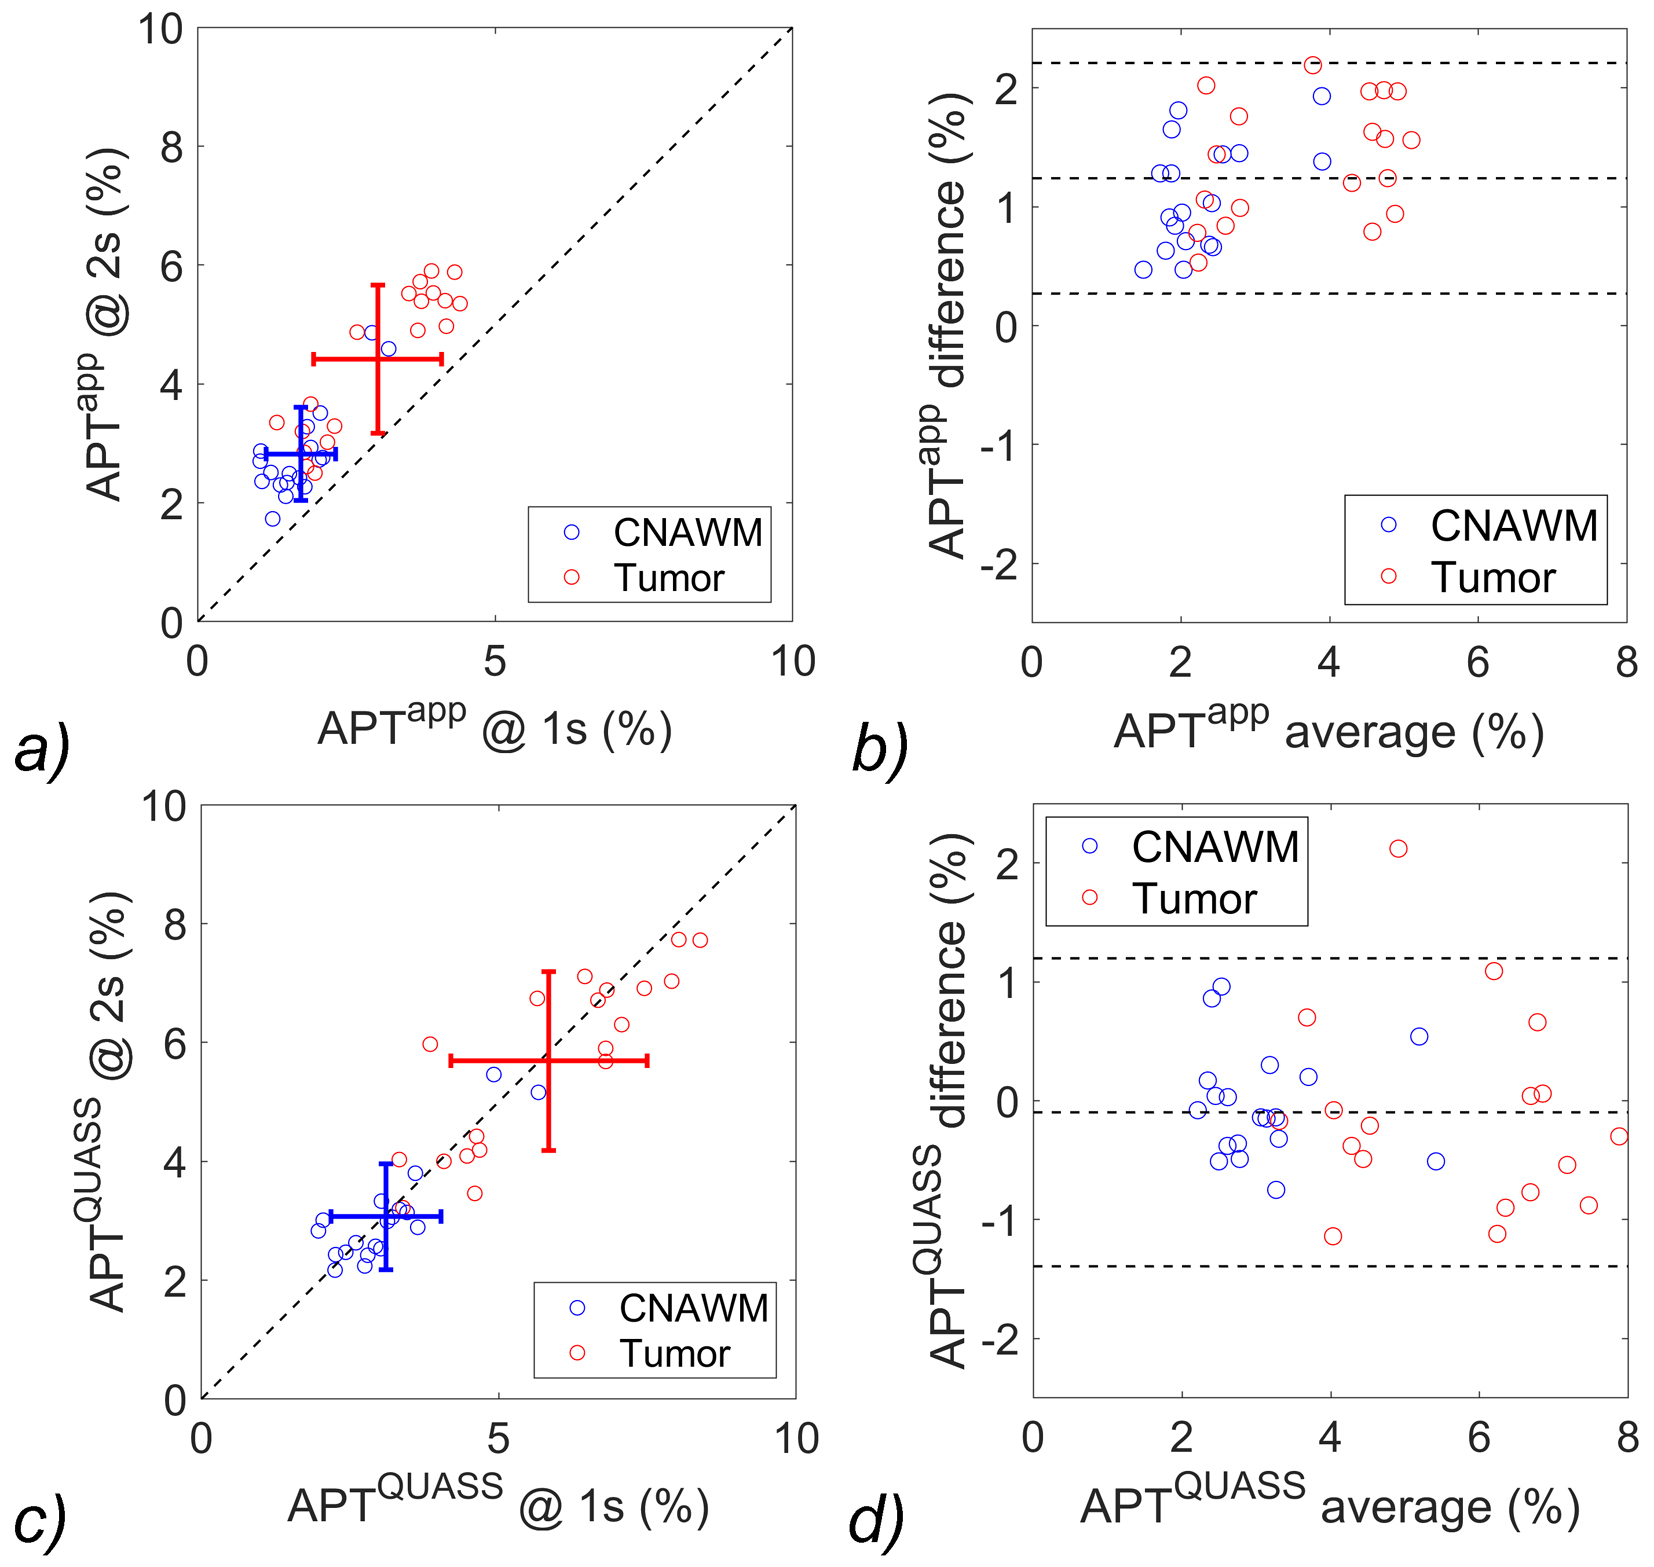
Figure 4. (a) Correlation test and (b) Bland-Altman plots of the apparent APT measurements, and (c) correlation test and (d) Bland-Altman plots of the QUASS APT measurements between Ts/Td of 2s/2s and 1s/1s. The three horizontal lines depict the mean and the upper and lower limits of agreement (i.e., +1.96 and -1.96 times of standard deviation, respectively).
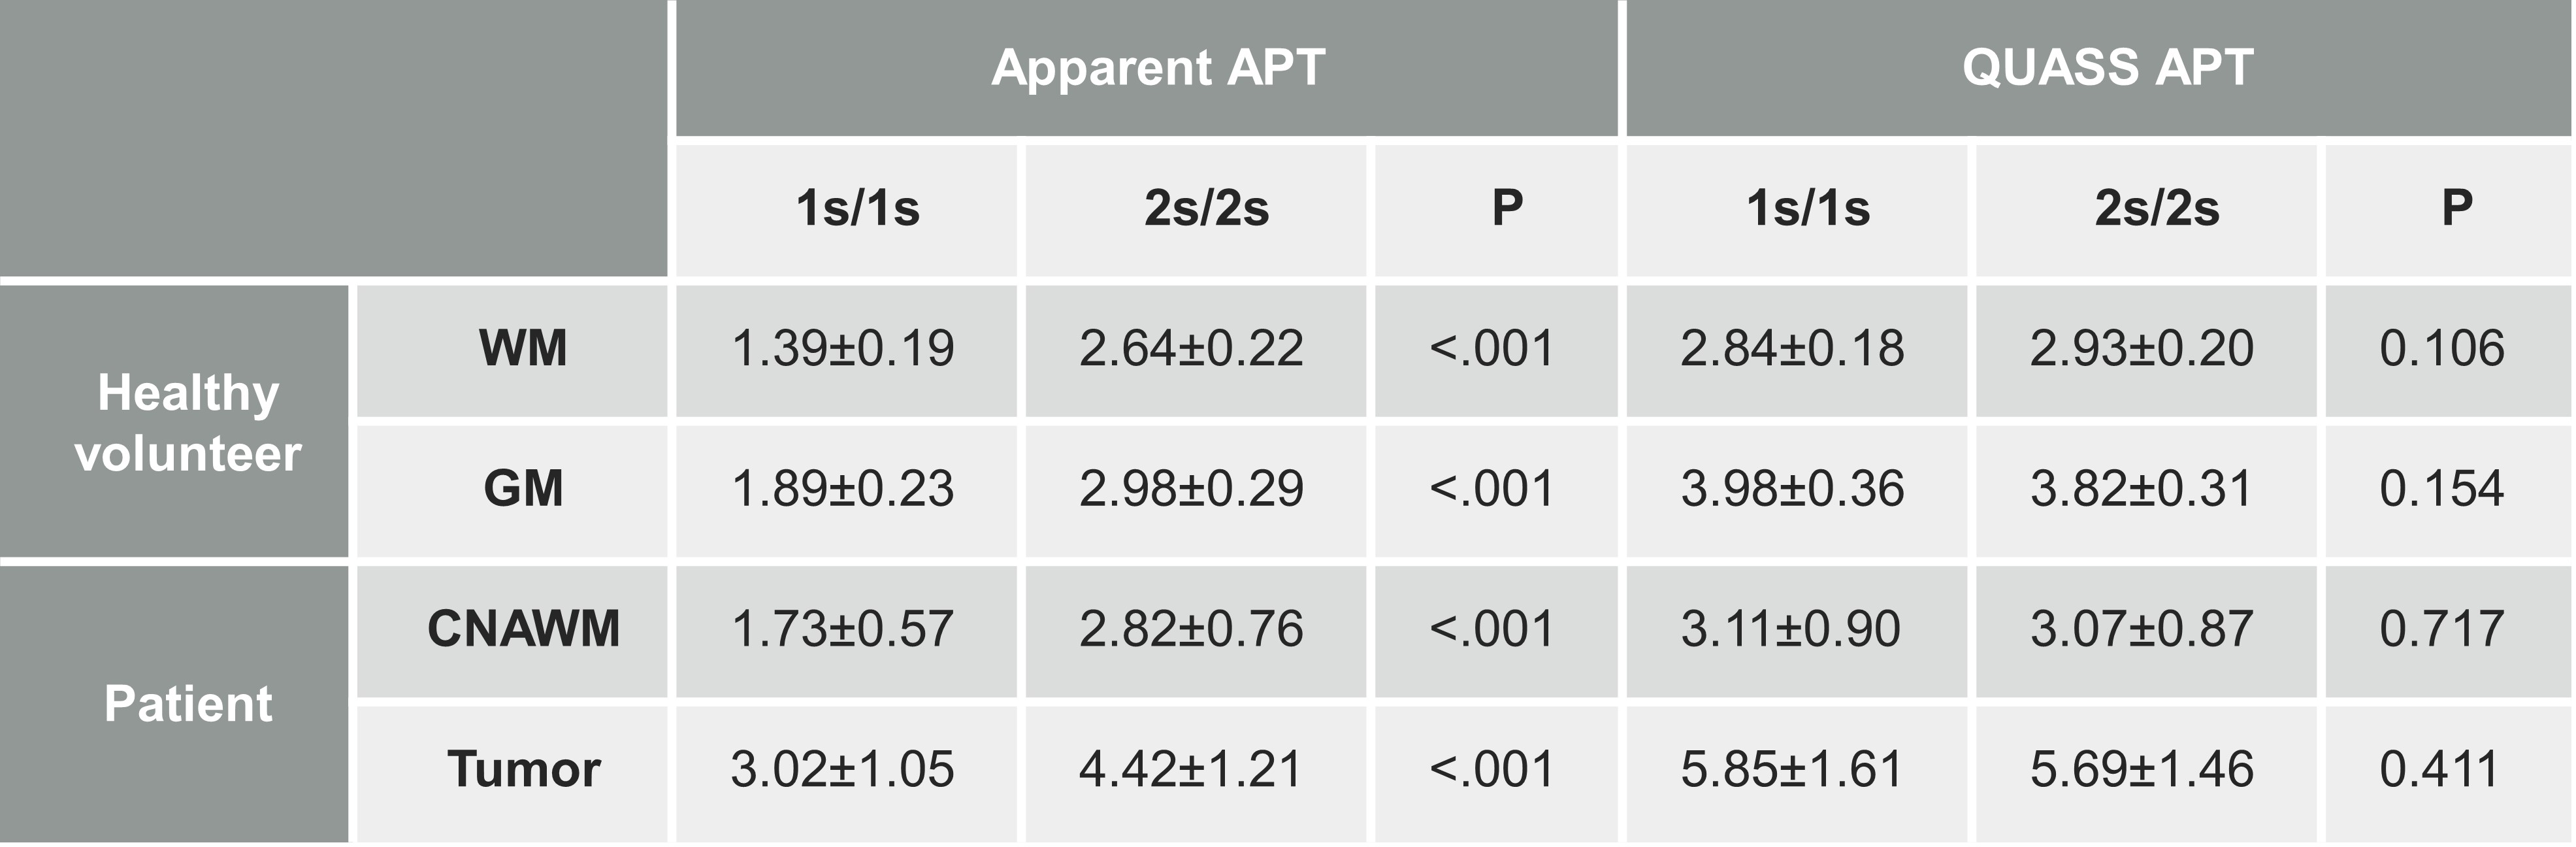
Table 1. Comparison of apparent and QUASS APT effects in white matter (WM) and gray matter (GM) averaged from the 7 healthy volunteers, and in the contralateral normal-appearing white matter (CNAWM) and tumor regions averaged from the 19 patients with two representative saturation time and relaxation delay of 1s/1s and 2s/2s