3846
A new approach for in-vivo liver CEST imaging1Research Center for Healthcare Data Science, Zhejiang Lab, Hangzhou, Zhejiang, China, 2Philips Healthcare, Shanghai, China, 3Institute of Imaging Science, Vanderbilt University, Nashville, TN, United States, 4Renji Hospital affiliated to Shanghai Jiao Tong University Medical College, Shanghai, China, 5Shanghai Key Laboratory of Magnetic Resonance, School of Physics and Electronic Science, East China Normal University, Shanghai, China
Synopsis
Chemical exchange saturation transfer (CEST) imaging shows great potentials in the diagnosis of brain diseases. However, there are still many challenges in the hepatic disease due to the fat suppression and large B0 inhomogeneity. In this study, we achieved CEST imaging with simultaneous B0 correction in one sequence, and conducted a pixel-by-pixel prediction on the background reference Z-spectra representing the magnetization transfer and direct saturation effects. Our approach also effectively separated the amide proton transfer (APT) effects from the mixing effect of fat and nuclear Overhauser enhancement (NOE), by subtracting the background reference Z-spectra from the predicted Z-spectra.
Background and Purpose
CEST imaging shows great potentials in many clinical applications, such as the classification and staging of tumors. This technique has been widely used in brain1, 2 and breast3. However, there are still many challenges when applying CEST in the liver disease diagnosis4.Firstly, the effects of fat and NOE usually contaminate the positive side of Z-spectra in the conventional asymmetry analysis of MTR (MTRasym), and consequently affect the quantitative analysis of APT signals. Secondly, B0 inhomogeneity is usually severe in the abdomen, which deviates the water peak from the center frequency and biases the APT estimation. In brain APT imaging, the B0 shift is small and can be effectively corrected by using the Water Saturation Shift Referencing (WASSR) 5 sequence. In liver imaging, the WASSR sequence is very time-consuming for the acquisition between -2ppm and 2ppm frequency bands. It may also generate “field drifts” among different sequences due to temperature variation, airflow, and homogenization mechanism6, which consequently affects the accuracy of B0 corrections. To address these issues, we proposed a deep learning approach for CEST imaging techniques which simultaneously corrects for B0 inhomogeneity and separates APT signals from other effects.
Materials and Methods
The pipeline of data processing is shown in Figure 1. We recruited four healthy volunteers by using a 3T MRI system (Ingenia CX, Philips Medical, Netherlands) and a 32-channel body coil. The CEST acquisitions were acquired by using a Fast Spin-Echo (FSE) sequence. Saturation transfer was applied by using RF-excitation pulses with an amplitude of 1µT lasting for 1000ms. The imaging parameters were field of view (FOV) = 302 × 380 mm2 and matrix size = 280 × 352, slice thickness = 7 mm, repetition time (TR) = 45ms, echo time (TE) = 4.6ms, flip angle (FA) = 10°, and bandwidth = 320 Hz/pixel. The whole process was repeated 32 times with different off-resonance frequency offsets in the range between −10 ppm and 10 ppm with a variable step size. An additional unsaturated reference image was collected.We implemented our approach in two steps. Firstly, considering that the raw Z-spectrum (Figure 1b) was affected by the large B0 inhomogeneity, we extracted the three minima points of Z-spectrum to calculate the estimated B0 shift based on point-to-point comparisons, and interpolated it with a cubic spline function to represent the preliminary corrected Z-spectrum (Figure 1c). Secondly, we used a neural network model for a pixel-by-pixel prediction of the APT effect and the accurate B0 shift simultaneously. The neural network was trained based on simulated background reference Z-spectrum (Figure1a), which was reconstructed by using the two-pool Bloch-McConnell equation. During model training, 13 reference points from each Z-spectrum without fat or CEST effects (red solid dots in Figure 1d) were selected to fit the entire background reference Z-spectrum (blue line in Figure1d), after taking into account the magnetization transfer and direct saturation effects 7, and the extra random B0 shifts. During the model evaluation, the neural network took in the preliminary corrected Z-spectrum (Figure1c) and predicted the corresponding background reference Z-spectrum as well as the accurate B0 shift (bluish violet dashed curve in Figure 1f). The APT effect was then estimated by calculating the difference between the predicted background reference Z-spectrum and the corrected Z-spectrum (shaded area in Figure 1f). A pixel-by-pixel reconstruction algorithm was applied to generate the APT image of the abdomen (Figure 1g).
Results
Figure 2 shows an example of the corrected abdominal B0 maps and the corresponding MTRasym maps from a healthy subject. Compared to the traditional method, our proposed method generated a smoother version of the B0 map (Figure 2b&e) along with more accurate corrections for the effect of “field shift” (Figure 2c&f) and resulted in a better estimation of CEST imaging, e.g. MTRasym(Figure 2d&g).In addition, the proposed method separated the APT effect from other effects and showed better tissue contrasts between the liver and right kidney (as shown in Figure 3). Moreover, a higher contrast map of APTREX was generated, both APTREX and APT maps obtained from our method showed a better Contrast-Noisy Ratio (CNR) between tissues compared with the traditional MTRasym map.
Discussion and conclusions
In-vivo liver CEST imaging is challenged and usually affected by various factors, for instance, the limited scanning time due to the breath-hold scan strategy, the mixed effect of fat and NOE, and severe B0 inhomogeneity. In this study, we proposed a deep learning approach for CEST image analysis which corrects for B0 inhomogeneity and separates APT signals from mixed effects of MTRasym. Comparing to the traditional approaches, our method not only corrected B0 inhomogeneity within a shorter scanning time by discarding additional correction sequences, but also generated a cleaner map of APT signals which showed a uniform distribution within the same tissue and higher contrasts between tissues. Our method also showed highly reproducible results on four healthy volunteers. This study provides new avenues for in-vivo liver CEST imaging in clinical applications.Acknowledgements
No acknowledgement found.References
1. Zhang JX, Zhu WZ, Tain RW, Zhou XJ, Cai KJ. Improved differentiation of low-grade and high-grade gliomas and detection of tumor proliferation using APT contrast fitted from Z-spectrum. Mol Imaging Biol 2018;20:623-631.
2. Cai K, Singh A, Poptani H, et al. CEST signal at 2ppm (CEST@2ppm) from Z-spectral fitting correlates with creatine distribution in brain tumor. NMR Biomed 2015;28:1-8.
3. Zhang S, Seiler S, Wang X, et al. CEST-Dixon for human breast lesion characterization at 3 T: A preliminary study. Magn Reson Med 2018;80:895-903.
4. Seo N, Jeong HK, Choi JY, Park MS, Kim MJ, Chung YE. Liver MRI with amide proton transfer imaging: feasibility and accuracy for the characterization of focal liver lesions. Eur Radiol 2021;31:222-231.
5. Kim M, Gillen J, Landman BA, Zhou J, van Zijl PC. Water saturation shift referencing (WASSR) for chemical exchange saturation transfer (CEST) experiments. Magn Reson Med 2009;61:1441-1450.
6. Sun PZ, Farrar CT, Sorensen AG. Correction for artifacts induced by B-0 and B-1 field inhomogeneities in pH-Sensitive chemical exchange saturation transfer (CEST) Imaging. Magn Reson Med 2007;58:1207-1215.
7. Zaiss M, Zu Z, Xu J, et al. A combined analytical solution for chemical exchange saturation transfer and semi-solid magnetization transfer. NMR Biomed 2015;28:217-230.Figures
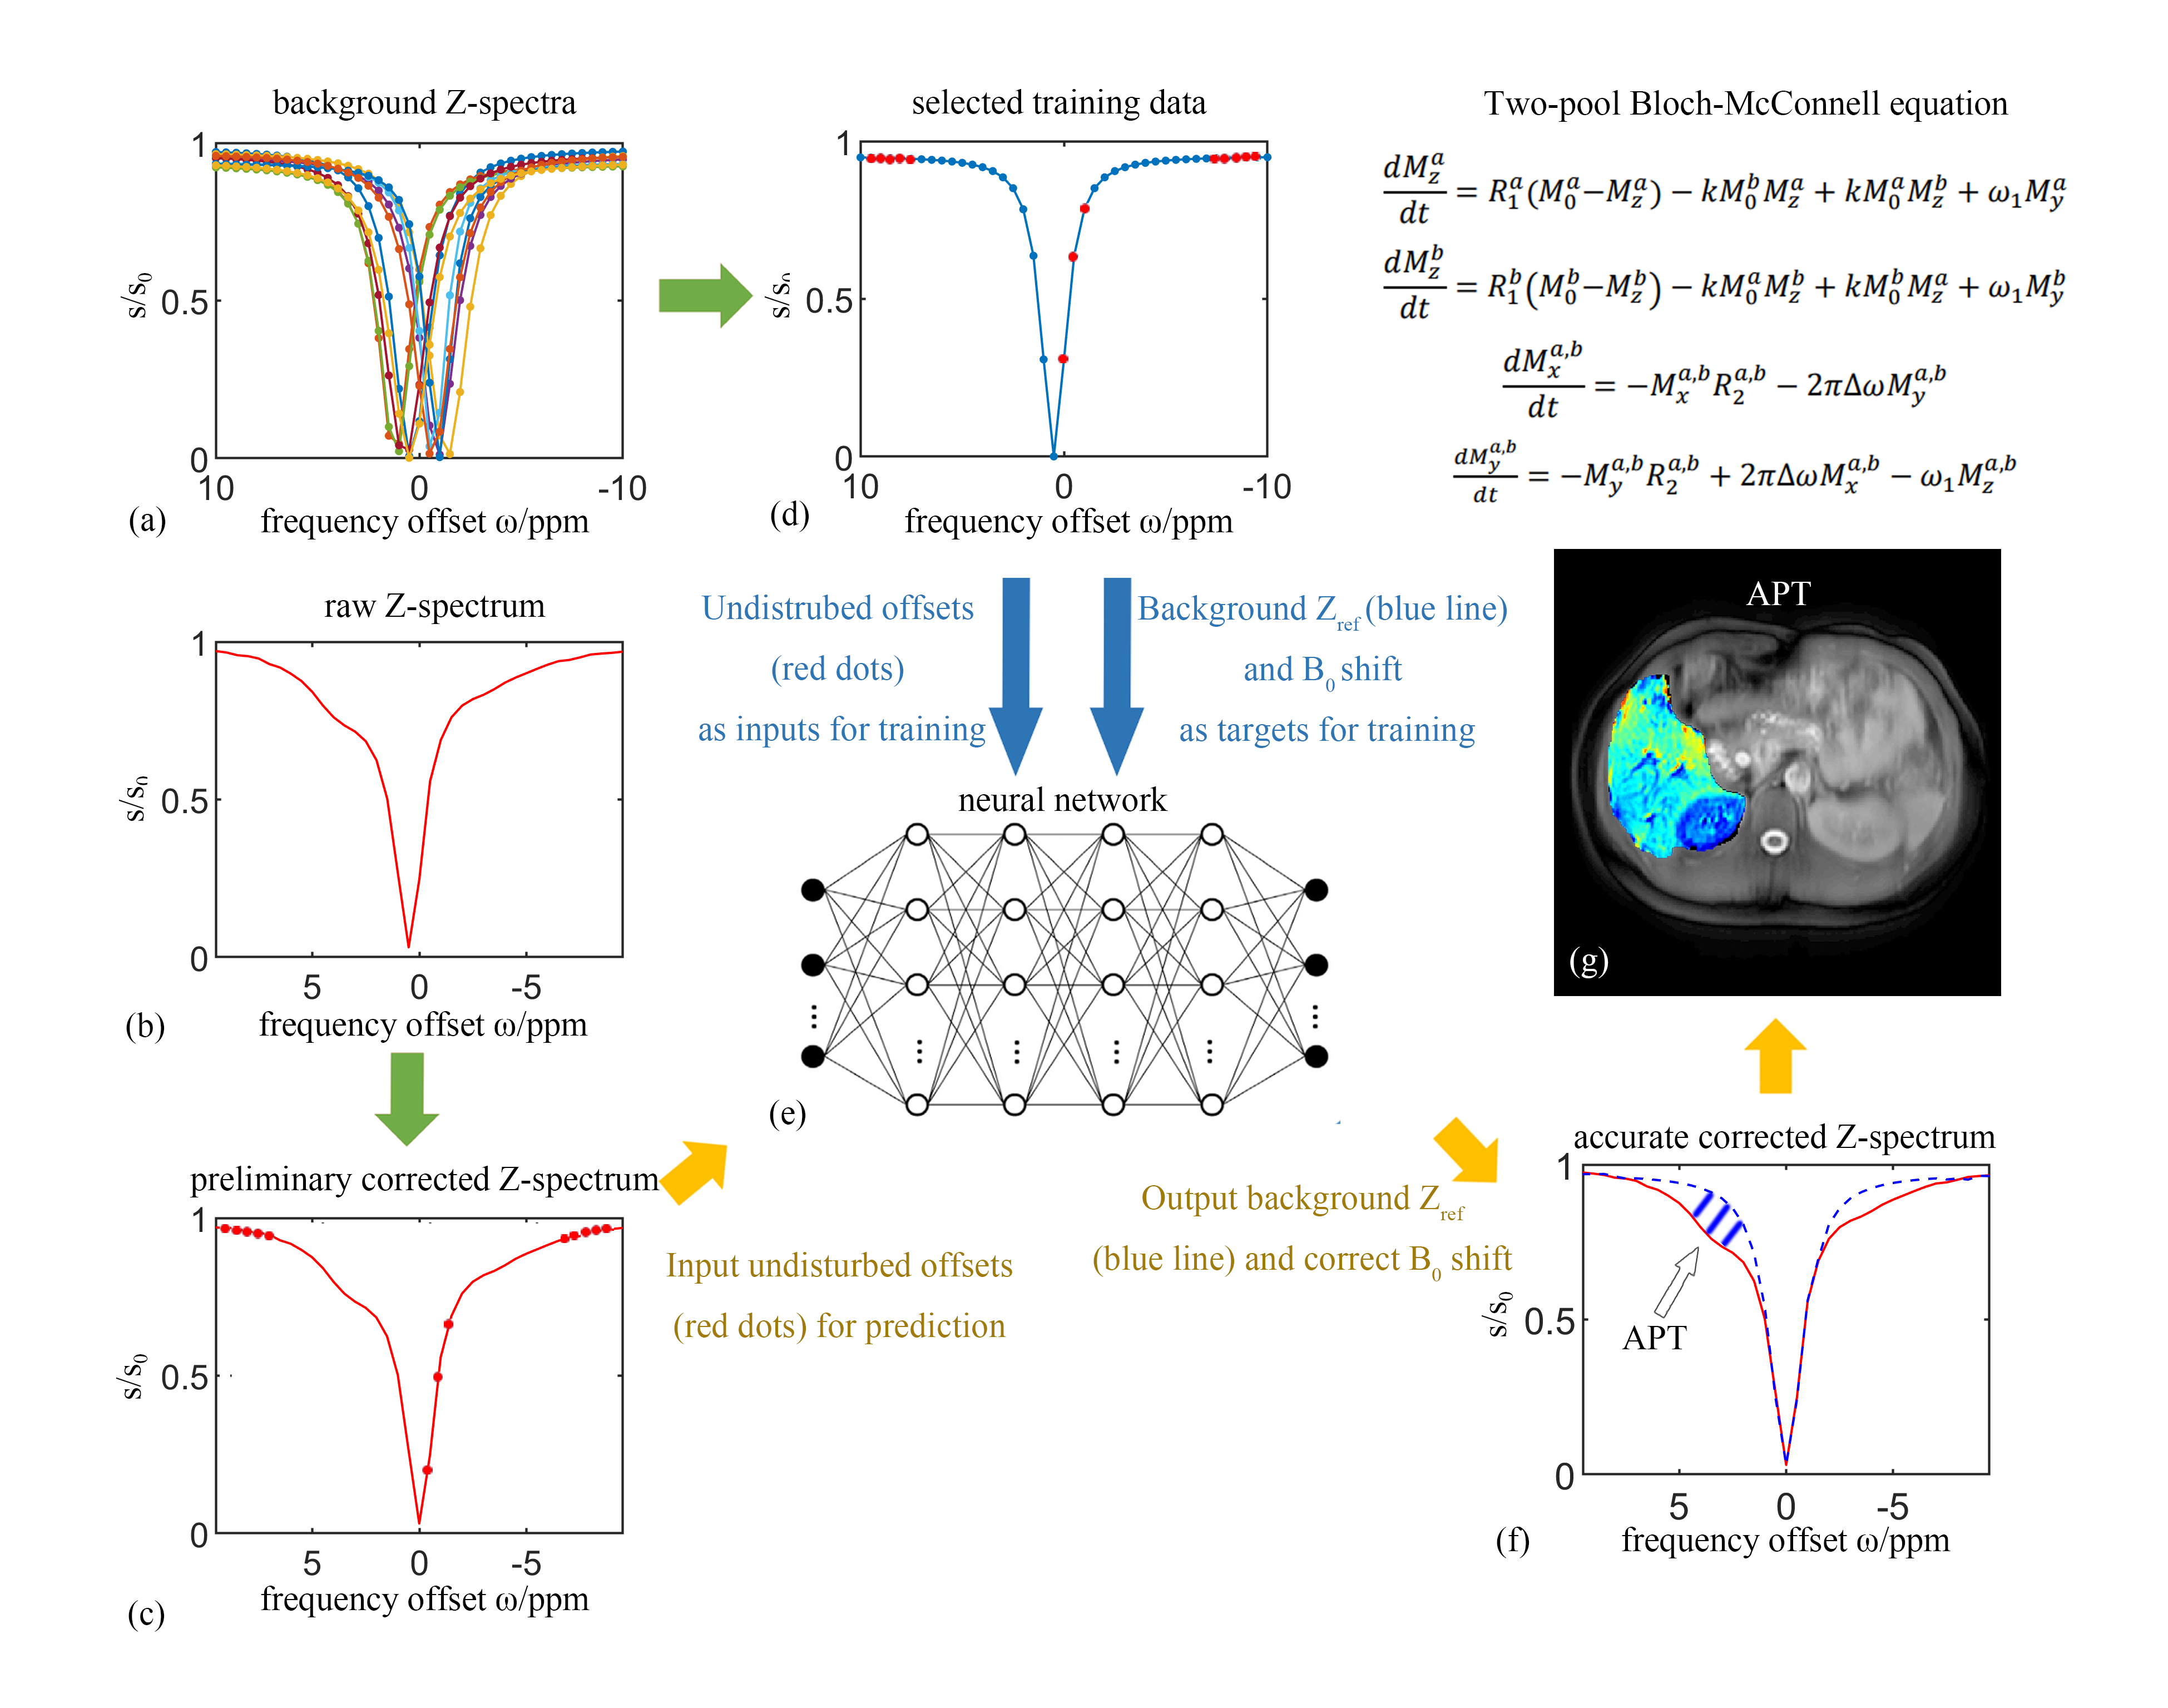
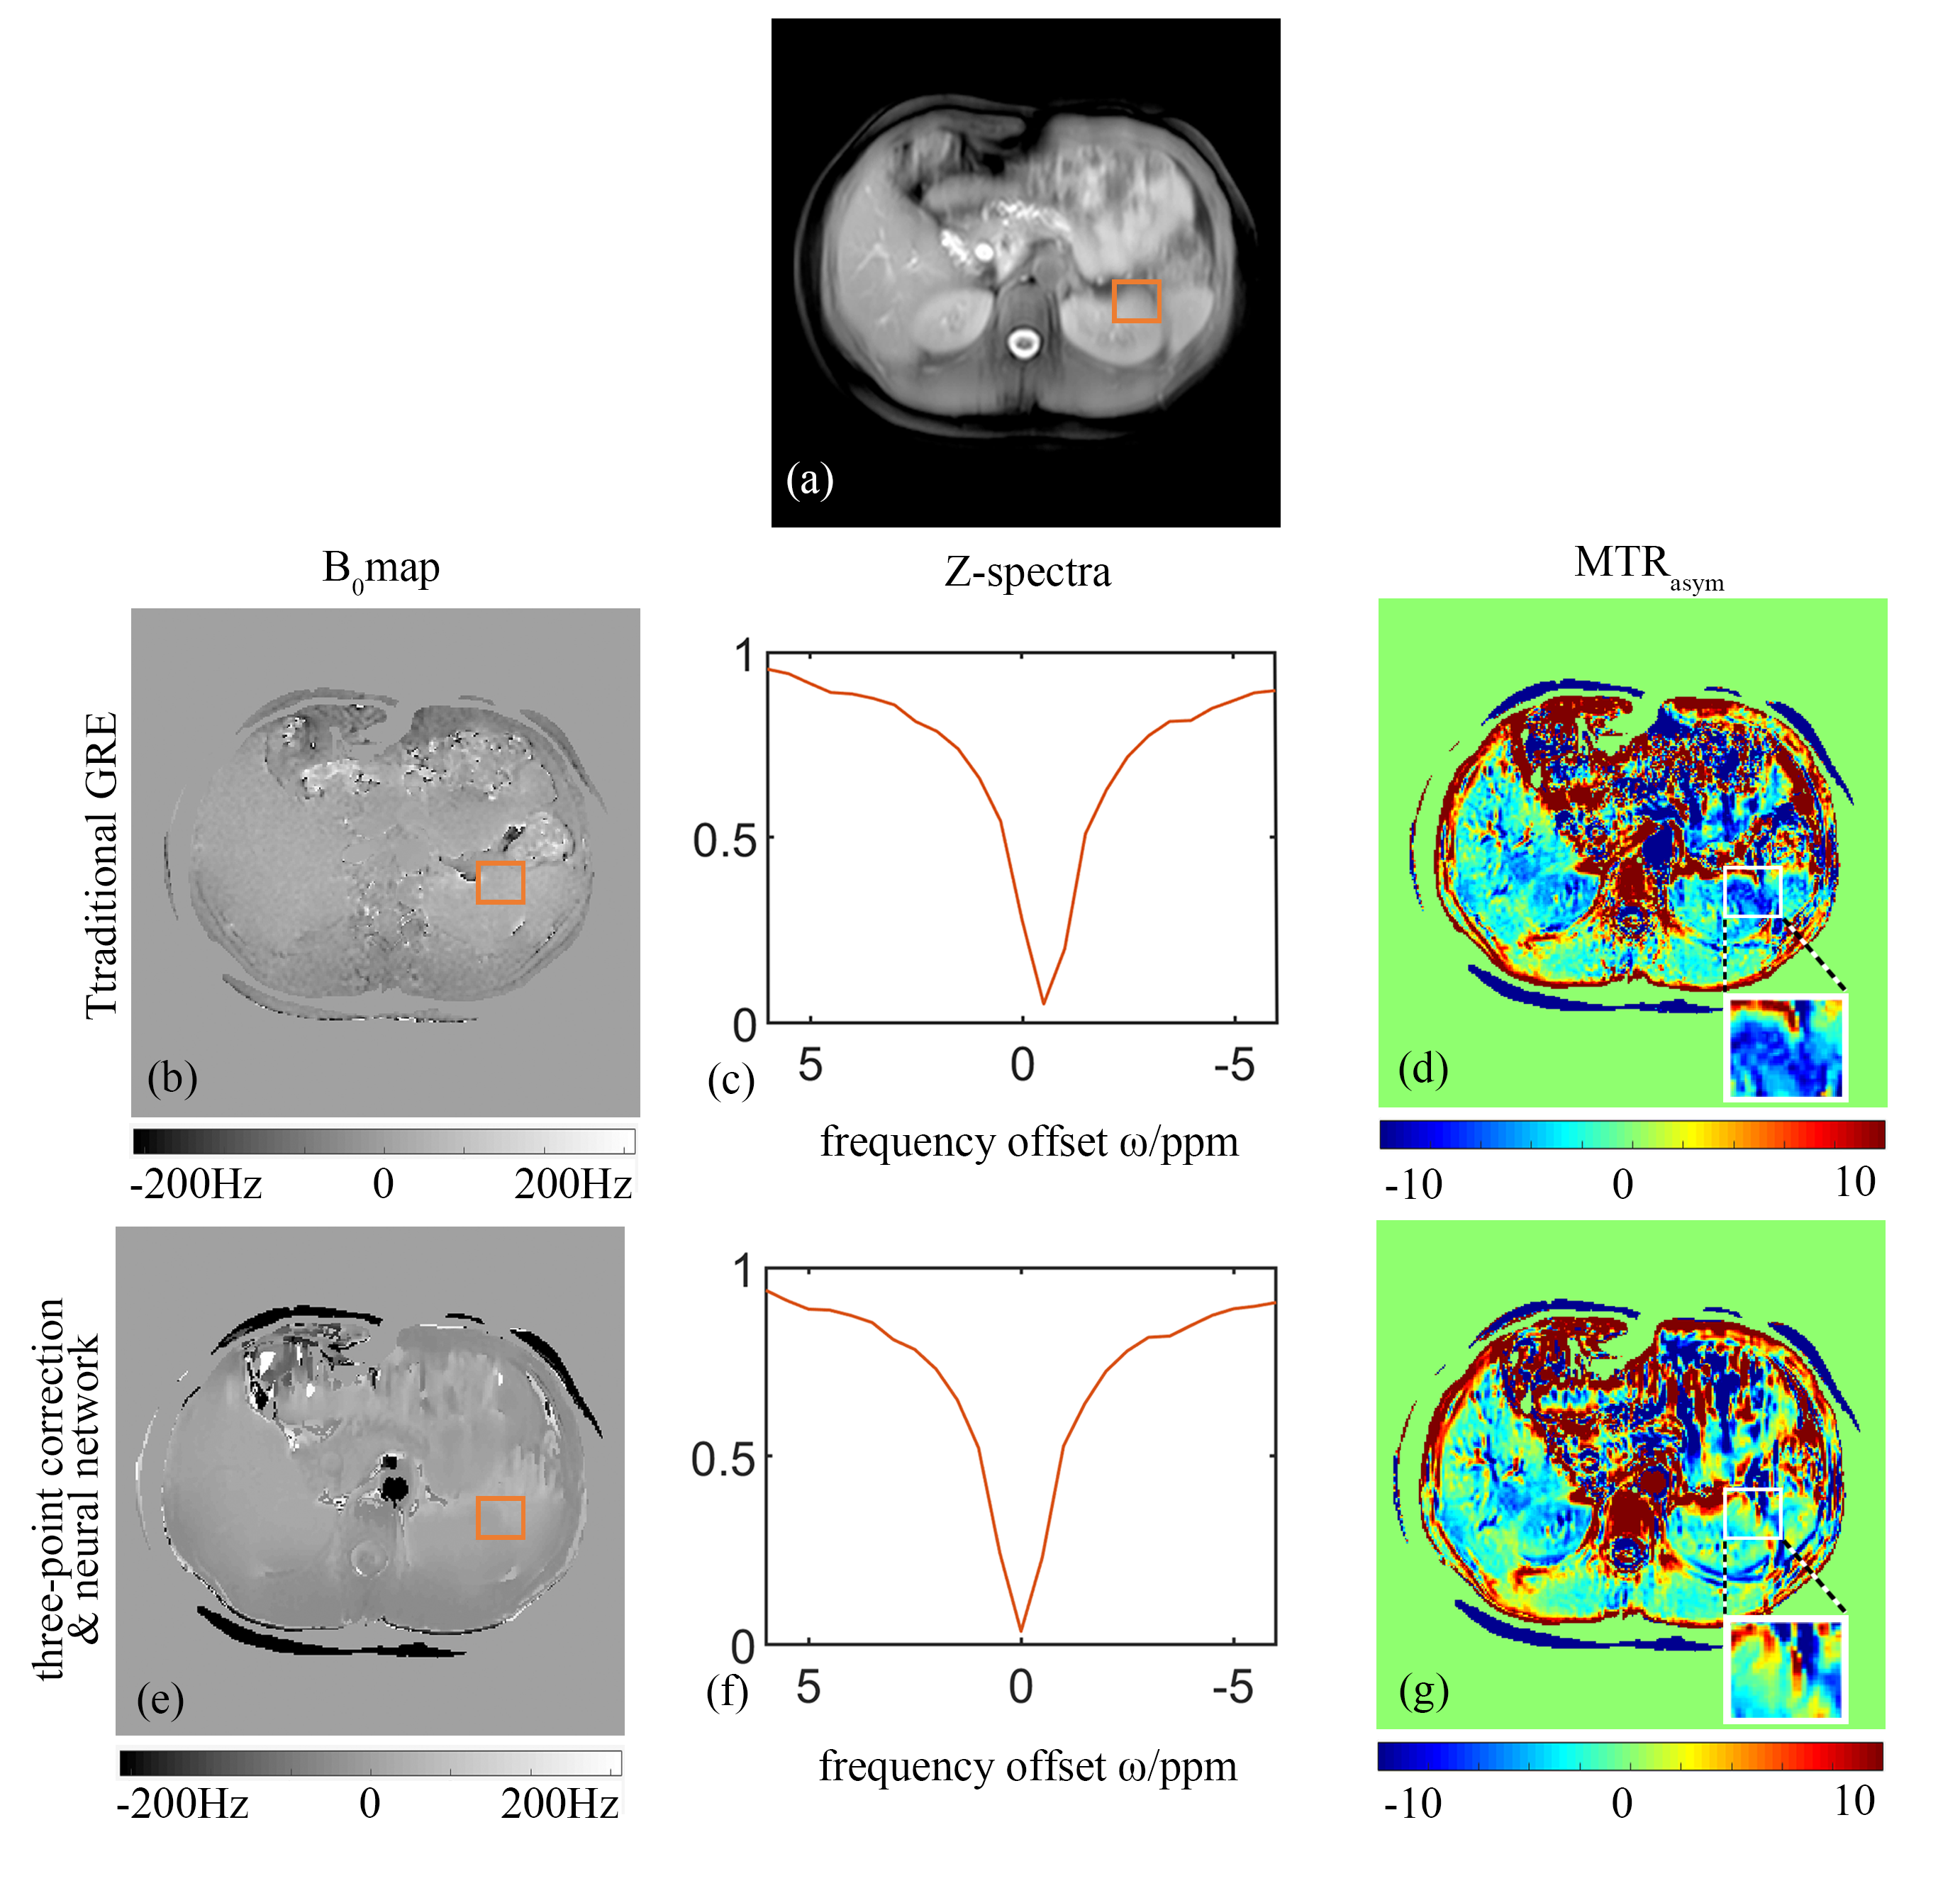
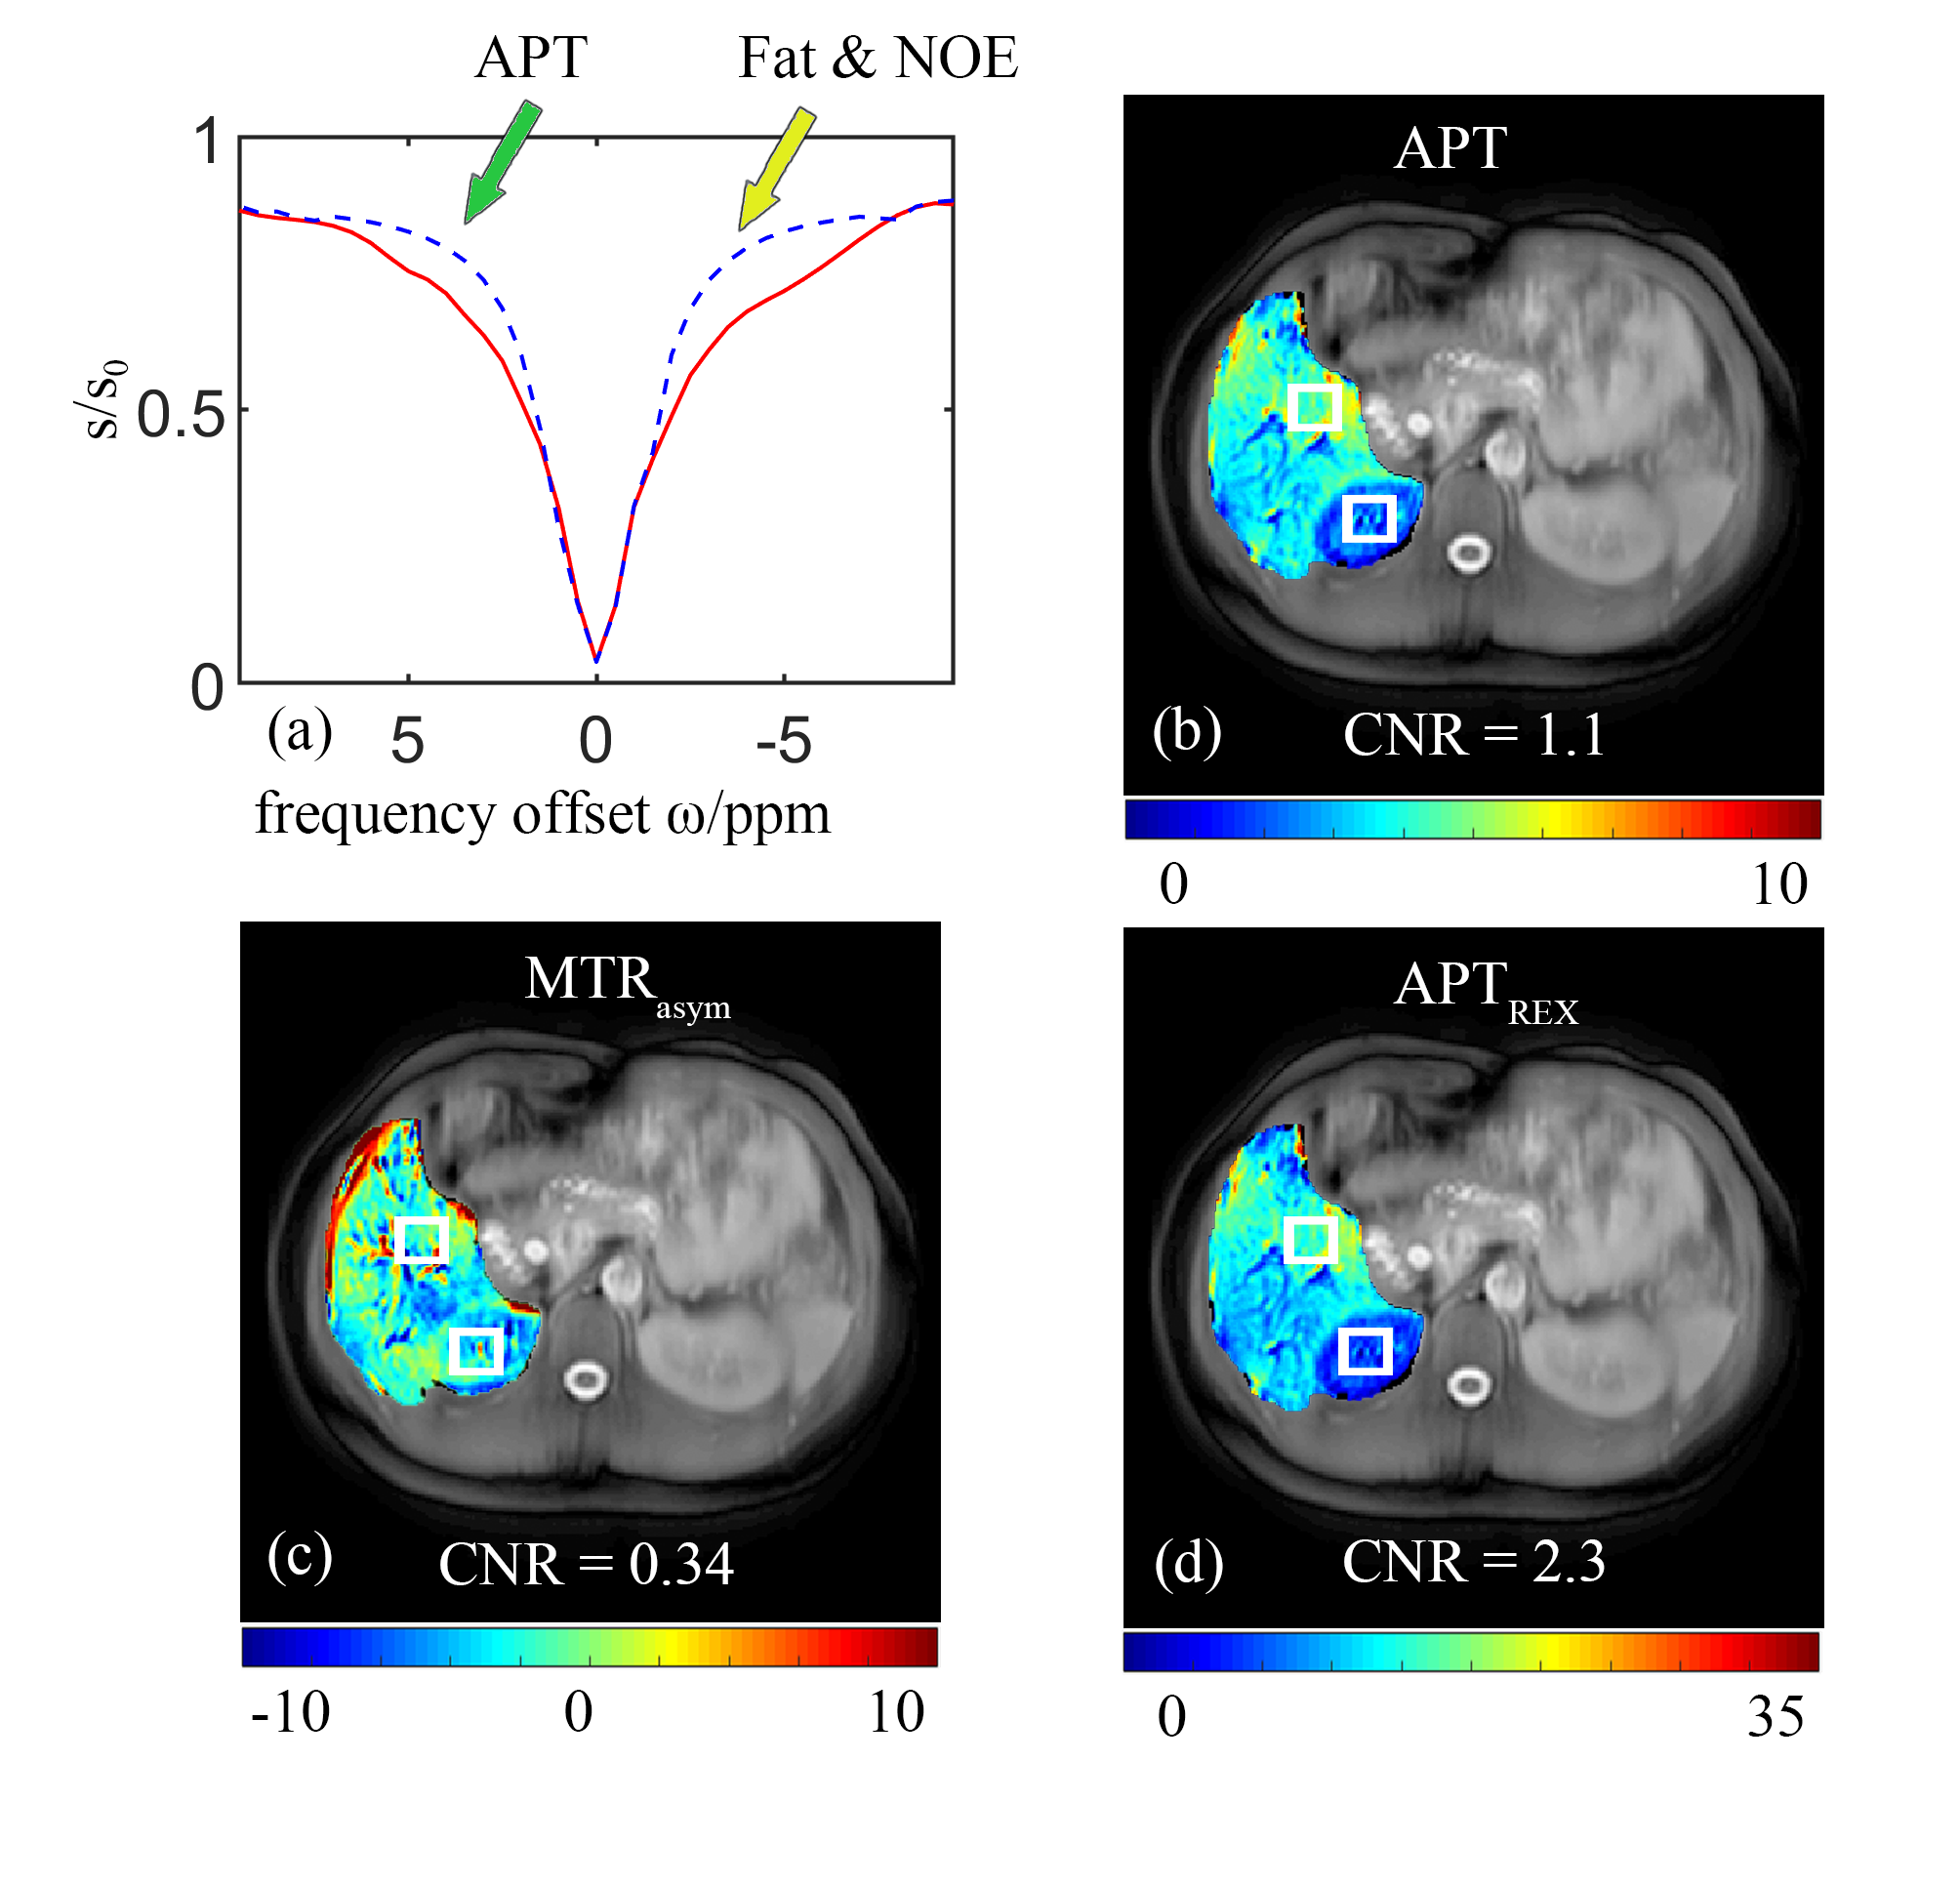
Fig. 3 The CEST results of a healthy volunteer obtained by the proposed method. (a) The difference between predicted corrected Z-spectrum (red solid curve) and background reference Z-spectrum (bluish violet dashed line); The green arrow and yellow arrow indicate the separated APT and other effects, respectively (b) APT map; (c) Traditional NOE map; (d) APTREX map;