3845
Using 3D Amide Proton Transfer weighted imaging at 3T to investigate lesions and normal-appearing white matter in Multiple Sclerosis1School of Health Sciences, University of Newcastle, Newcastle, Australia, 2Hunter Medical Research Institute, Newcastle, Australia, 3College of Applied Medical Sciences, University of Jeddah, Jeddah, Saudi Arabia, 4School of Psychology, University of Newcastle, Newcastle, Australia, 5School of Medicine and Public Health, University of Newcastle, Newcastle, Australia, 6Department of Neurology, John Hunter Hospital, New Lambton Heights, Australia, 7CSIRO Health and Biosecurity, Brisbane, Australia, 8Queensland Brain Institute, The University of Queensland, Brisbane, Australia, 9Olea Medical, La Ciotat, France, 10The Florey Institute of Neuroscience and Mental Health, Melbourne, Australia, 11Murdoch Children's Research Institute, Royal Children's Hospital, University of Melbourne, Melbourne, Australia, 12Siemens Healthcare GmbH, Erlangen, Germany
Synopsis
This novel study explores amide proton transfer weighted (APTw) imaging in people with relapsing-remitting multiple sclerosis (pw-RRMS). We evaluated the APTw signal intensity in selected MS lesions and normal-appearing white matter (NAMW) regions in 9 pw-RRMS. Compared to NAWM regions, a statistically significant increase in APTw signal intensity was observed in the MS lesions. Elevated APTw signal intensity could mark increased mobile myelin proteins decomposition and accumulation from the demyelination process.
Introduction
Multiple Sclerosis (MS) is a chronic neurodegenerative disease whose diagnosis and monitoring relies on conventional magnetic resonance imaging (MRI)1. Unfortunately, the MRI biomarkers of MS are not unique to its pathophysiological substrates 2. Autoimmune attacks in MS disease cause inflammatory demyelination, leading to axonal loss and destruction of myelin. Axonal loss and demyelination in MS lead to the breakdown of myelin proteins2,3.Novel MRI techniques attempt to unravel the biochemical changes and demyelination processes occurring in the focal MS lesions and normal-appearing white matter (NAWM) of pw-MS. Some of these studies have validated their MRI findings with histological results of breakdown products of myelin proteins within macrophages/microglia in post-mortem MS brains4,5.
To gain insight into proteins involved in demyelination in MS, amide proton transfer weighted (APTw) imaging has been developed as an endogenous proteins contrast technique in tissue6,7. APTw imaging is a novel advanced MRI technique capable of indirectly measuring intra/extra-cellular proteins by detecting the chemical exchange between amide protons of mobile proteins and water protons6,8.
This study aims to explore the difference in APTw signal intensity between MS lesions and NAWM to detect the breakdown products of myelin proteins previously described in histological studies.
Methods
Nine people with relapsing-remitting multiple sclerosis (pw-RRMS, 6 women, 3 men) diagnosed according to the McDonald criteria were recruited. All participants were stable on their MS therapy. Their mean age was 50.2 years (range 32-64 years), the mean disease duration was 15.7 years (range 3-33 years), and the mean Expanded Disability Status Scale score was 2.8 (range 1.5–4).All MRI/APTw acquisitions were undertaken on a 3 T MRI scanner (Prisma, VE-11C, Siemens Healthineers, Germany) equipped with a 64-channel head-neck coil. For structural imaging, 3D T1-weighted high resolution MPRAGE (Magnetisation-Prepared Rapid Acquisition with Echo Gradient) scan obtained with the following parameters: repetition time (TR)=2500 ms; Echo Time (TE)=2.22 ms;field of view (FOV)=256 x 256mm2;voxel size=0.8mm3; GRAPPA acceleration factor=2; 208 slices and acquisition time 6:54 minutes. For assessment of MS lesion load, T2-weighted FLAIR (Fluid-attenuated inversion recovery) sequence was acquired using the following parameters:TR=5000ms;TE=386ms;TI=1800 ms;FOV=256 x 256 mm2;voxel size=0.8mm3;GRAPPA acceleration factor=3; 176 slices and acquisition time 5:02 minutes. The APTw sequence (WIP816B) used a 3D snapshot-GRE with the following parameters:FOV=220×180 mm2;matrix=128×104;voxel size=1.7×1.7×5 mm3; 12 slices; GRAPPA acceleration factor=2;TE=2.00 ms;TR=4.5 ms;bandwidth=700 Hz/pixel;flip angle=6°,Duty Cycle=55%. The acquisition time for APTw volumes at two B1 values (1.8μT and 2.6μT) was 3:07 minutes for each B1 (RF saturation with 20 Gaussian pulses with duration/interpulse delay=50/40ms, 55% Duty Cycle, one off-resonance (300ppm) pre-saturation M0 volume and 25 APTw M(Δωi) volumes with equally-spaced relative offsets Δωi from -6ppm to 6ppm from water frequency). Additional WASAB1 sequence (WIP816B) was acquired for simultaneous B0 and B1 mapping (2:03 minutes)9.
The APTw data were denoised10,11, normalised by M0, and B0/B1 corrected (reconstructed B1=2.2µT)12. APTw map was computed around amide relative resonance frequency offset from water (3.5ppm) using the following no-punctual metric13 : $$APT_w=\int_{-4ppm}^{-3ppm}Z(\Delta\omega)\delta\omega-\int_{3ppm}^{4ppm}Z(\Delta\omega)\delta\omega$$ Where $$$Z(\Delta\omega) = M(\Delta\omega)/M_0$$$ is the APTw-Z-Spectrum. The pre-/post-processing, co-registration of APTw map with structural MRI, and drawing regions of interest (ROIs) were performed with Olea Sphere 3.0 software (Olea Medical, La Ciotat, France).
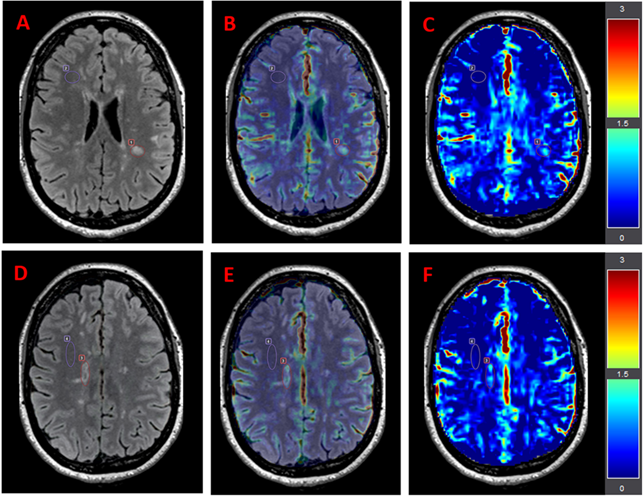
In this pilot study, the mean APTw signal intensity was computed from 2 MS lesions and 2 NAWM ROIs per subject (Figure 1). The NAWM and lesion ROIs were of identical sizes. The statistical analysis of APTw signal intensity in ROIs was performed using the student’s t-test, where p<0.05 was considered statistically significant using JASP (version:0.14).
Results
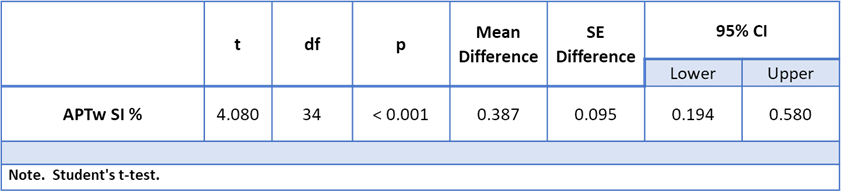
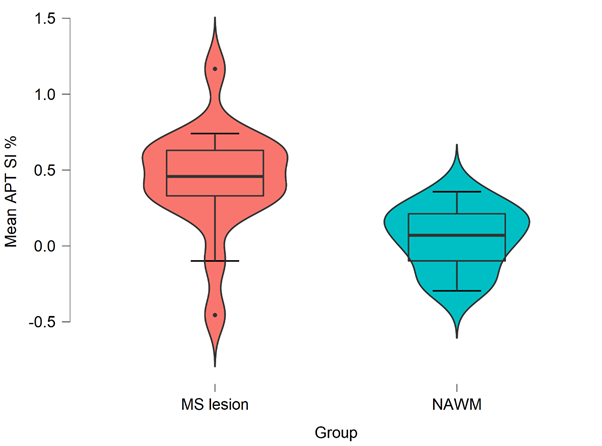
A descriptive statistical boxplot for MS lesions in comparison to NAWM groups is shown in Figure 2. The independent t-test showed a statistically significant (p<0.001) increase of APTw mean signal intensity in MS lesions in comparison to NAWM ROIs (Table 1). The average APTw signal intensity in MS lesion ROIs were 0.44 ± 0.35 %, and NAWM ROIs were 0.05 ± 0.02 % (Table 1).Discussion
These preliminary results present a novel application for assessing APTw signal across different ROIs in RRMS. We found significantly elevated APTw signal intensity in MS lesions compared to NAWM regions. These findings are consistent with several studies that confirmed higher APTw signal intensity among MS lesions6,14. These results could be explained by the increase of mobile myelin proteins decomposition and accumulation from the demyelination process5,6.Furthermore, the found APTw signal intensity from the different MS lesions ROIs has a high variance between the various lesions of pw-RRMS, as shown in the boxplot of Figure 2. This may suggest that the Gadolinium-free APTw maps could unravel different MS characteristics/stages based on demyelination status between the different lesions6,14,15, which would show a potential advantage over the FLAIR hypersignal. This heterogeneity of APTw signal intensity of MS lesions will be investigated in future studies.
While this is only a pilot study with a small number of lesions examined, it provides an enticement to investigate this method in large and diverse cohorts to strengthen these findings.
Conclusion
The APTw technique is novel and has the potential to be a useful and sensitive tool for investigating the pathophysiology of MS. Increasing APTw signal intensity in MS lesions supports MS post-mortem histological results. Gadolinium-free APTw contrast mechanism provides promising insight into pathologies on a molecular level.Acknowledgements
This research was kindly supported by MS Research Australia. I. Khormi was supported by a PhD scholarship with annual grant support from the University of Jeddah, Saudi Arabia.References
1. Weidauer S, Raab P, Hattingen E. Diagnostic approach in multiple sclerosis with MRI: an update. Clinical Imaging 2021.
2. Weil M-T, Möbius W, Winkler A, et al. Loss of myelin basic protein function triggers myelin breakdown in models of demyelinating diseases. Cell reports 2016;16(2):314-322.
3. Lubetzki C, Stankoff B. Demyelination in multiple sclerosis. Handbook of clinical neurology. Volume 122: Elsevier; 2014. p. 89-99.
4. De Groot CJ, Bergers E, Kamphorst W, et al. Post-mortem MRI-guided sampling of multiple sclerosis brain lesions: increased yield of active demyelinating and (p)reactive lesions. Brain 2001;124(Pt 8):1635-1645.
5. Kuhlmann T, Ludwin S, Prat A, Antel J, Brück W, Lassmann H. An updated histological classification system for multiple sclerosis lesions. Acta Neuropathologica 2017;133(1):13-24.
6. Sartoretti E, Sartoretti T, Wyss M, et al. Amide Proton Transfer Weighted Imaging Shows Differences in Multiple Sclerosis Lesions and White Matter Hyperintensities of Presumed Vascular Origin. Frontiers in Neurology 2019;10:1307.
7. Falk Delgado A, Van Westen D, Nilsson M, et al. Diagnostic value of alternative techniques to gadolinium-based contrast agents in MR neuroimaging-a comprehensive overview. Insights Imaging 2019;10(1):84.
8. Ye H, Shaghaghi M, Chen Q, et al. In Vivo Proton Exchange Rate (kex) MRI for the Characterization of Multiple Sclerosis Lesions in Patients. Journal of Magnetic Resonance Imaging 2020.
9. Schuenke P, Windschuh J, Roeloffs V, Ladd ME, Bachert P, Zaiss M. Simultaneous mapping of water shift and B1 (WASABI)—application to field‐inhomogeneity correction of CEST MRI data. Magnetic resonance in medicine 2017;77(2):571-580.
10. Buckheit J, Chen S, Donoho D, Johnstone I, Scargle J. About wavelab. Handbook of WaveLab Version 1995;850:1-37.
11. Breitling J, Deshmane A, Goerke S, et al. Adaptive denoising for chemical exchange saturation transfer MR imaging. NMR in Biomedicine 2019;32(11):e4133.
12. Windschuh J, Zaiss M, Meissner JE, et al. Correction of B1‐inhomogeneities for relaxation‐compensated CEST imaging at 7 T. NMR in biomedicine 2015;28(5):529-537.
13. Terreno E, Stancanello J, Longo D, et al. Methods for an improved detection of the MRI‐CEST effect. Contrast media & molecular imaging 2009;4(5):237-247.
14. Dula AN, Asche EM, Landman BA, et al. Development of chemical exchange saturation transfer at 7 T. Magn Reson Med 2011;66(3):831-838.
15. By S, Barry RL, Smith AK, et al. Amide proton transfer CEST of the cervical spinal cord in multiple sclerosis patients at 3T. Magn Reson Med 2018;79(2):806-814.
Figures