3844
Detecting dopamine in vivo using paramagnetic CEST-MRI at 11.7T1Institute of Science and Technology for Brain-Inspired Intelligence, Fudan University, Shanghai, China, 2Department of Materials Science and State Key Laboratory of Molecular Engineering of Polymers, Fudan University, Shanghai, China, 3Department of Medical Ultrasound, Shanghai Tenth People’s Hospital, School of Medicine, Tongji University, Tongji University Cancer Center, Shanghai, China, 4Human Phenome Institute, Fudan University, Shanghai, China
Synopsis
Detecting dopamine in vivo is critical for understanding many neurologic and psychiatric disorders. In this work, we developed a paramagnetic CEST-MRI method for dopamine detection using NaHoF4@DBA nanoparticles. Our results showed that the dopamine in mouse brain can be selectively enriched in the surface of the nanoparticles and detected by CEST-MRI. Moreover, we found that the magnitude of ST% map reflecting dopamine levels in the brain of SZ mice was relatively higher than that of PD mice.
Introduction
Dopamine is an increasingly significant catecholamine neurotransmitter, which controls motor functions, motivation, and reward-related learning1. In vivo measurements of dopamine are critical for understanding many neurologic and psychiatric disorders, such as Parkinson’s disease (PD)2 and Schizophrenia(SZ)3. The existing methods to indirectly explore the dopamine system mainly include pharmacological MRI (phMRI), neuromelanin sensitive MRI (NM-MRI), and PET/SPECT techniques4. However, due to the low dopamine concentration in brain, direct in-vivo measurements of the dopamine concentrations are not currently accessible. In the present work, using Chemical Exchange Saturation Transfer (CEST) MRI at Ultra High-field combined with NaHoF4@3, 5-Dihydroxyphenylacetic acid (DBA) nanoparticles5,6, we aimed to measure dopamine concentration in mice brain at 11.7T. Furthermore, we investigated the alterations of dopamine concentration in brain diseases such as Parkinson’s disease (PD) and schizophrenia (SZ) on mice models.Materials and Methods
All experimental protocols were approved by the Animal Ethics Committee of Fudan University. A total of 9 C57BL/6J mice (male, 8 weeks old) obtained from Shanghai Slac Lab Animal Ltd (Shanghai, China) were divided equally into three groups: wild type (WT), Parkinson’s disease (PD) and schizophrenia (SZ). 10 mL NaHoF4@DBA, a set of dopamine attractive nanoparticles, were stereotaxically injected into the right striatum to each mouse 2~3 hours before MRI experiments.In vitro and in vivo experiments were performed on a 500 MHz Bruker Avance III spectrometer equipped with a BBO probe and a 11.7 T BioSpec 117/16 USR MRI system equipped with a CryoProbe (Bruker BioSpin, Ettlingen, Germany), respectively.
In vivo single-slice CEST images were obtained by a ultrashort echo time (UTE) based steady-state CEST scheme (UTE-CEST)7 with the following parameters: B1=1.5, 5, and 10 mT; duration =30 ms, 100 ms; TR/TE=40/0.375 ms, 110/0.375 ms; spatial resolution, 0.16 × 0.16 × 1 mm3. Saturation offsets were distributed between -80 and 80 ppm with denser sampling around 60ppm and S0 was set at 200 ppm.
MRI data was processed using MATLAB R2018a software (Mathworks, Natick, MA, USA). After normalization, B0 inhomogeneity correction, and wavelet denoising, the Dopamine signal was assessed from MTRasym map as: ST%=100×(S58ppm-S-58ppm)/S0.
Results and Discussion
Fig.1a presented normalized Z spectra and corresponding MTRasym spectra of phantoms containing different concentrations of dopamine grafted onto the surface of NaHoF4@DBA nanoparticles. The signal at 58~61 ppm increased with the increasing dopamine concentrations (0~800 μmmol/L). But no significant signal was observed for other potentially interfering metabolites with similar chemical structures (Fig. 1b). The chemical shift between water and amine protons increased markedly from around 3 ppm to 60 ppm, due to the paramagnetic effect of NaHoF4. Fig. 1c showed the CEST reference image at 200 ppm using CEST-UTE sequence. The injection site with hypo-intensive signal due to the paramagnetic shortening of T2 was outlined in line. The corresponding Z spectrum from this ROI (red) showed an obvious dip at around 60 ppm (Fig.1d) compared with contralateral tissue(blue), which agreed with the in vitro experiments. This meant that the esterification reaction of DBA on the surface of nanoparticles with dopamine in the brain enriched dopamine to a detectable level. For the optimization of the irradiation powers, Z-Spectra and ST (60 ppm) maps were acquired with various B1 and saturation times (Fig.2). The signal-to-noise ratios increased with B1 but not significantly increased with the saturation time. The {B1, Sat} combination of {5μT, 30ms} was used for the subsequent experiments. Fig.3 illustrated ST% (60 ppm) maps and Z-Spectra of WT (left), PD (middle), and SZ (right) mouse brains, respectively. As shown in Fig. 3a, ST% map from SZ mouse brain presented a higher CEST contrast on the injection site compared to WT mouse brain while the ST% map from PD mouse brain showed relatively lower contrast. The Z-spectra in Fig. 3b also reflected different features of dopamine metabolism in PD and SZ.Conclusion
In this work, we investigated the measurements of dopamine levels by a paramagnetic CEST MRI method with NaHoF4@3, 5-Dihydroxyphenylacetic acid (DBA) nanoparticles injection into mouse brain at 11.7 T. Our results showed significantly enhanced CEST signals at around 60 ppm on injection site in mouse brain, which was in good agreement with the dopamine phantom measurements. Moreover, we found that the magnitude of ST% map, reflecting dopamine levels in the brain of SZ mice, was slightly higher than that of PD mice. Further study of a larger sample size is necessary to elucidate the sensitivity and specificity for the measurement.Acknowledgements
This work was supported by grants from the National Natural Science Foundation of China (Grant No. 5210020792), the China Postdoctoral Science Foundation (Grant No. BX20200245, 2020M681397).
References
1. Liu, C. & Kaeser, P. S. Mechanisms and regulation of dopamine release. Curr. Opin. Neurobiol. 57, 46–53 (2019).
2. Warren, N., O’Gorman, C., Lehn, A. & Siskind, D. Dopamine dysregulation syndrome in Parkinson’s disease: A systematic review of published cases. J. Neurol. Neurosurg. Psychiatry 88, 1060–1064 (2017). 3. Howes, O. D., McCutcheon, R., Owen, M. J. & Murray, R. M. The Role of Genes, Stress, and Dopamine in the Development of Schizophrenia. Biol. Psychiatry 81, 9–20 (2017).
4. Reneman, L., van der Pluijm, M., Schrantee, A. & van de Giessen, E. Imaging of the dopamine system with focus on pharmacological MRI and neuromelanin imaging. Eur. J. Radiol. 140, 109752 (2021).
5. Qian, C. G. et al. Conjugated Polymer Nanoparticles for Fluorescence Imaging and Sensing of Neurotransmitter Dopamine in Living Cells and the Brains of Zebrafish Larvae. ACS Appl. Mater. Interfaces 7, 18581–18589 (2015).
6. Ferrauto, G., Di Gregorio, E., Delli Castelli, D. & Aime, S. CEST-MRI studies of cells loaded with lanthanide shift reagents. Magn. Reson. Med. 80, 1626–1637 (2018).
7. Chen, L. et al. Protein aggregation linked to Alzheimer’s disease revealed by saturation transfer MRI. Neuroimage 188, 380–390 (2019).
Figures
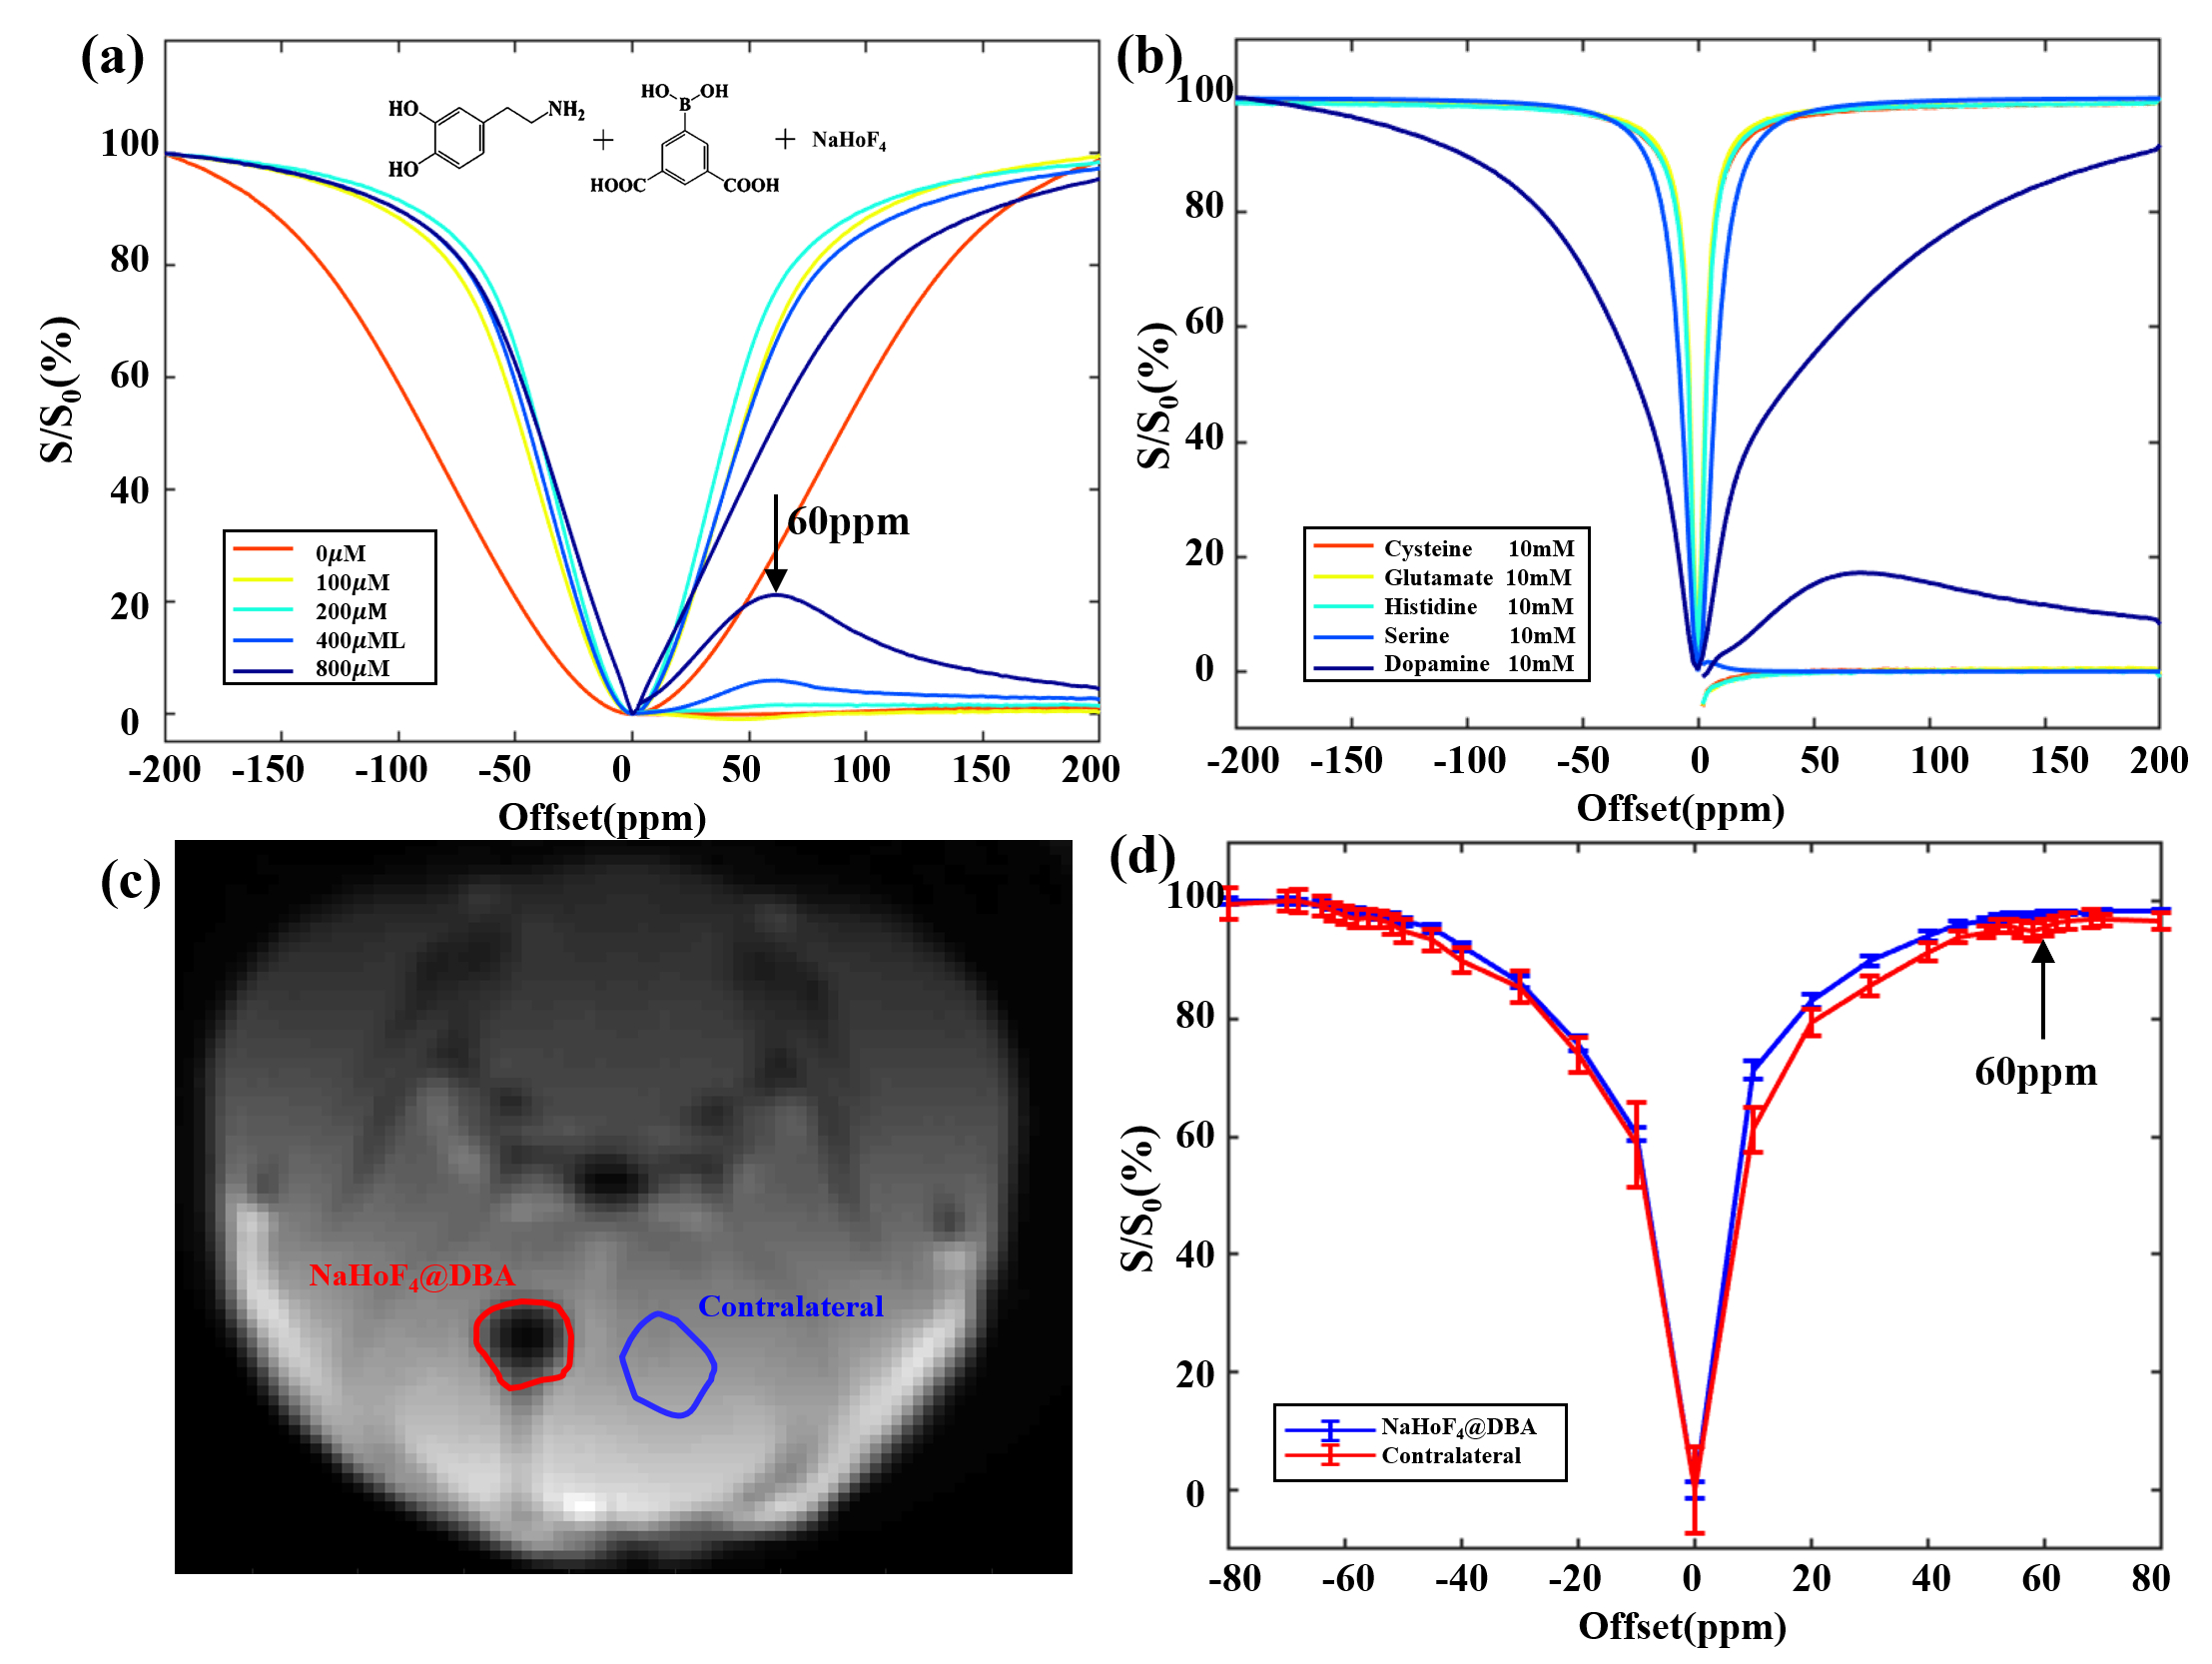
Fig.1. (a) Z-Spectra and MTRasym spectra from different concentrations of dopamine and (b) other potentially interfering metabolites dissolved in NaHoF4@DBA nanoparticles. (c) Representative CEST image obtained after the injection of NaHoF4@DBA in mouse brain and (d) corresponding Z-spectra of injection and contralateral regions.
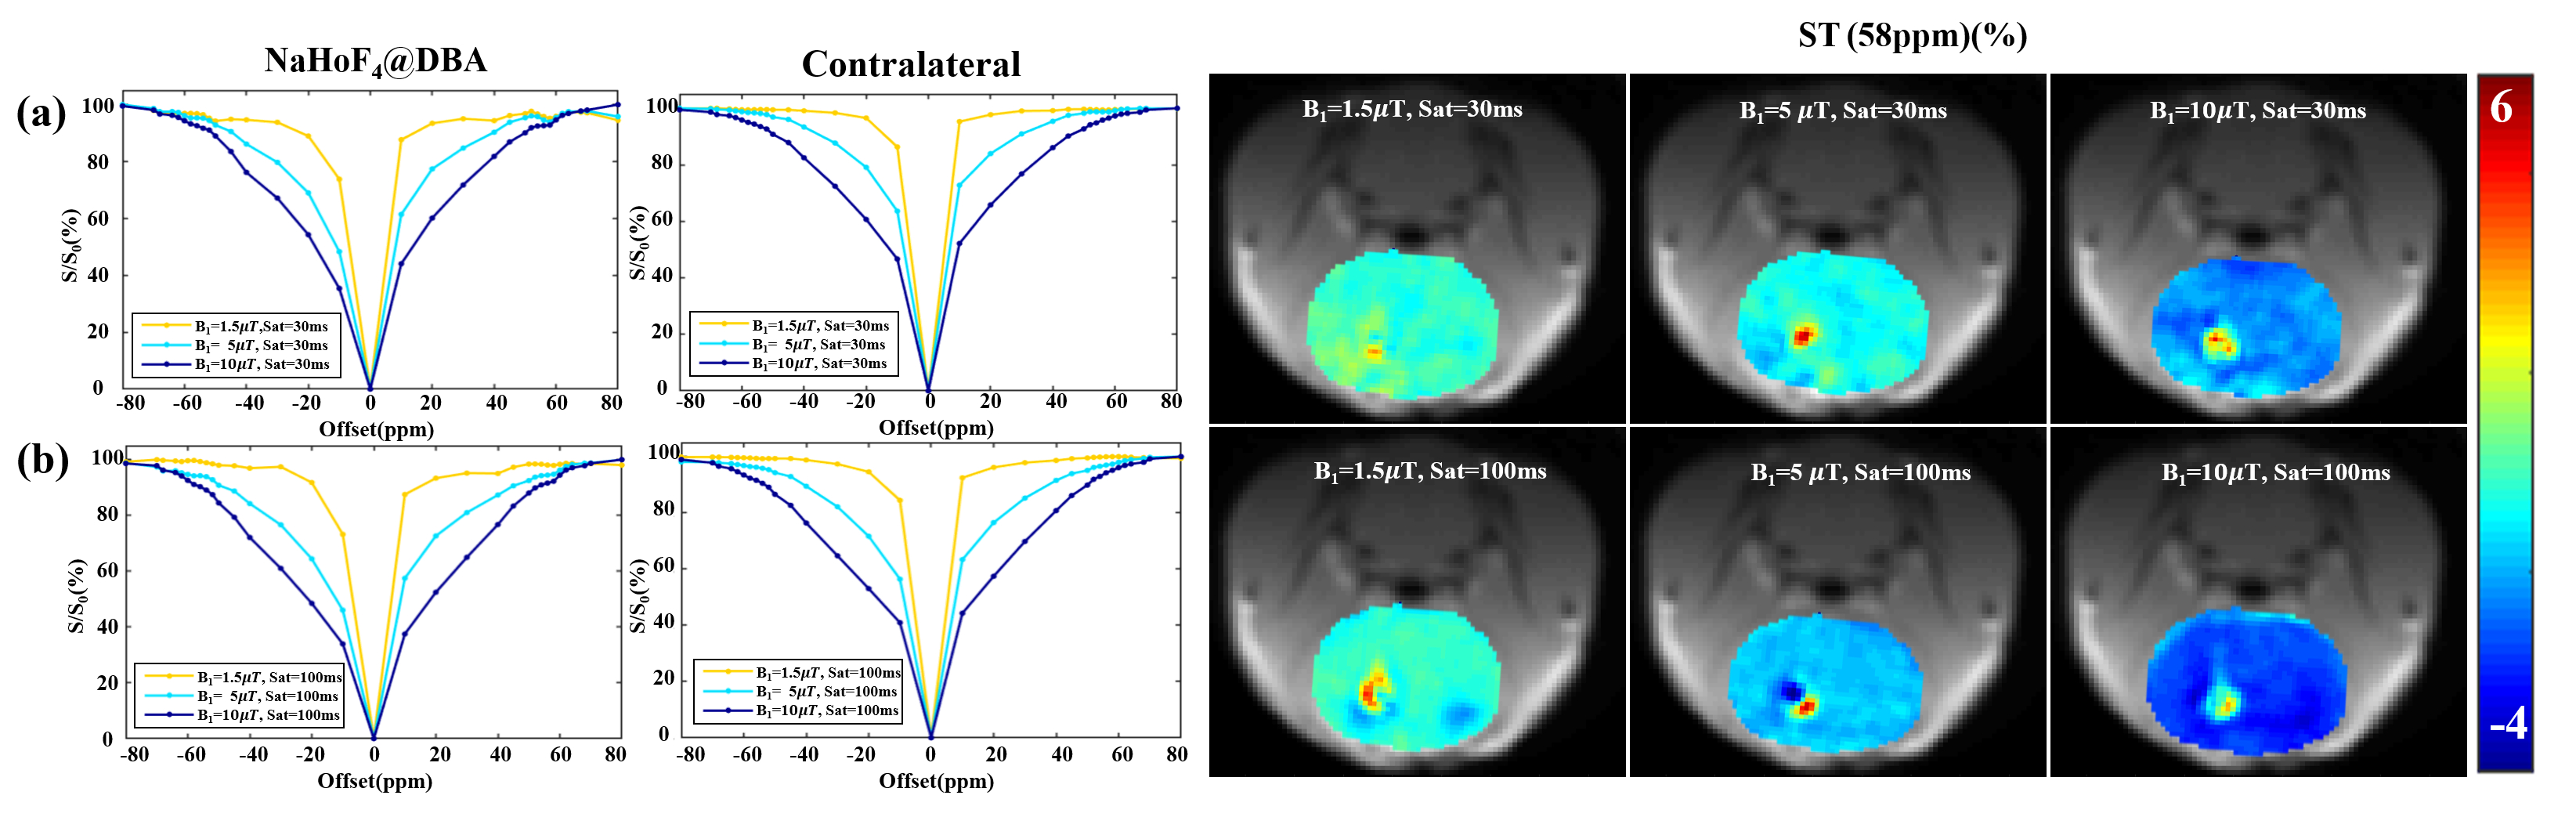
Fig.2. Z-Spectra of injection and contralateral regions with different saturation amplitudes (a) and with different saturation time (b) in one mouse brain and corresponding ST (60 ppm) maps.
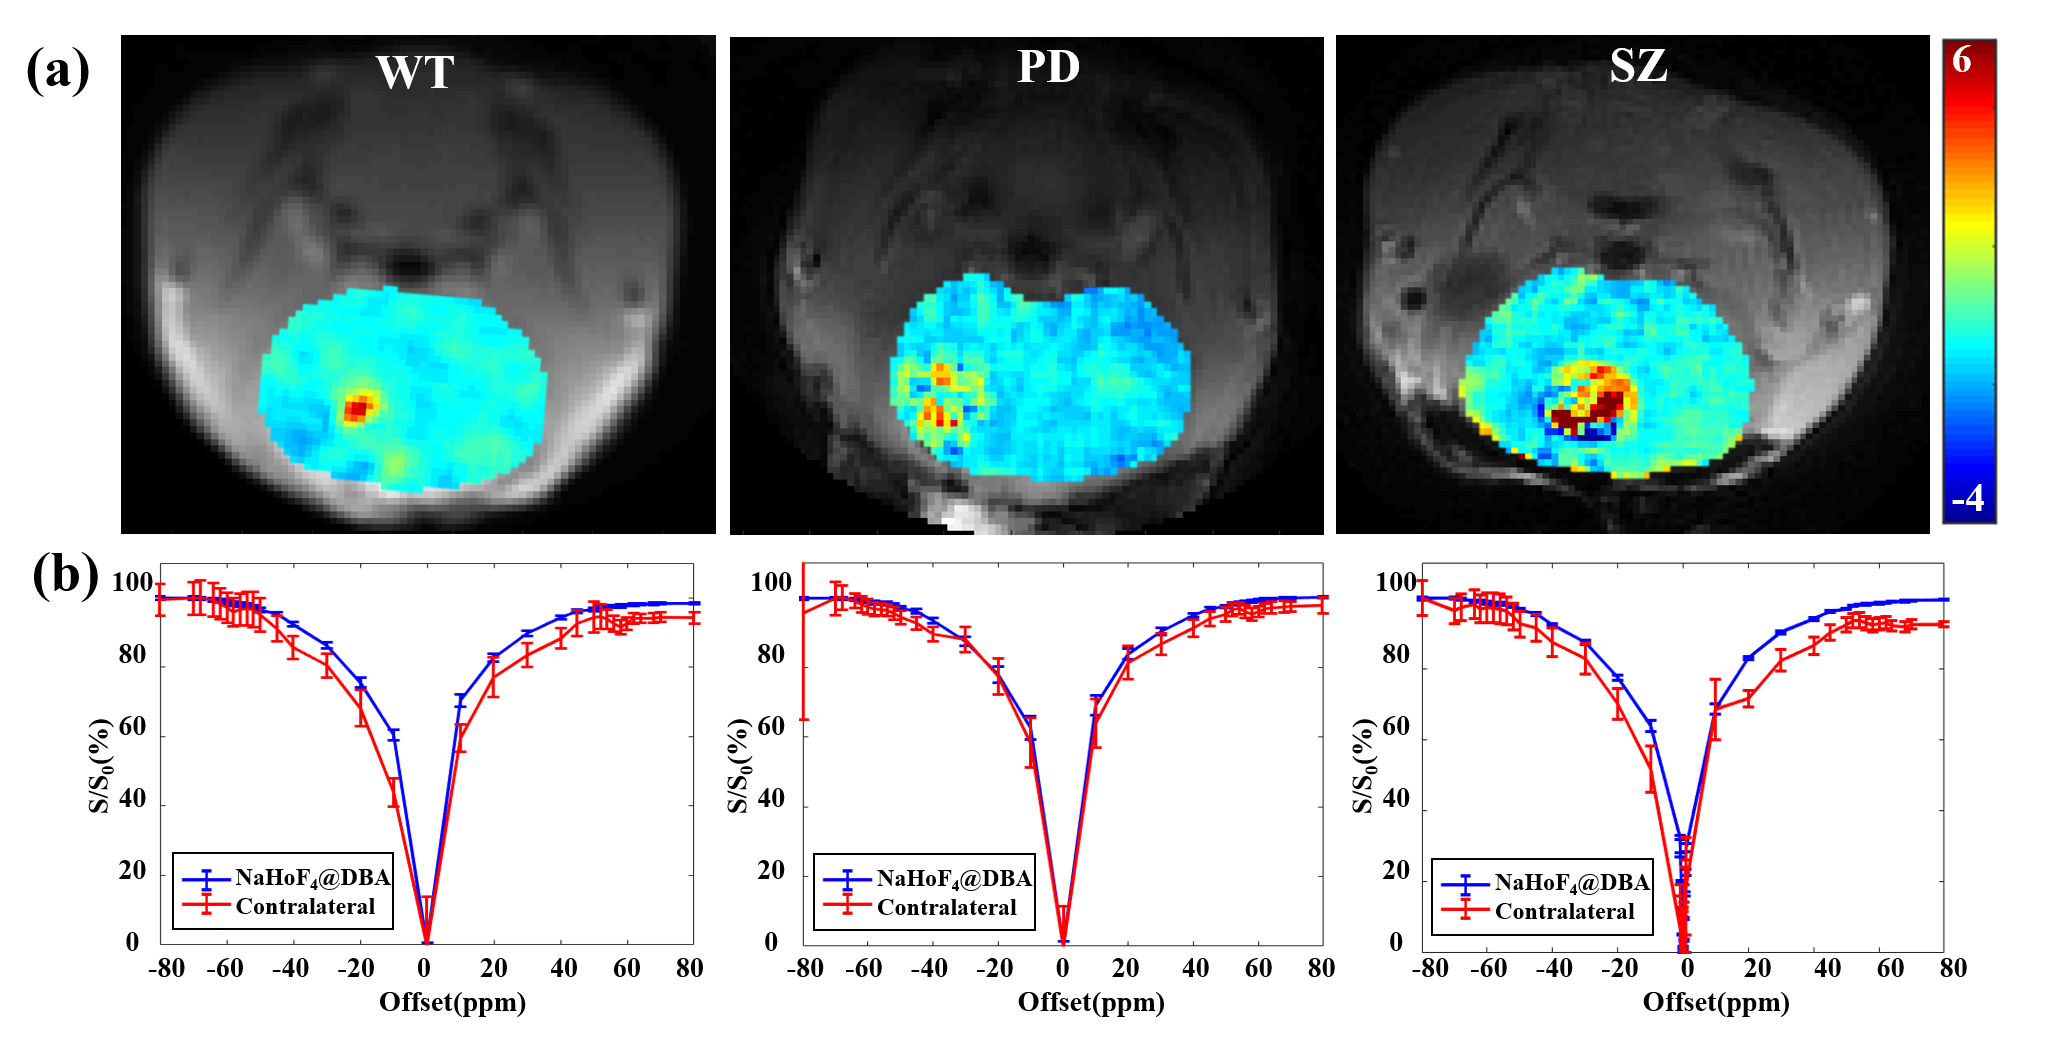
Fig.3. (a) ST (60 ppm) maps of WT (left), PD (middle), and SZ (right) mice brain and (b) corresponding Z-Spectra of injection (red curves) and contralateral (blue curves) regions.