3842
Deuterium metabolic imaging for glioma in rat model using [2,3,4,6,6’-2H5]glucose1Shenzhen Institutes of Advanced Technology, Chinese Academy of Sciences, Shenzhen, China, 2Shenzhen Dingbang Bioscience Co., Ltd., Shenzhen, China, 3iHuman Institute, ShanghaiTech University, Shanghai, China, 4Southern University of Science and Technology, Shenzhen, China
Synopsis
Deuterium MRS(I) has emerged as a novel metabolic imaging method. However, the deuterium labeled substrate such as [6,6’-2H2]glucose is expensive, which becomes one of the obstacles for the clinical translation of this technique. Recently, we developed a cost-effective synthesis route for a new deuterated compound [2,3,4,6,6’-2H5]glucose. The cost of [2,3,4,6,6’-2H5]glucose is significantly lower than the [6,6’-2H2]glucose. In this study, we demonstrate that this new compound can measure the glycolytic flux through a rat glioma model.
Introduction
Glycolytic flux is an important biomarker of tumor malignancy 1. Recently, deuterium MRS(I) has emerged as a quantitative metabolic imaging modality for measuring the glycolytic flux noninvasively by using the deuterium labeled glucose 2. However, the deuterated substrate such as [6,6’-2H2]glucose is expensive, which becomes one of the obstacles for the clinical translation of this technique. Recently, we developed a new compound [2,3,4,6,6’-2H5]glucose synthesized from methyl α-D-glucopyranoside and D2O directly. The lower cost in the synthesis substrates and the higher deuterium conversion rate resulted in the significant reduction in the synthesis cost compared to the [6,6’-2H2]glucose. The purpose of this study was to confirm this new compound can quantify the glycolytic flux through a rat glioma model.Methods
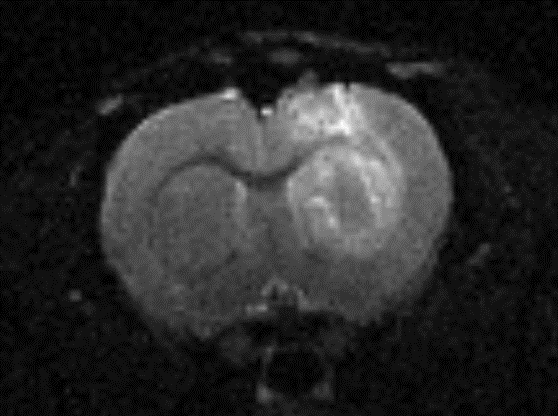
Animal preparation: Four SD rats were used for the animal study. Three of them were implanted with glioma while one used as control. The [2,3,4,6,6’-2H5]glucose dissolved in saline was administered through rat tail vein with a dosage of 1.95 g/kg body weight. During the MR data acquisition, the animal was anesthetized with isoflurane.MR scan: The experiment were all conducted on a Bruker BioSpec 94/30 9.4T animal system (Bruker, Ettlingen, Germany). A home built surface coil consisting of two loops was placed closely to the glioma to acquire 1H/2H MR signals. T2 weighted 1H images were acquired for the anatomical description of the tumor. The parameters were: TR/TE=3000/81 ms, matrix = 160 * 120, resolution = 0.2mm*0.2mm. The 2H spectra was acquired by a single pulse acquire sequence. The parameters were: TR = 300ms, FA = 60°, bandwidth = 2kHz, resolution = 256, number of average = 600, resulting in an acquisition time of 3 minutes for a single spectrum. A 2H spectrum was acquired before the infusion of deuterated glucose for the quantification of the natural abundance of 2H. The 2H spectra were then acquired for 50 repetitions lasting a total time of 150 minutes after the glucose infusion.
Data processing: all spectra were processed by home-written code in MATLAB (R2020a, NATICK, USA). Signal intensities of HDO, glucose (glc), glutamine/glutamate (glx) and lactate (lac) were estimated by fitting the spectra to a mixed Lorentzian model.
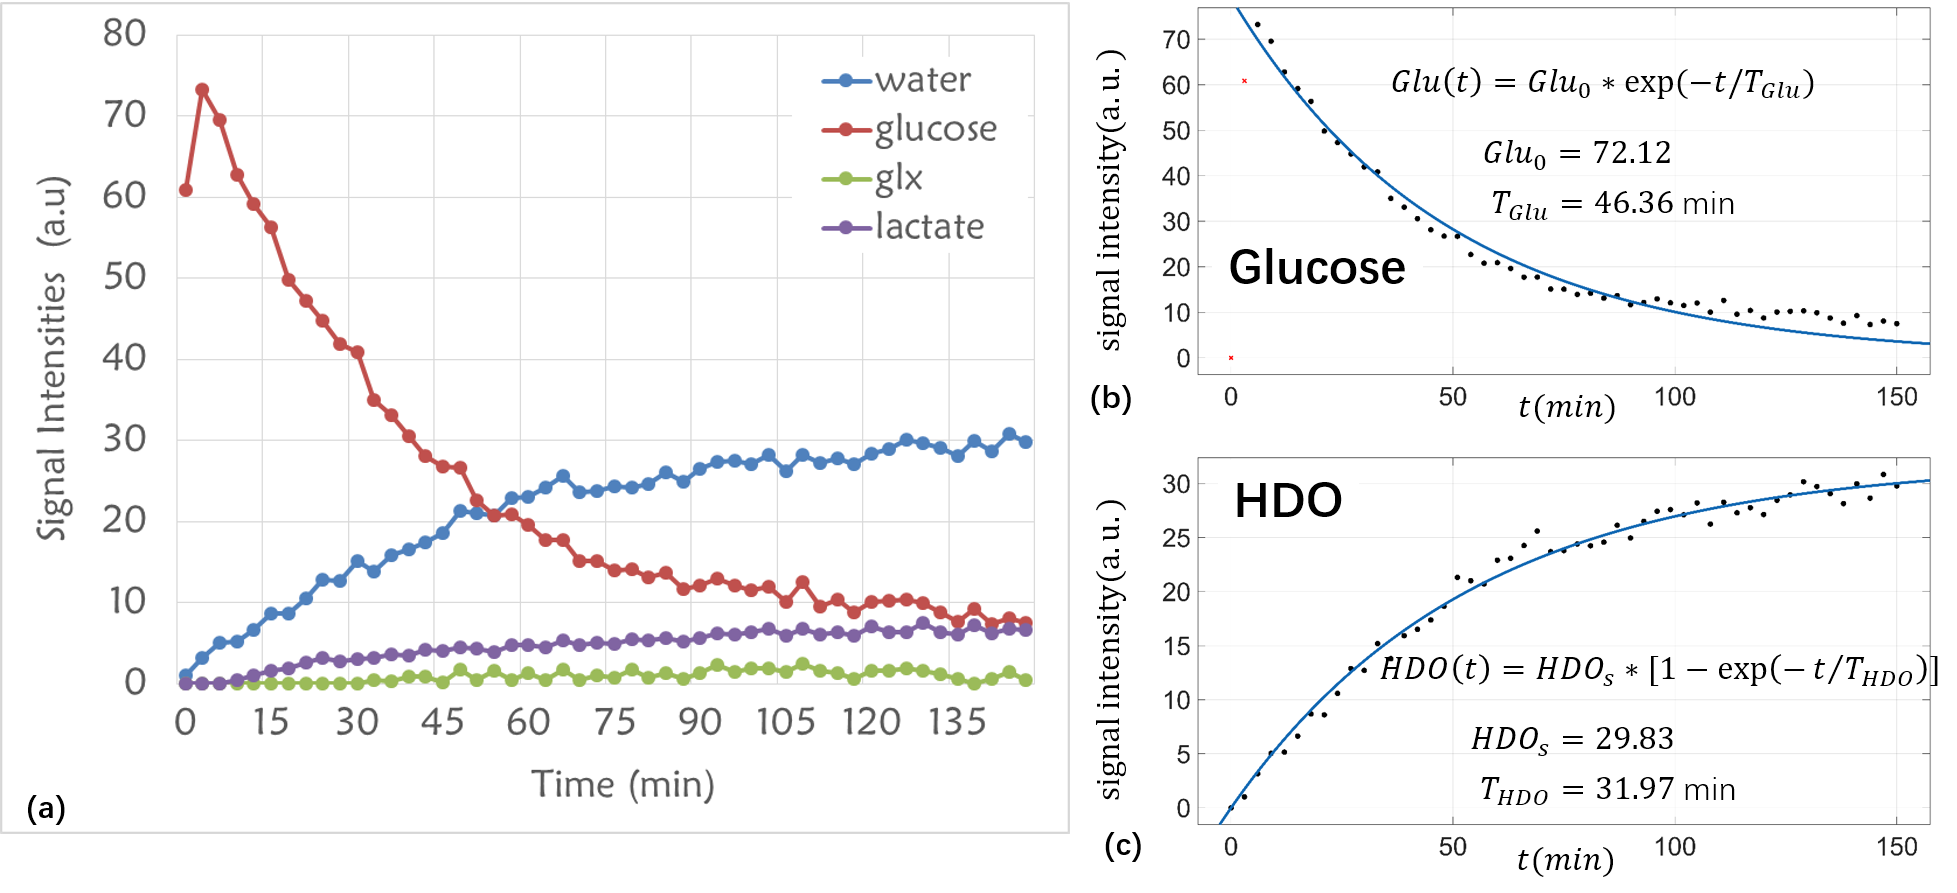
Kinetic model: a single-pool kinetic model was exploited to describe how the concentration of the metabolites change over the 150 minutes.The kinetic parameters were compared between the tumor and control groups.
Results
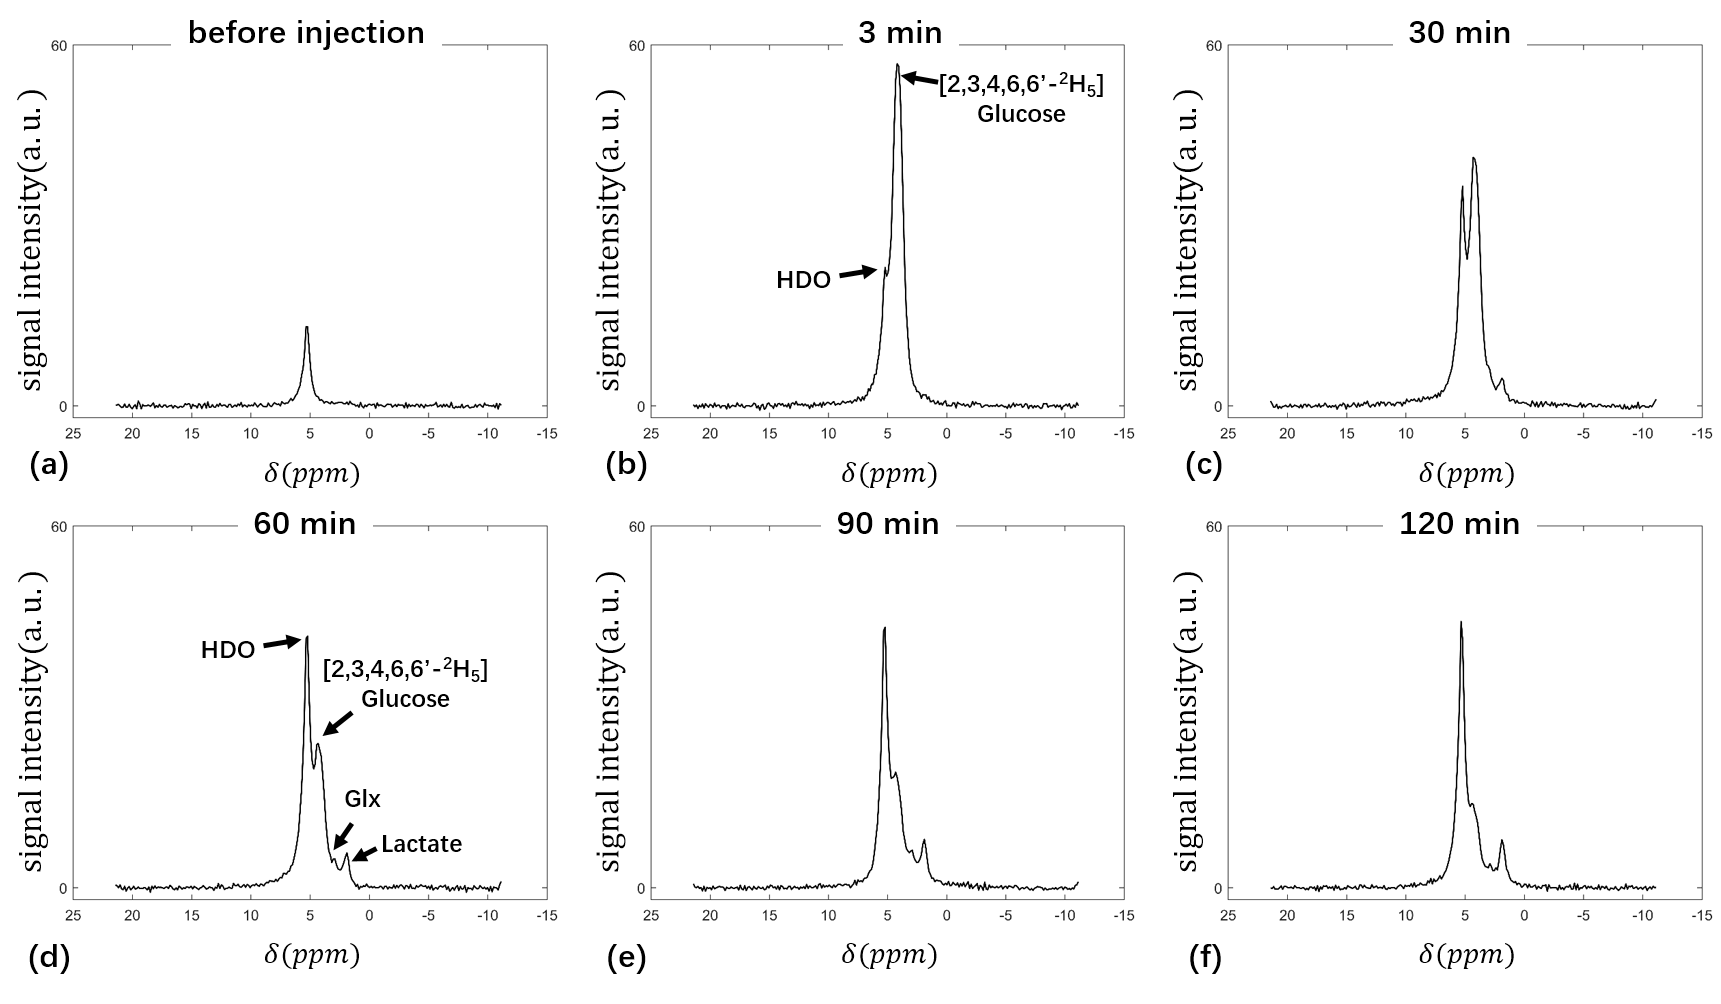
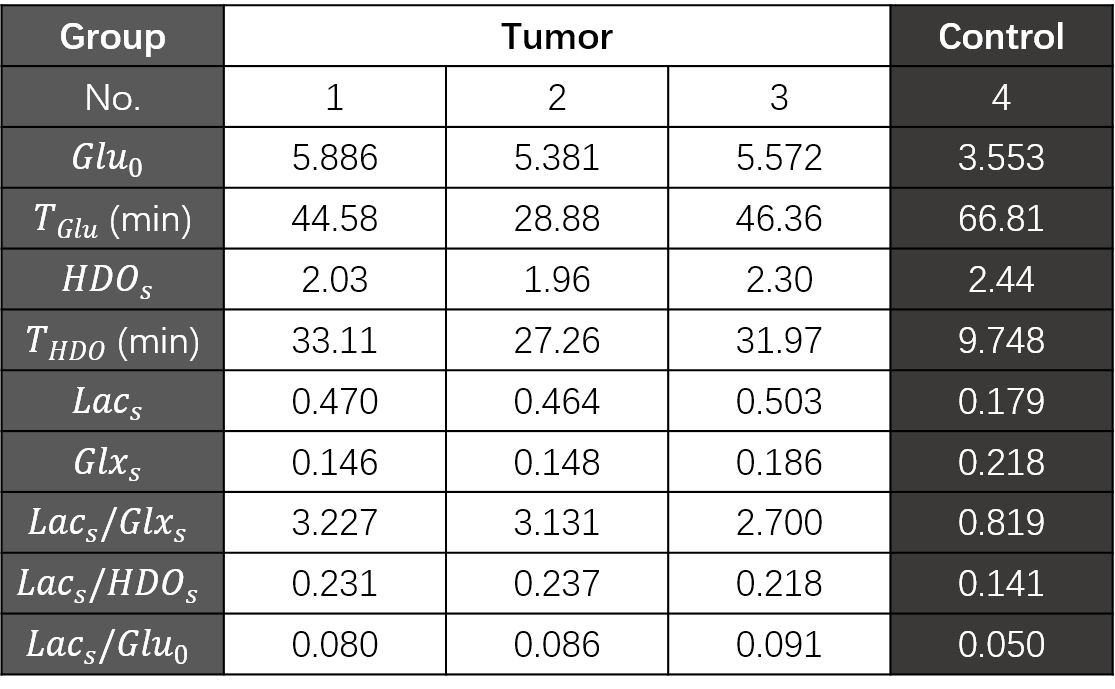
The 2H spectra acquired at multiple time points of one rat with glioma are shown in Figure 1. The signal intensity change curves of glucose, HDO, glx and lactate in this rat are plotted in Figure 2. The kinetic parameters of these metabolites in four rats are summarized and compared in Table 1. The intensity values in Table 1 were all normalized to the natural abundance of 2H acquired before glucose infusion. The tumor group showed higher uptake level (5.613±0.208 vs. 3.553), and a faster consumption rate (39.94±7.85 min vs. 66.81 min) of glucose than the control group. The tumor group also produced more lactate than the control group (0.479±0.017 vs. 0.179). The ratio of lac/glx was almost 4 times higher in the tumor group (3.019±0.229 vs. 0.819), and the conversion rate from the glucose to lactate was obviously higher in the tumor group (0.086±0.004 vs. 0.050), all indicating the Warburg effect in the tumors 3.Discussion and Conclusion
The study demonstrated the feasibility of the deuterium metabolic imaging through [2,3,4,6,6’-2H5]glucose in a glioma rat model. Besides the reduction in synthesis cost, the use of [2,3,4,6,6’-2H5]glucose is expected to have higher sensitivity due to the higher level of 2H enrichment, which is beneficial in improving the temporal/spatial resolution. The increased signal intensities in 2H also makes the direct imaging of HDO/glucose possible 4. Further study will include the direct comparison to the [6,6’-2H2]glucose in more animal samples. Kinetic model with multiple compartment will be further investigated to describe the metabolic activity more accurately. In conclusion, the study verified the ability of [2,3,4,6,6’-2H5]glucose in metabolic imaging. The reduction in cost will facilitate the deuterium metabolic imaging in the glucose metabolism related studies.Acknowledgements
The research is supported by the Guangdong Grant for Key Technologies for Treatment of Brain Disorders (No. 2018B030332001); the Scientific Instrument Innovation Team of the Chinese Academy of Sciences (No. GJJSTD20180002).References
1. Felix Kreis, Alan J. Wright, Friederike Hesse, Maria Fala, De-en Hu, and Kevin M. Brindle. Measuring Tumor Glycolytic Flux in Vivo by Using Fast Deuterium MRI, Radiology, 2020 294:2, 289-296.
2. H. M. De Feyter, K. L. Behar, Z. A. Corbin, R. K. Fulbright, P. B. Brown, S. McIntyre, T. W. Nixon, D. L. Rothman, R. A. de Graaf, Deuterium metabolic imaging (DMI) for MRI-based 3D mapping of metabolism in vivo. Science Advances, 2018, 4, eaat7314
3. Warburg O, Wind F, Negelein E. The Metabolism of Tumors in the Body. J Gen Physiol 1927;8(6):519-530.
4. Mahar R, Zeng H, Giacalone A, Ragavan M, Mareci TH, Merritt ME. Deuterated Water Imaging of the Rat Brain Following Metabolism of [2H7]Glucose. Magn Reson Med. 2021; 85(6): 3049- 3059.
Figures