3841
Which CEST technique provides most insight into tumors – 3T APTw, 3T CEST-MRF or 7T multi-pool CEST?
Maria Sedykh1, Moritz Fabian1, Kai Herz2,3, Or Perlman4, Christian Farrar4, Angelika Mennecke1, Manuel Schmidt1, Arnd Dörfler1, and Moritz Zaiss1,2
1Neuroradiology, FAU Erlangen-Nuremberg, University Hospital, Erlangen, Germany, 2Magnetic Resonance Center, Max-Planck-Institute for Biological Cybernetics, Tübingen, Germany, 3Biomedical Magnetic Resonance, University of Tübingen, Tübingen, Germany, 4Radiology, Athinoula A. Martinos Center for Biomedical Imaging, Massachusetts General Hospital and Harvard Medical School, Charlestown, MA, United States
1Neuroradiology, FAU Erlangen-Nuremberg, University Hospital, Erlangen, Germany, 2Magnetic Resonance Center, Max-Planck-Institute for Biological Cybernetics, Tübingen, Germany, 3Biomedical Magnetic Resonance, University of Tübingen, Tübingen, Germany, 4Radiology, Athinoula A. Martinos Center for Biomedical Imaging, Massachusetts General Hospital and Harvard Medical School, Charlestown, MA, United States
Synopsis
We report on only one glioblastoma patient, but who could be measured with several different CEST MRI methods: 3T APTw, 3T CEST fingerprinting, and 7T multi-pool CEST in order to reveal their relative performance and correlations. Coarse features can be observed in all methods, with MRF and 7T CEST being more versatile in non-active tumor parts. Isolation, separation and smarter combination of different CEST contrast is still needed to improve the diagnostic performance of CEST.
Introduction
Many CEST techniques were shown to provide insight into tumors, e.g. 3T APTw imaging, 3T CEST fingerprinting, and 7T multi-pool CEST. Herein we report one case of a patient diagnosed with glioblastoma, WHO grade IV, who could be measured with all above mentioned techniques in order to reveal their relative performance and correlations.Materials and Methods
The patient was measured at a Siemens PRISMA scanner (3T, 64-Rx, 1Tx) and Siemens TERRA scanner (7T, 32-Rx, 8 pTx coil) after written informed consent.The 3T APTw following the standard APTw_001(3) (pulsed rf irradiation of 2 s duration at DC = 90% and a 2 µT B1 level) was applied followed by a centric 3D snapshot gradient echo readout (2x2x5mm, FA=7°, TE/TR = 2ms/4ms). APTw contrast was achieved by asymmetry analysis evaluated at 3.5 ppm(4).
The 3T CEST MRF pulseq-files(1, 2) were played out followed by a 3D-EPI readout (1.93mm isotropic, FA=8°, TE=11ms, ETL = 24.3 ms). The post-processing of the data included the usage of neural networks and was performed according to (2), generating maps for MT pool fraction fmt and exchange rate kmt, and solute amide fraction fs and exchange rate ks. With the same readout, low resolution T1 and T2 maps were acquired for comparison.
The 7T multi-pool CEST protocol was measured with the MIMOSA approach (5) at 0.72 μT and 1.00 μT followed by a centric 3D snapshot gradient echo (1.7x1.3x3mm, TE/TR = 1.77/3.7 ms, FA = 6°). The evaluation was performed using a multi-pool Lorentzian fitting following (6).
All data was motion corrected and coregistered using SPM. Figure 1 shows exemplary data of the different techniques in tumor and WM ROIs.
Results
The tumor area can be outlined in all presented maps Figure 2a-c), but with different apparent features. The well-established 3T-APTw highlights brightly the overall tumor area, including necrotic and the liquefied tissue in the cyst, clearly identified by the long T1 and T2 values (see ROI def. in Figure 2a). In most 3T MRF and all 7T multi-pool contrasts, the cyst and the necrotic area is hypo-intense, in 3T MRF kmt necrosis is hyper-intense. While the selective 7T-amide-CEST shows similar areas highlighted as 3T-APTw (except for cyst and necrosis), the quantitative MRF amide exchange rate ks and concentration fs do not show elevated signals.Most contrast in 3T MRF is seen in the MT pool fraction fmt and exchange rate kmt, the latter correlated to the MT line-width. This challenges the assumed amide contribution to APTw imaging; more plausible from these insights is that MTRasym-based APTw is increased due to lower and broader MT and probably decreased NOE, both visible in the 7T maps.
Another contradiction is that 7T amide-CEST is most similar to kmt, except for the necrosis, as 7T amide CEST should be isolated from MT and should correlate with fs*ks instead, which is also not observed. The most plausible correlation is observed between fmt, 7T MT and 7T NOE and T1 and T2, as lowered MT pool size fmt is (anti-)correlated with all values: fmt, 7T MT and 7T NOE all are hypo-intense in the tumor region, and WM brighter than GM, T1 and T2 the other way around. The observed pattern in the ROI bar plots is therefore also very similar; interestingly the 3T-APTw shows a similar pattern as T1 and T2, and the inverted pattern of fmt, 7T MT and 7T NOE.
The 3T MRF MT exchange rate map shows increased values in the tumor area, but kmt was found to be decreased in animal tumors(2).
Only APTw imaging and fmt showed the edema with clearly different intensity compared to tumor tissue.
Discussion
Most prominent findings are (i) that 3T APTw has most probably a strong relaxation and MT contribution, as discussed before (7-9). Still, 7T amide CEST and 3T APTw partly correlate. (ii) 7T and most MRF maps identify the necrosis and the cyst properly hypointense, while APTw shows the cyst even brighter than the contrast enhancing tumor area, which is in line with published liquefied-tissue artefacts in APTw imaging (10, 11). (iii) The MRF fmt contrast is in line with MT and relaxation findings, however, the outcome of MRF kmt, fs and ks is unexpected compared to previous animal data, as well as compared to the 7T insights. As MRF has the most complicated pipeline, further investigations are needed for interpretation.Until now, only a combination of APTw, T2 and 7T amide-CEST and a MTC map allows to distinguish all mentioned tissue types (GM, WM, T1CE, necrosis, and edema), where the 7T amide CEST shows most versatile structures in the tumor, most similar to the Gd enhancement around the central necrotic area. As replacement for a Gd-enhanced image, best candidates seem to be 7T amide-CEST and T2, or 3T APTw and T2.
Conclusion
We showed an unseen variety of CEST imaging methods applied in the same brain tumor patient. Coarse features can be observed in all methods, with MRF and 7T CEST being more versatile in non-active tumor parts. Isolation, separation and smarter combination of different CEST contrast is still needed to improve the diagnostic performance of CEST.Acknowledgements
No acknowledgement found.References
- Pulseq-CEST: Towards multi-site multi-vendor compatibility and reproducibility of CEST experiments using an open-source sequence standard. Kai Herz, Sebastian Mueller, Or Perlman, Maxim Zaitsev, Linda Knutsson, Phillip Zhe Sun, Jinyuan Zhou, Peter van Zijl, Kerstin Heinecke, Patrick Schuenke, Christian T. Farrar, Manuel Schmidt, Arnd Dörfler, Klaus Scheffler, Moritz Zaiss. Magn Reson Med. 2021 Oct;86(4):1845-1858. doi: 10.1002/mrm.28825. Epub 2021 May 7. PMID: 33961312.
- AI boosted molecular MRI for apoptosis detection in oncolytic virotherapy. Or Perlman, Hirotaka Ito, Kai Herz, Naoyuki Shono, Hiroshi Nakashima, Moritz Zaiss, E Antonio Chiocca, Ouri Cohen, Matthew S Rosen, and Christian T Farrar. https://doi.org/10.1101/2020.03.05.977793
- https://github.com/kherz/pulseq-cest-library/tree/master/seq-library/APTw_3T_001_2uT_ 36SincGauss_DC90_2s_braintumor
- The next snapshot CEST for fast 3D APTw imaging at 3T. Patrick Liebig, Maria Sedykh, Kai Herz, Moritz Fabian, Angelika Mennecke, Manuel Schmidt, Arnd Dörfler, and Moritz Zaiss, ISMRM DS 2021
- Multiple interleaved mode saturation (MIMOSA) for B1+ inhomogeneity mitigation in chemical exchange saturation transfer. Andrzej Liebert et al. Magnetic resonance in medicine 82.2 (2019), pp. 693–705.
- 7 tricks for 7T CEST – improving reproducibility of multi-pool evaluation. Katrin Michaela Khakzar, 8th International Workshop on Chemical Exchange Saturation Transfer Imaging, 2020.
- Relaxation-compensated CEST-MRI of the human brain at 7T: Unbiased insight into NOE and amide signal changes in human glioblastoma. Moritz Zaiss, Johannes Windschuh, Daniel Paech, Jan-Eric Meissner, Sina Burth, Benjamin Schmitt, Philip Kickingereder, Benedikt Wiestler, Wolfgang Wick, Martin Bendszus, Heinz-Peter Schlemmer, Mark E. Ladd, Peter Bachert, Alexander Radbruch. NeuroImage, ISSN 1053-8119, https://doi.org/10.1016/j.neuroimage.2015.02.040.
- Demonstration of fast multi‐slice quasi‐steady‐state chemical exchange saturation transfer (QUASS CEST) human brain imaging at 3T. Kim H., Krishnamurthy L. C., Sun P. Z. Magnetic Resonance in Medicine. – 2021.
- Towards the complex dependence of MTRasym on T1w in amide proton transfer (APT) imaging. Zu, Z. (2018). NMR in Biomedicine, 31(7), e3934.
- Magnetization Transfer Ratio based Metric for APTw or CESTw MRI Suppressing Signal from Fluid Compartments - Initial Application to Glioblastoma Assessment. Jochen Keupp, Osamu Togao. ISMRM 2018
- Fluid suppression in CEST imaging affects predominantly IDH-mutant 1p/19q retained gliomas with T2- FLAIR mismatch. Stefano Casagranda, Laura Mancini, Guillaume Gautier, Philippe Peter, Bruno Lopez, et al.. ISMRM 29th Annual Meeting, Aug 2020, Paris, France. hal-03241436
Figures
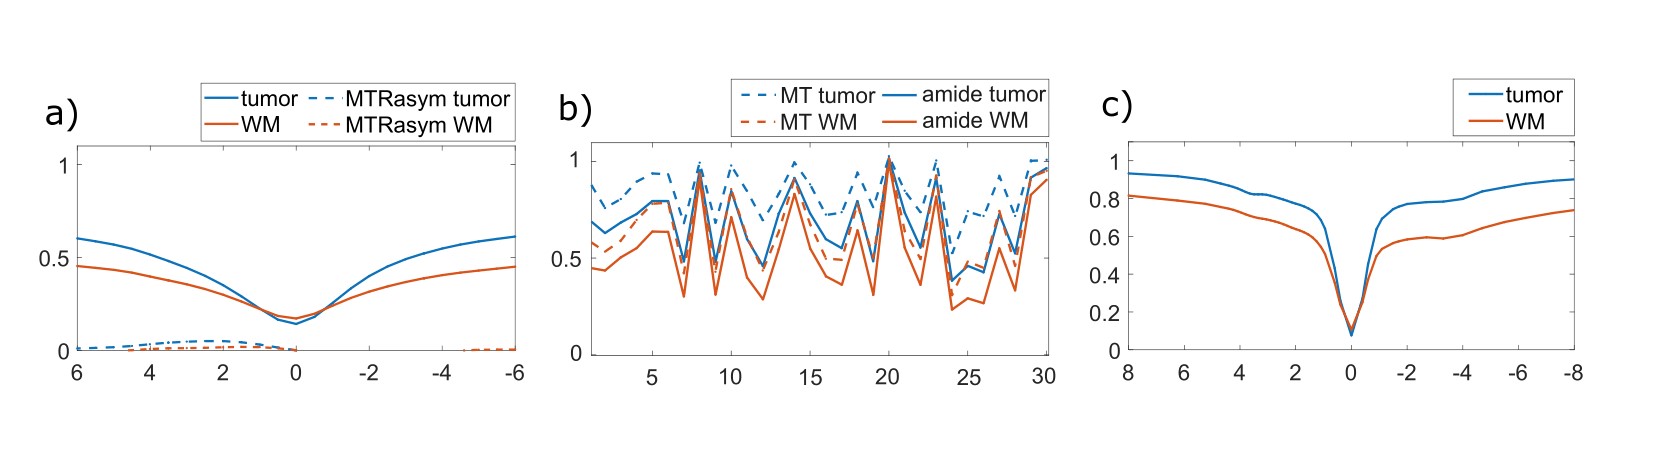
Figure 1: a) 3T APTw CEST spectrum b) 3T CEST MRF fingerprint and c) 7T multi-pool CEST spectrum in tumor and WM ROI of the same patient.
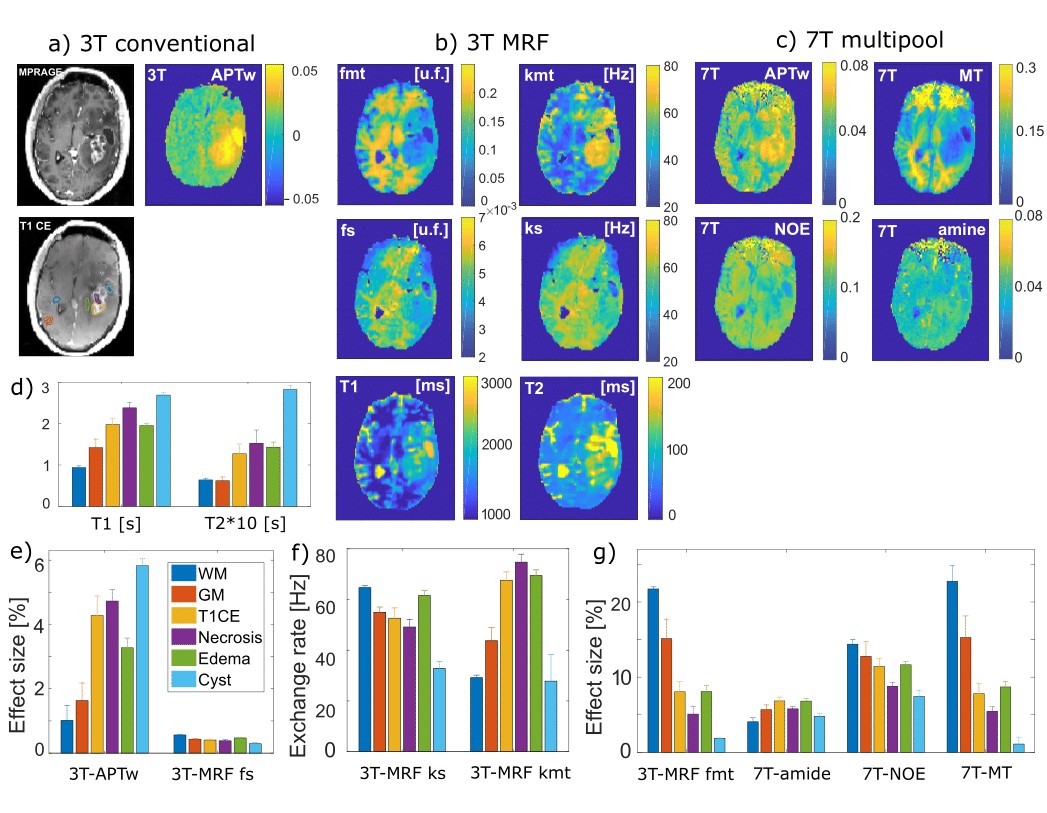
Figure 2: a) 3T clinical imaging post-CA and conventional
APTw imaging. b) 3T CEST MRF fingerprinting concentration and exchange rate
maps given in unit fraction and Hz and T1/T2 maps. c) 7T multi-pool CEST Lorentzian
amplitude maps. d-g) ROI-averaged values of all contrast maps, defined by ROIs
shown in a).
DOI: https://doi.org/10.58530/2022/3841