3839
Quantification of CMRO2 in Posterior Fossa Area Using Dynamic 17O-MRI1Dept. of Radiology, Medical Physics, Medical Center University of Freiburg, Faculty of Medicine, University of Freiburg, Freiburg, Germany, 2Dept. of Anesthesiology and Critical Care, Medical Center University of Freiburg, Faculty of Medicine, University of Freiburg, Freiburg, Germany
Synopsis
Direct quantification of cerebral metabolic rate of oxygen consumption (CMRO2) is possible with dynamic 17O-MRI after inhalation of isotope-enriched 17O2. In this work, we investigated oxygen metabolism in posterior fossa tissue including cerebellum, pons and midbrain. The determined CMRO2 values in these areas were in good agreement with literature values obtained by 15O-PET studies. Our results demonstrate that dynamic 17O-MRI may provide a valuable tool for direct measurement of CMRO2 in posterior fossa tissue.
Introduction
Cerebral metabolic rate of oxygen consumption (CMRO2) is a key indicator of normal brain function1. Non-invasive measured CMRO2 could provide vital information for the clinical assessment of diseases such as brain tumors and age-related pathologies2,3. Direct CMRO2 quantification is possible with dynamic 17O-MRI after inhalation of isotope-enriched 17O2. In our previous work, we measured CMRO2 with 17O-MRI in global brain regions such as cortical grey matter, white matter and subcortical grey matter 4-7. In this work, regional CMRO2 values in posterior fossa area including cerebellum, pons and midbrain were investigated and the quantified results were compared with literature values form 15O-PET8,9.Methods
In vivo 17O-MRI inhalation experiment was performed at a clinical 3 Tesla whole body MRI system (Prisma Fit; Siemens, Erlangen, Germany) using a custom-built circularly-polarized Tx/Rx 17O RF coil (f = 16.7 MHz). During the 17O inhalation experiment, 70%-enriched 17O gas (NUKEM Isotopes Imaging, Alzenau, Germany) was administered to a healthy volunteer (male, age: 32y) in pulses of 50 mL via a demand oxygen delivery system (DODS) (Oxytron3; Weinmann, Hamburg, Germany) to efficiently deliver the rare and costly 17O2 gas to the lung's alveoli. Additionally, a home-built MR-compatible breathing circuit was used to switch between the different phases of the inhalation experiment (baseline phase: room air; inhalation and rebreathing phase: 17O2; washout phase: room air). Dynamic 17O datasets were continuously acquired before (baseline, 10 min), during (17O gas inhalation, 4 min; rebreathing, 4 min) and after (wash-out, 22 min) inhalation of 2.5 L 70%-enriched 17O gas.3D ultra-short echo-time (UTE) sequence with Golden-angle acquisition pattern was used for 17O imaging with the following sequence parameters: TR = 9.5ms, TE = 0.51ms, BW = 360 Hz/px, number of spokes = 255k, nominal resolution = 8 mm, acquisition time TA = 40 min. The acquired dynamic data were reconstructed with conventional sliding window and Kaiser-Bessel regridding providing dynamic data at a temporal resolution of 1 min. Due to signal drift at the beginning, the first four datasets were removed from the analysis. For 17O image co-registration, high spatial resolution anatomical images were acquired by using a standard 1H T1-weighted Magnetization Prepared Rapid Acquisition Gradient Echo (MPRAGE) sequence (resolution: 0.9x0.9x1mm3, TI = 900ms) and a 20 channel head coil array.
During image co-registration, a transformation matrix was obtained by registering the averaged 17O images to the MPRAGE images using the FLIRT algorithm of FSL (FMRIB Software Library). The 3D binary masks of regions of interest (ROIs) including the left and right cerebellums, pons as well as midbrain were created manually from the T1-weighted anatomical images. Then, the masks were transformed into 17O image space and co-registered with the 17O images using FLIRT algorithm and the transformation matrix. Finally, dynamic 17O data were extracted from these regions and the corresponding CMRO2 values were quantified by signal fitting.
Results
Figure 1 shows the co-registered masks of the ROIs from posterior fossa area superimposed on the T1-weighted anatomical images (Fig1.a) and averaged 17O MR images (Fig1.b). Time-resolved H217O concentration (CH217O) in the ROIs are presented in Figure 2. The CMRO2 values in these regions are summarized in Table 1 together with literature values from PET studies8,9. Globally, CMRO2 of 1.57±0.08 μmol/g/min was determined in the whole cerebellum. In the left and right cerebellar hemispheres, the quantified CMRO2 values were 1.65±0.12 μmol/g/min and 1.46±0.07 μmol/g/min, respectively. For pons, a CMRO2 value of 1.38±0.11 μmol/g/min was found, and in the midbrain, CMRO2 of 1.34±0.09 μmol/g/min was determined.Discussion and Conclusion
Brain tumors in the posterior fossa tissue are common especially in children10. Abnormal changes of CMRO2 can provide vital metabolic information for clinical assessment of the tumor evolution/grade. Our results demonstrate the feasibility of measuring CMRO2 in the posterior fossa area non-invasively using dynamic 17O-MRI at 3T. First, CMRO2 in the global cerebellum was determined. Then, CMRO2 in the left and right cerebellar hemispheres was investigated separately. The measured results in these areas were in good agreement with literature values from 15O-PET8,9, whereas CMRO2 in pons and midbrain were up to 30-40% higher than the 15O-PET results most likely due to the influences of noise and partial volume effects, which can be improved by using RF coils with higher sensitivity and using parallel imaging, i.e., 17O coil arrays. In conclusion, dynamic 17O-MRI may provide a valuable tool for direct measurement of CMRO2 in posterior fossa tissue.Acknowledgements
Financial support from NUKEM Isotopes is gratefully acknowledged.
References
1. Derek W B, Jennifer H, Ting-Yim L, et al. Near-infrared spectroscopy measurement of oxygen extraction fraction and cerebral metabolic rate of oxygen in newborn piglets. Pediatr Res, 2003, 54 (6):861-7.
2. Stefan H, Alexander R, Armin N, et al. Direct (17)O MRI with partial volume correction: first experiences in a glioblastoma patient. Magma, 2014, 27(6):579-87.
3. Aanerud J, Borghammer P, Chakravarty MM, et al. Brain energy metabolism and blood flow differences in healthy aging. J Cereb Blood Flow Metab, 2012, 32 (7): 1177-1187.
4. Borowiak R, Groebner J, Haas M, et al. Direct cerebral and cardiac 17O-MRI at 3 Tesla: initial results at natural abundance. Magma, 2014, 27 (1): 95-99.
5. Kurzhunov D, Borowiak R, Hass H, et al. Quantification of oxygen metabolic rates in Human brain with dynamic (17) O MRI: Profile likelihood analysis. Magn Reson Med, 2017, 78 (3): 1157-1167.
6. Kurzhunov D, Borowiak R, Reisert M, et al. Direct estimation of 17 O MR images (DIESIS) for quantification of oxygen metabolism in the human brain with partial volume correction. Magn Reson Med, 2018, 80 (6): 2717-2725.
7. Kurzhunov D, Borowiak R, Reisert M, et al. 3D CMRO2 mapping in human brain with direct 17O MRI: Comparison of conventional and proton-constrained reconstructions. Neuroimage, 2017, 155:612-624.
8. Jun H, Hideaki F, Iwao K, et al. Regional cerebral blood flow, blood volume, oxygen extraction fraction, and oxygen utilization rate in normal volunteers measured by the autoradiographic technique and the single breath inhalation method. Ann Nucl Med. 1995, 9(1):15-21.
9. Tatsuo Y, Kanno I, Uemura K, et al. Reduction in regional cerebral metabolic rate of oxygen during human aging. Stroke 1986, 17(6):1220-8.
10. Andrea P, Avner M, Thierry H, et al. Neuroimaging of pediatric posterior fossa tumors including review of the literature. J Magn Reson Imaging 2012, 35(1):32-47.
Figures
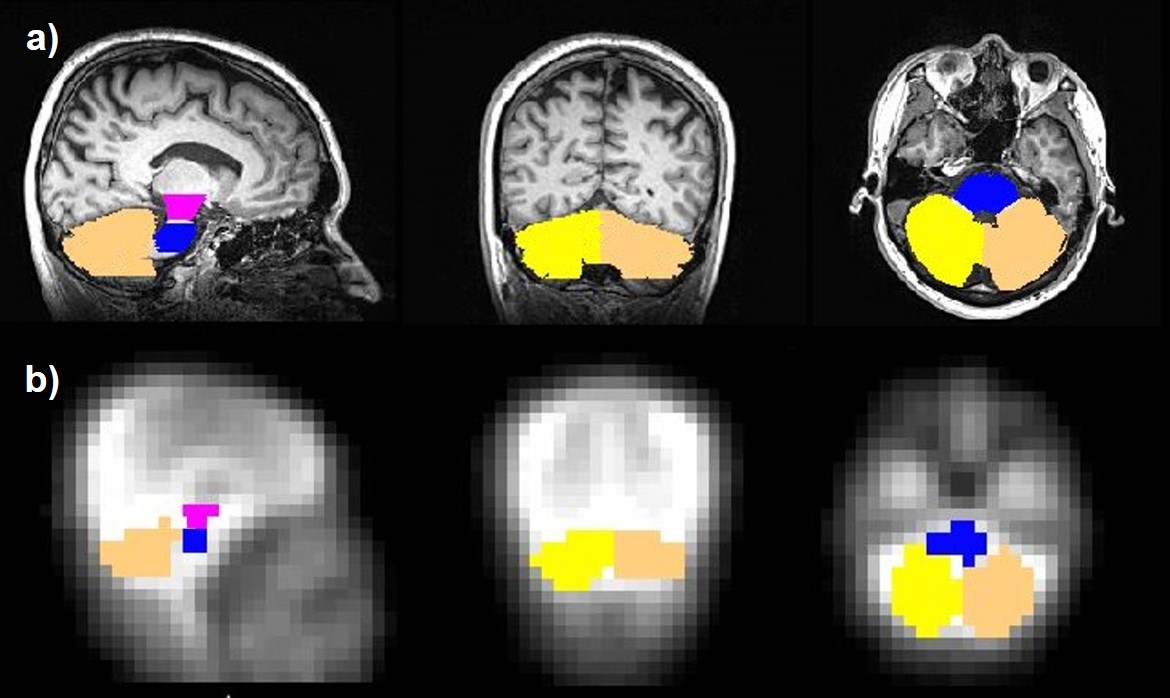
Figure 1. Co-registered masks of ROIs including the left and right cerebellums, pons and midbrain superimposed on the T1-weighted anatomical images (a) and the averaged 17O MR images (b).
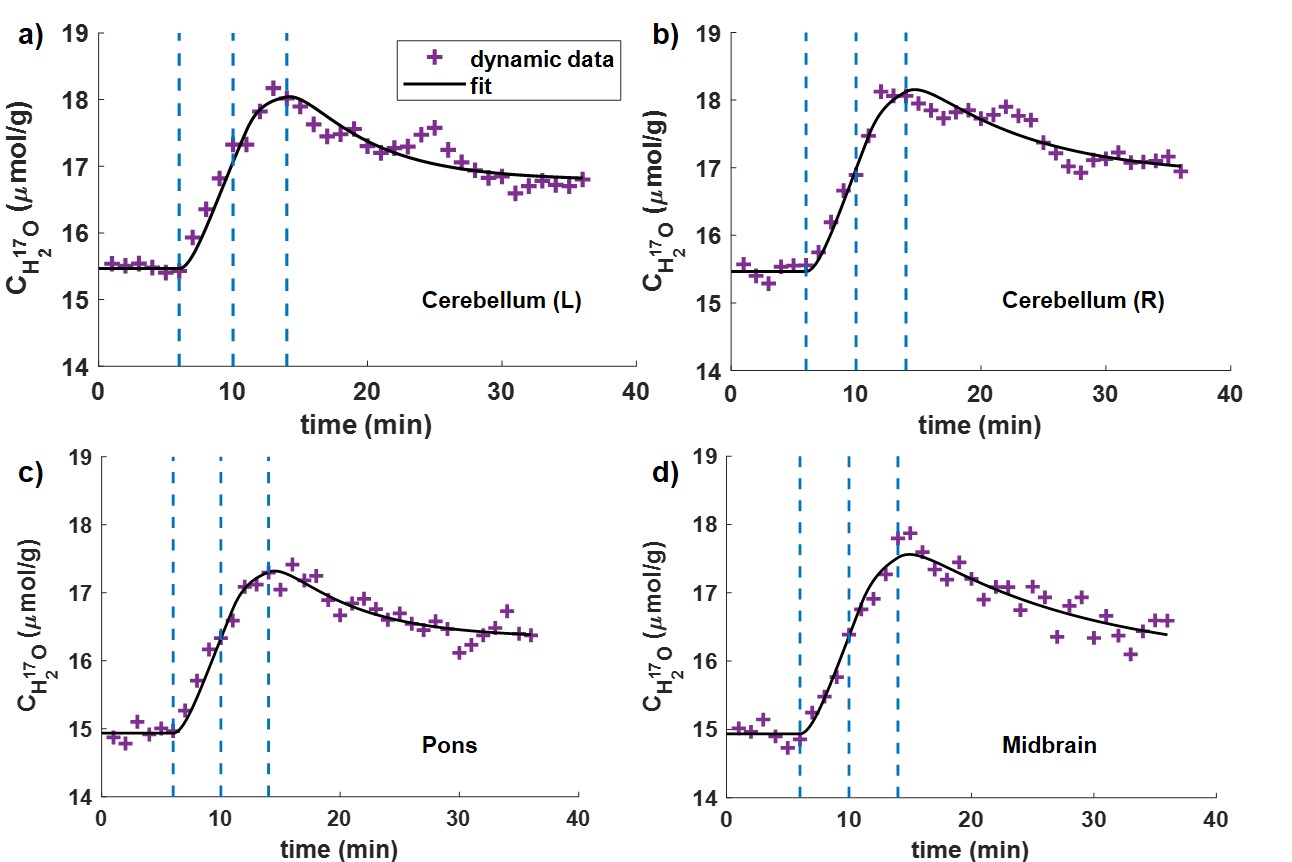
Figure 2. Dynamic H217O concentration (CH217O) changes over time in left cerebellum (a); right cerebellum (b); pons (c); midbrain (d). Dashed lines in blue color indicate the 17O2 inhalation and rebreathing phases.
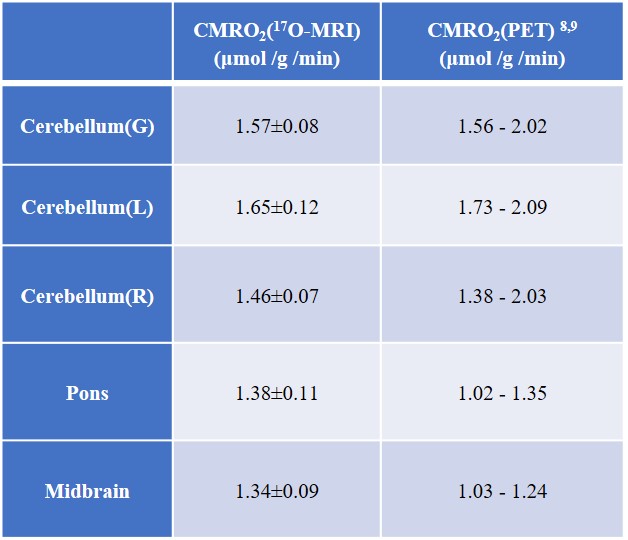
Table 1: Comparison of CMRO2 values (in µmol/g /min) determined in all ROIs by using dynamic 17O-MRI to the literature values obtained using 15O-PET for healthy subjects.