3838
Amide proton transfer weighted MRI in differentiating fat-poor angiomyolipoma from clearcell renal cell carcinoma1Clinical Medical School of Yangzhou University, Northern Jiangsu People’s Hospital, Yangzhou, China, 2GE Healthcare, MR Research, Beijing, China
Synopsis
This study aimed to explore the feasibility of amide proton transfer weighted (APTw) imaging in discriminating fat-poor angiomyolipoma (AML) from clear cell renal cell carcinoma (ccRCC). 19 ccRCC patients and 9 fat-poor AML patients were recruited for APTw imaging. ccRCC group showed significantly higher MTRasym compared to fat-poor AML group (P < 0.05). High AUC of 0.827 in ROC analysis validated the efficacy of APTw imaging in differentiating fat-poor AML from ccRCC. With these findings, APTw imaging may be considered an effective method providing added clinical value in differentiating fat-poor AML from ccRCC.
Introduction
The renal fat-poor angiomyolipoma (AML), as an uncommon variant of AML, contain little macroscopic fat, and can thus mimic clear cell renal cell carcinoma (ccRCC), leading to unnecessary surgery [1]. The capability to distinguish fat-poor AML from ccRCC is thus essential, so that the correct management of renal masses can be performed.Amide proton transfer weighted (APTw) imaging, as a branch of chemical exchange saturation transfer (CEST) focusing on the proton exchange between amide proton and bulk water [2], has been reported to robustly diagnose brain tumors, such as detecting glioma [3], grading glioma [4] and assessing tumor response to treatments [5]. With these promsing results, we assumed that APTw imaging might also have potential in the differential diagnosis between fat-poor AML and ccRCC. However, to our best knowledge, few study has explored this.
Therefore, the main goal of this study was to investigate the feasibility of APTw imaging in differentiating fat-poor AML from ccRCC.
Materials and Methods
SubjectsInstitutional Review Board (IRB) was approved for this study. In this retrospective study, 19 ccRCC patients(mean age, 49.36±18.71 years) and 9 fat-poor AML patients (mean age, 57.21±13.43 years) were recruited for renal MR imaging before surgery after signing written informed consent form in our hospital.
MRI experiments
All MR experiments were performed at 3.0T MR system (Discovery 750, GE Healthcare, USA) with an eight-channel array body coil employed. In addition to routine anatomical imaging (T2-weighted imaging), APTw imaging was also performed for each patient. Single slice spin-echo echo-planar-imaging based APTw imaging was applied on one T2WI slice that showed a single section through the largest cross-section of a solid tumor. Images at 52 frequencies were acquired, including 49 frequencies ranging from -600 to 600 Hz with an increment of 25 Hz. The applied saturation B1 power was 2µt and the saturation duration was 2000ms. TR/TE, 4000/10ms; FOV, 240mm×240mm; thickness, 5mm; matrix, 512×8; Scan time, 2min46s.
Data analysis
All APTw data were post-processed using vendor-provided software on GE ADW4.6 workstation. The corresponding APTw metric of MTRasym was obtained for each patient. Two senior radiologists were employed for data analysis. Free-hand regions of interest (ROIs) were placed at a solid area of the tumor on the largest slice with reference to T2-weighted images to exclude necrosis, cysts, hemorrhage, large vessels, edema, and calcifications, and the ROI was then copied to the corresponding APT image to obtain the MTRasym.
Statistical analyses were performed using SPSS (version23.0) and Graphpad prism. Independent sample t-test was applied to compare MTRasym between two groups. Receiver-operating characteristic analysis was performed to evaluate the efficacy of MTRasym in differentiating fat-poor AML group from ccRCC group. Significant threshold was set as p <0.05.
Results
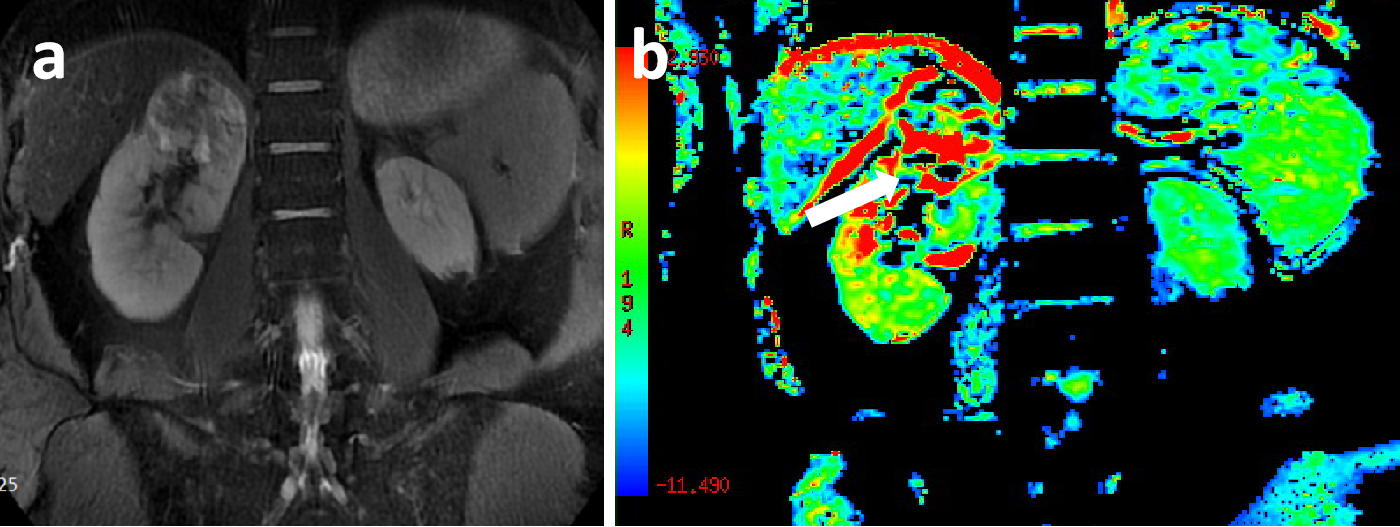
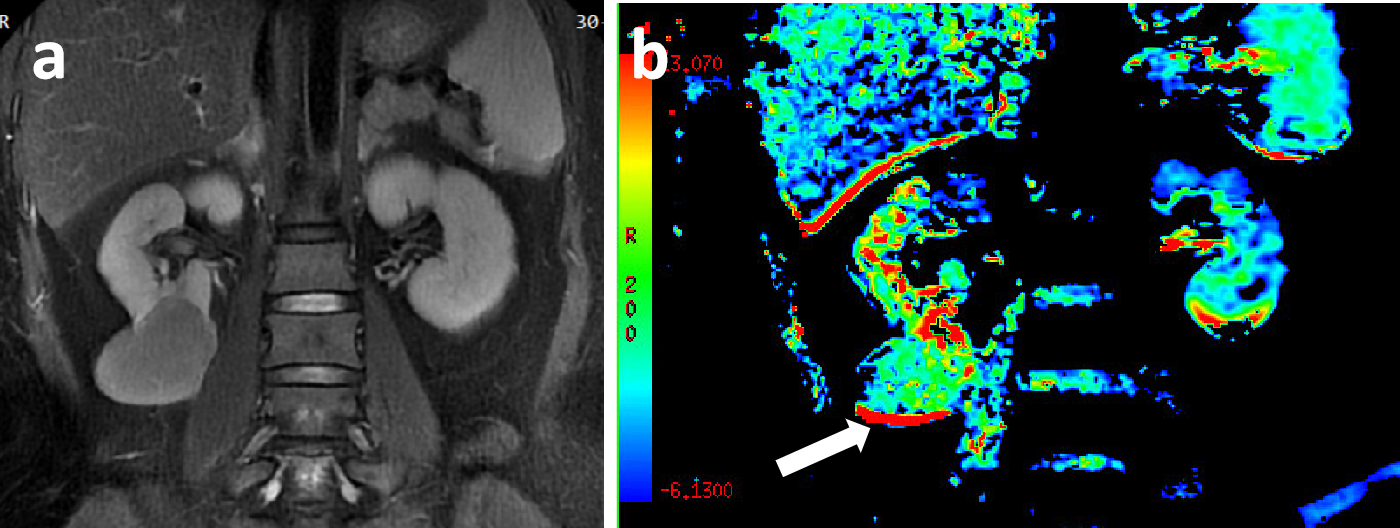
Representative ccRCC and fat-poor AML cases have been shown in Figs 1,2.Using ICC analysis, high inter-agreements of MTRasym (0.933) measurement between both radiologists were confirmed.
With Independent sample t-test, compared to ccRCC group, MTRasym showed signifificantly lower in fat-poor AML group (mean: 5.73±2.61 vs 2.76±1.64; p<0.05).
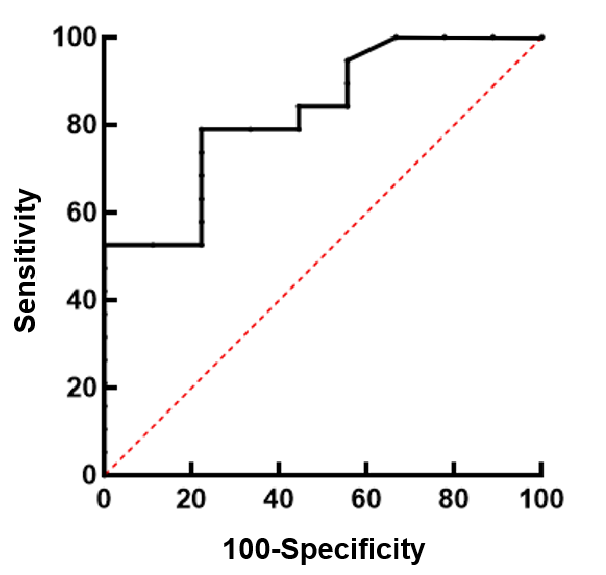
Using ROC analysis (Fig.3), MTRasym showed excellent clinical efficacy in discriminating fat-poor AML from ccRCC, confirmed by high AUC of 0.827. In addition, the sensitivity, specificity as well as the cut-off value were 78.95%, 77.78%, and 3.00, respectively.
Discussion and conclusions
In this study, we explored the feasibility of APTw imaging in discriminating fat-poor AML from ccRCC. Our results show that stronger CEST effect validated by higher MTRasym was revealed in ccRCC group relative to fat-poor AML group. This may be explained that higher amount of peptide contributes to stronger proton exchange between amide proton and bulk water in ccRCC group compared to fat-poor AML group. In addition, ROC curve analysis demonstrated that APTw imaging can effectively distinguish between ccRCC and fat-poor AML with an AUC of 0.827. This excellent discrimination ability of benign from malignant tumors was consistent with previous similar studies of the brain comparing glioblastoma with meningioma [6] and studies of the chest comparing malignant and benign thoracic lesions [7].In conclusion, APTw imaging may be considered an effective method in differentiating ccRCC from fat-poor AML.
Acknowledgements
We thank Weiqiang Dou from GE Healthcare for this valuable support on the APT sequences.
References
[1] Richard PO, Jewett MAS, Bhatt JR, et al. Renal Tumor Biopsy for Small Renal Masses: A Single-center 13-year Experience. European urology. 2015;68(6):1007-13.
[2] Zhou J, Heo HY, Knutsson L, van Zijl PCM, Jiang S. APT-weighted MRI: Techniques, current neuro applications, and challenging issues. J Magn Reson Imaging 2019;50:347-64.
[3] Zhou J, Zhu H, Lim M, Blair L, Quinones-Hinojosa A, Messina SA, Eberhart CG, Pomper MG, Laterra J, Barker PB, van Zijl PC, Blakeley JO. Three-dimensional amide proton transfer MR imaging of gliomas: Initial experience and comparison with gadolinium enhancement. J Magn Reson Imaging 2013;38:1119-28.
[4] Choi YS, Ahn SS, Lee SK, Chang JH, Kang SG, Kim SH, Zhou J. Amide proton transfer imaging to discriminate between low- and high-grade gliomas: added value to apparent diffusion coefficient and relative cerebral blood volume. Eur Radiol 2017;27:3181-9.
[5] Jiang S, Rui Q, Wang Y, Heo HY, Zou T , Yu H, Zhang Y, Wang X, Du Y, Wen X, Chen F , Wang J, Eberhart CG, Zhou J, Wen Z. Discriminating MGMT promoter methylation status in patients with glioblastoma employing amide proton transfer-weighted MRI metrics. Eur Radiol 2018;28:2115-23.
[6] T ogao O, Hiwatashi A, Keupp J, et al. Scan-rescan reproducibility of parallel transmission based amide proton transfer imaging of brain tumors. J Magn Reson Imaging 2015;42(5):1346–1353.
[7] Ohno Yoshiharu,Yui Masao,Koyama Hisanobu et al. Chemical Exchange Saturation Transfer MR Imaging: Preliminary Results for Differentiation of Malignant and Benign Thoracic Lesions. Radiology, 2016, 279: 578-89.
Figures