3836
Dynamic glucose enhanced MRI detects glucose-related responses in mouse brain under normoxia and hyperoxia1Department of Biomedical Engineering, City University of Hong Kong, Hong Kong, China, 2F.M. Kirby Research Center for Functional Brain Imaging, Kennedy Krieger Research Institute, Baltimore, MD, United States, 3Russell H. Morgan Department of Radiology and Radiological Science, The Johns Hopkins University School of Medicine, Baltimore, MD, United States, 4Hong Kong Centre for Cerebro-Cardiovascular Health Engineering (COCHE), Hong Kong, China
Synopsis
Dynamic glucose enhanced (DGE) MRI can detect glucose-related events in the brain, however, the influence of oxygen levels on DGE signal remains unknown. Here, we investigated the DGE signal changes under normoxia and hyperoxia on mouse brain, using on-resonance variable delay multi-pulse (onVDMP) MRI. Significantly higher signal change under normoxia than that under hyperoxia was observed in parenchyma but not in cerebrospinal fluid (CSF). Without glucose infusion, a signal increment of about 3% was found in both parenchyma and CSF from hyperoxia to normoxia, interpreted as related to BOLD effect. These data provide insight into the origin of glucoCEST contrast.
Introduction
Inhaled oxygen (O2) has been commonly used as an MRI contrast agent for decades as it has advantages of fast clearance and few contraindications.1-3 Dynamic glucose enhanced (DGE) MRI is capable of noninvasively mapping cerebral glucose delivery and uptake using natural D-glucose as a tracer,4-21 based on the mechanism of chemical exchange saturation transfer (CEST).22-26 Recently, on-resonance variable delay multi-pulse (onVDMP)27 has been proposed to efficiently detect fast-exchanging protons including hydroxyl protons of D-glucose.5,18,28 Moreover, we proposed an length-adjustable onVDMP to detect glucose in brain parenchyma and cerebrospinal fluid (CSF) simultaneously.5,28 However, the influence of altered oxygen levels on DGE signal remains unknown currently. In this study, we investigated cerebral glucose response to normoxia (NO) and hyperoxia (HO) using onVDMP based DGE MRI at 3T.Methods
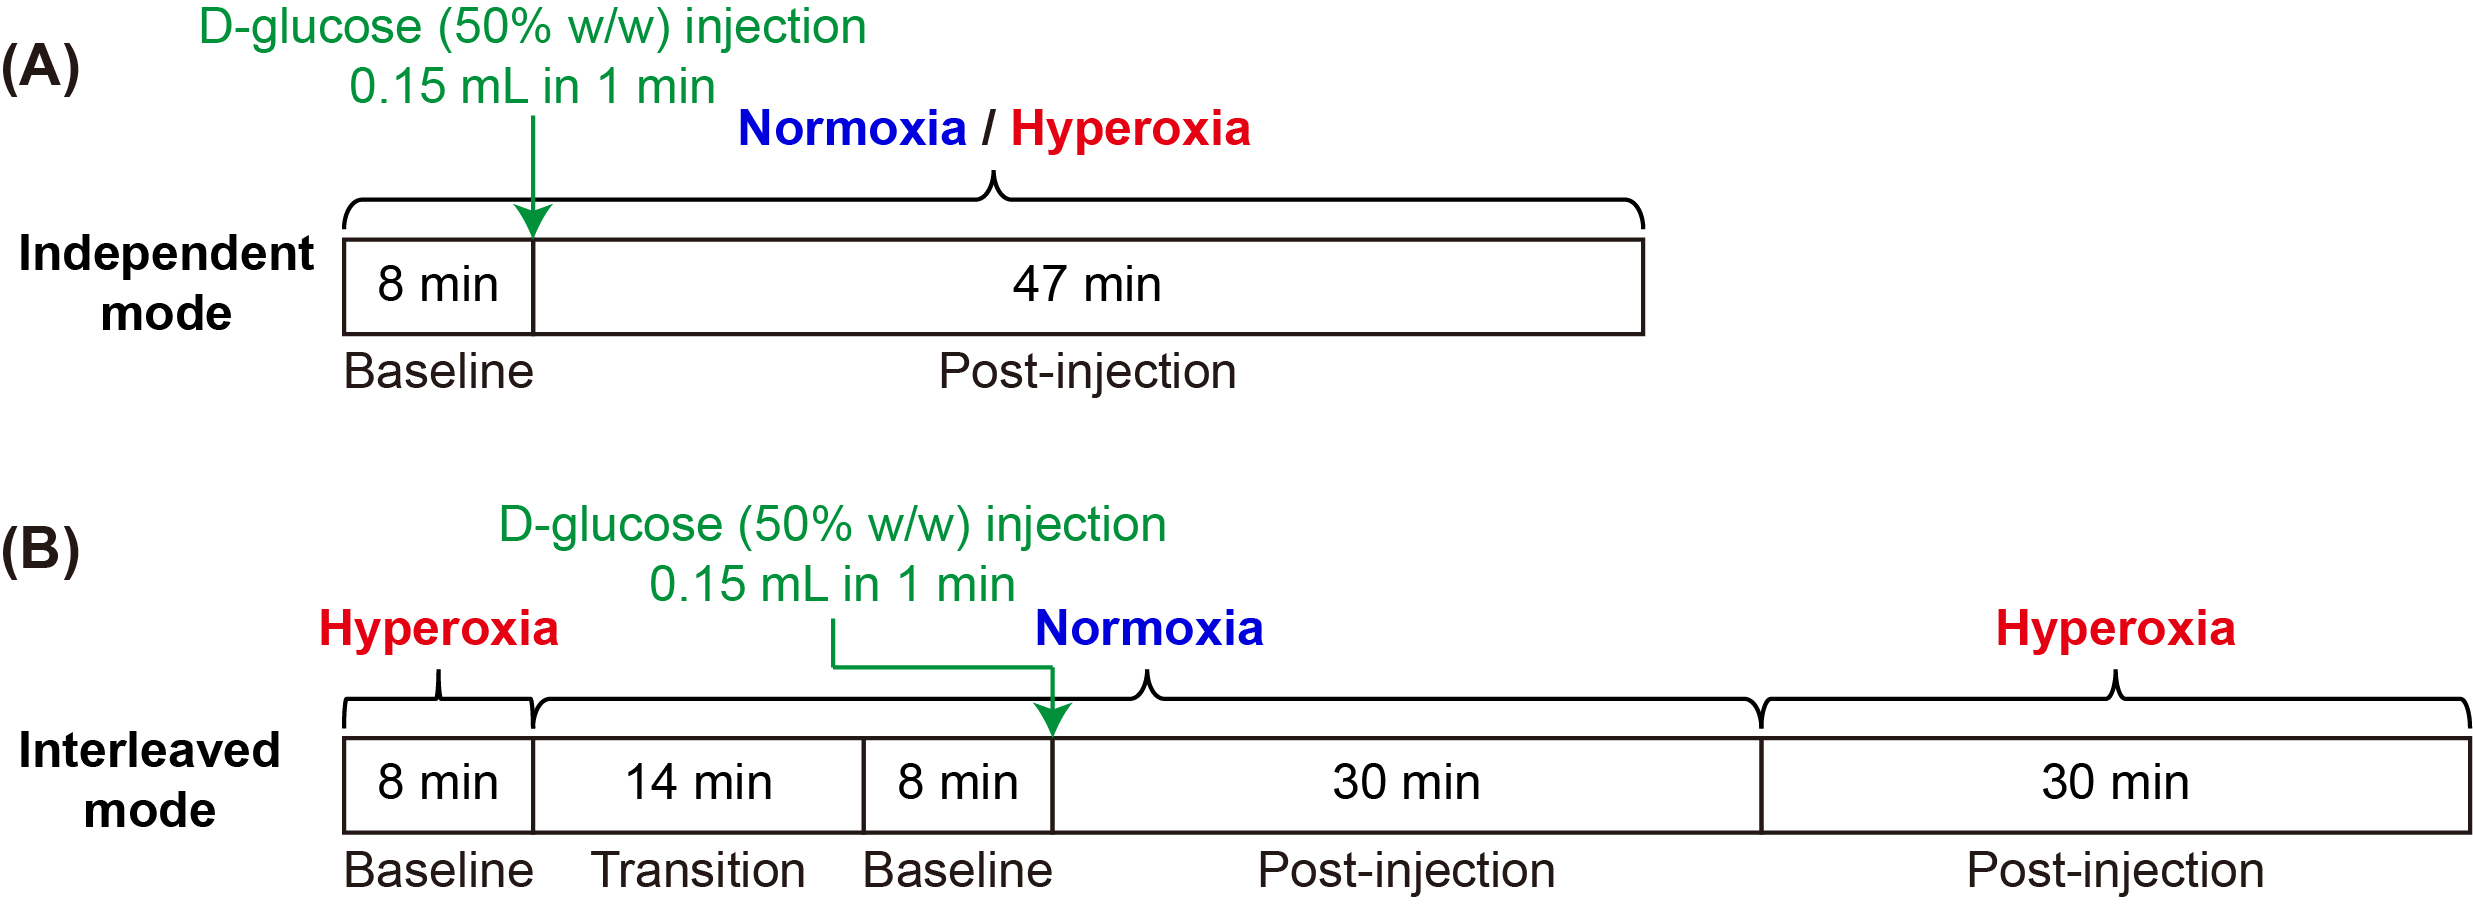
Six wild type (WT) mice (C57BL/6, female aged 2-3 months old) were used in this study. All MRI experiments were performed on a horizontal bore 3T Bruker Biospec system (Bruker, Ettlingen, Germany). To investigate the effect of normoxia (air with 21% O2) and hyperoxia (concentrated air with 93% O2) on mouse brain, DGE MRI experiments were performed in two different modes (FIGURE 1) for the same mouse: (i) Independent mode: DGE data of each mouse under normoxia or hyperoxia was acquired in two independent experiments. (ii) Interleaved mode: DGE data of each mouse was acquired by interleaving NO and HO in one experiment. The DGE MRI sequence was an onVDMP module followed by rapid acquisition with a RARE readout.4,5 The onVDMP module consisted of a train of binomial pulses (bp) with a peak power of 3.1 μT and a duration of 7.5 ms (15 ms for a bp pair). The number of bp pairs was set to 4 (60 ms) for parenchymal imaging and to 60 (900 ms) for CSF imaging.5 Other parameters were as followings: TR=2.5 s, TE=5 ms, RARE factor=32, slice thickness=2 mm, matrix size=96×96 and FOV=20×20 mm2. Thus, the time resolution of an image pair (parenchymal and CSF images) was 15 s. The total imaging time per DGE acquisition was 55 min (220 image pairs). A bolus of 0.15-ml filtered 50% w/w D-glucose was injected into mouse body through the tail vein over 1 min. The area under curve (AUC) normalized with data points was used to assess the DGE results.17,20Results and Discussion
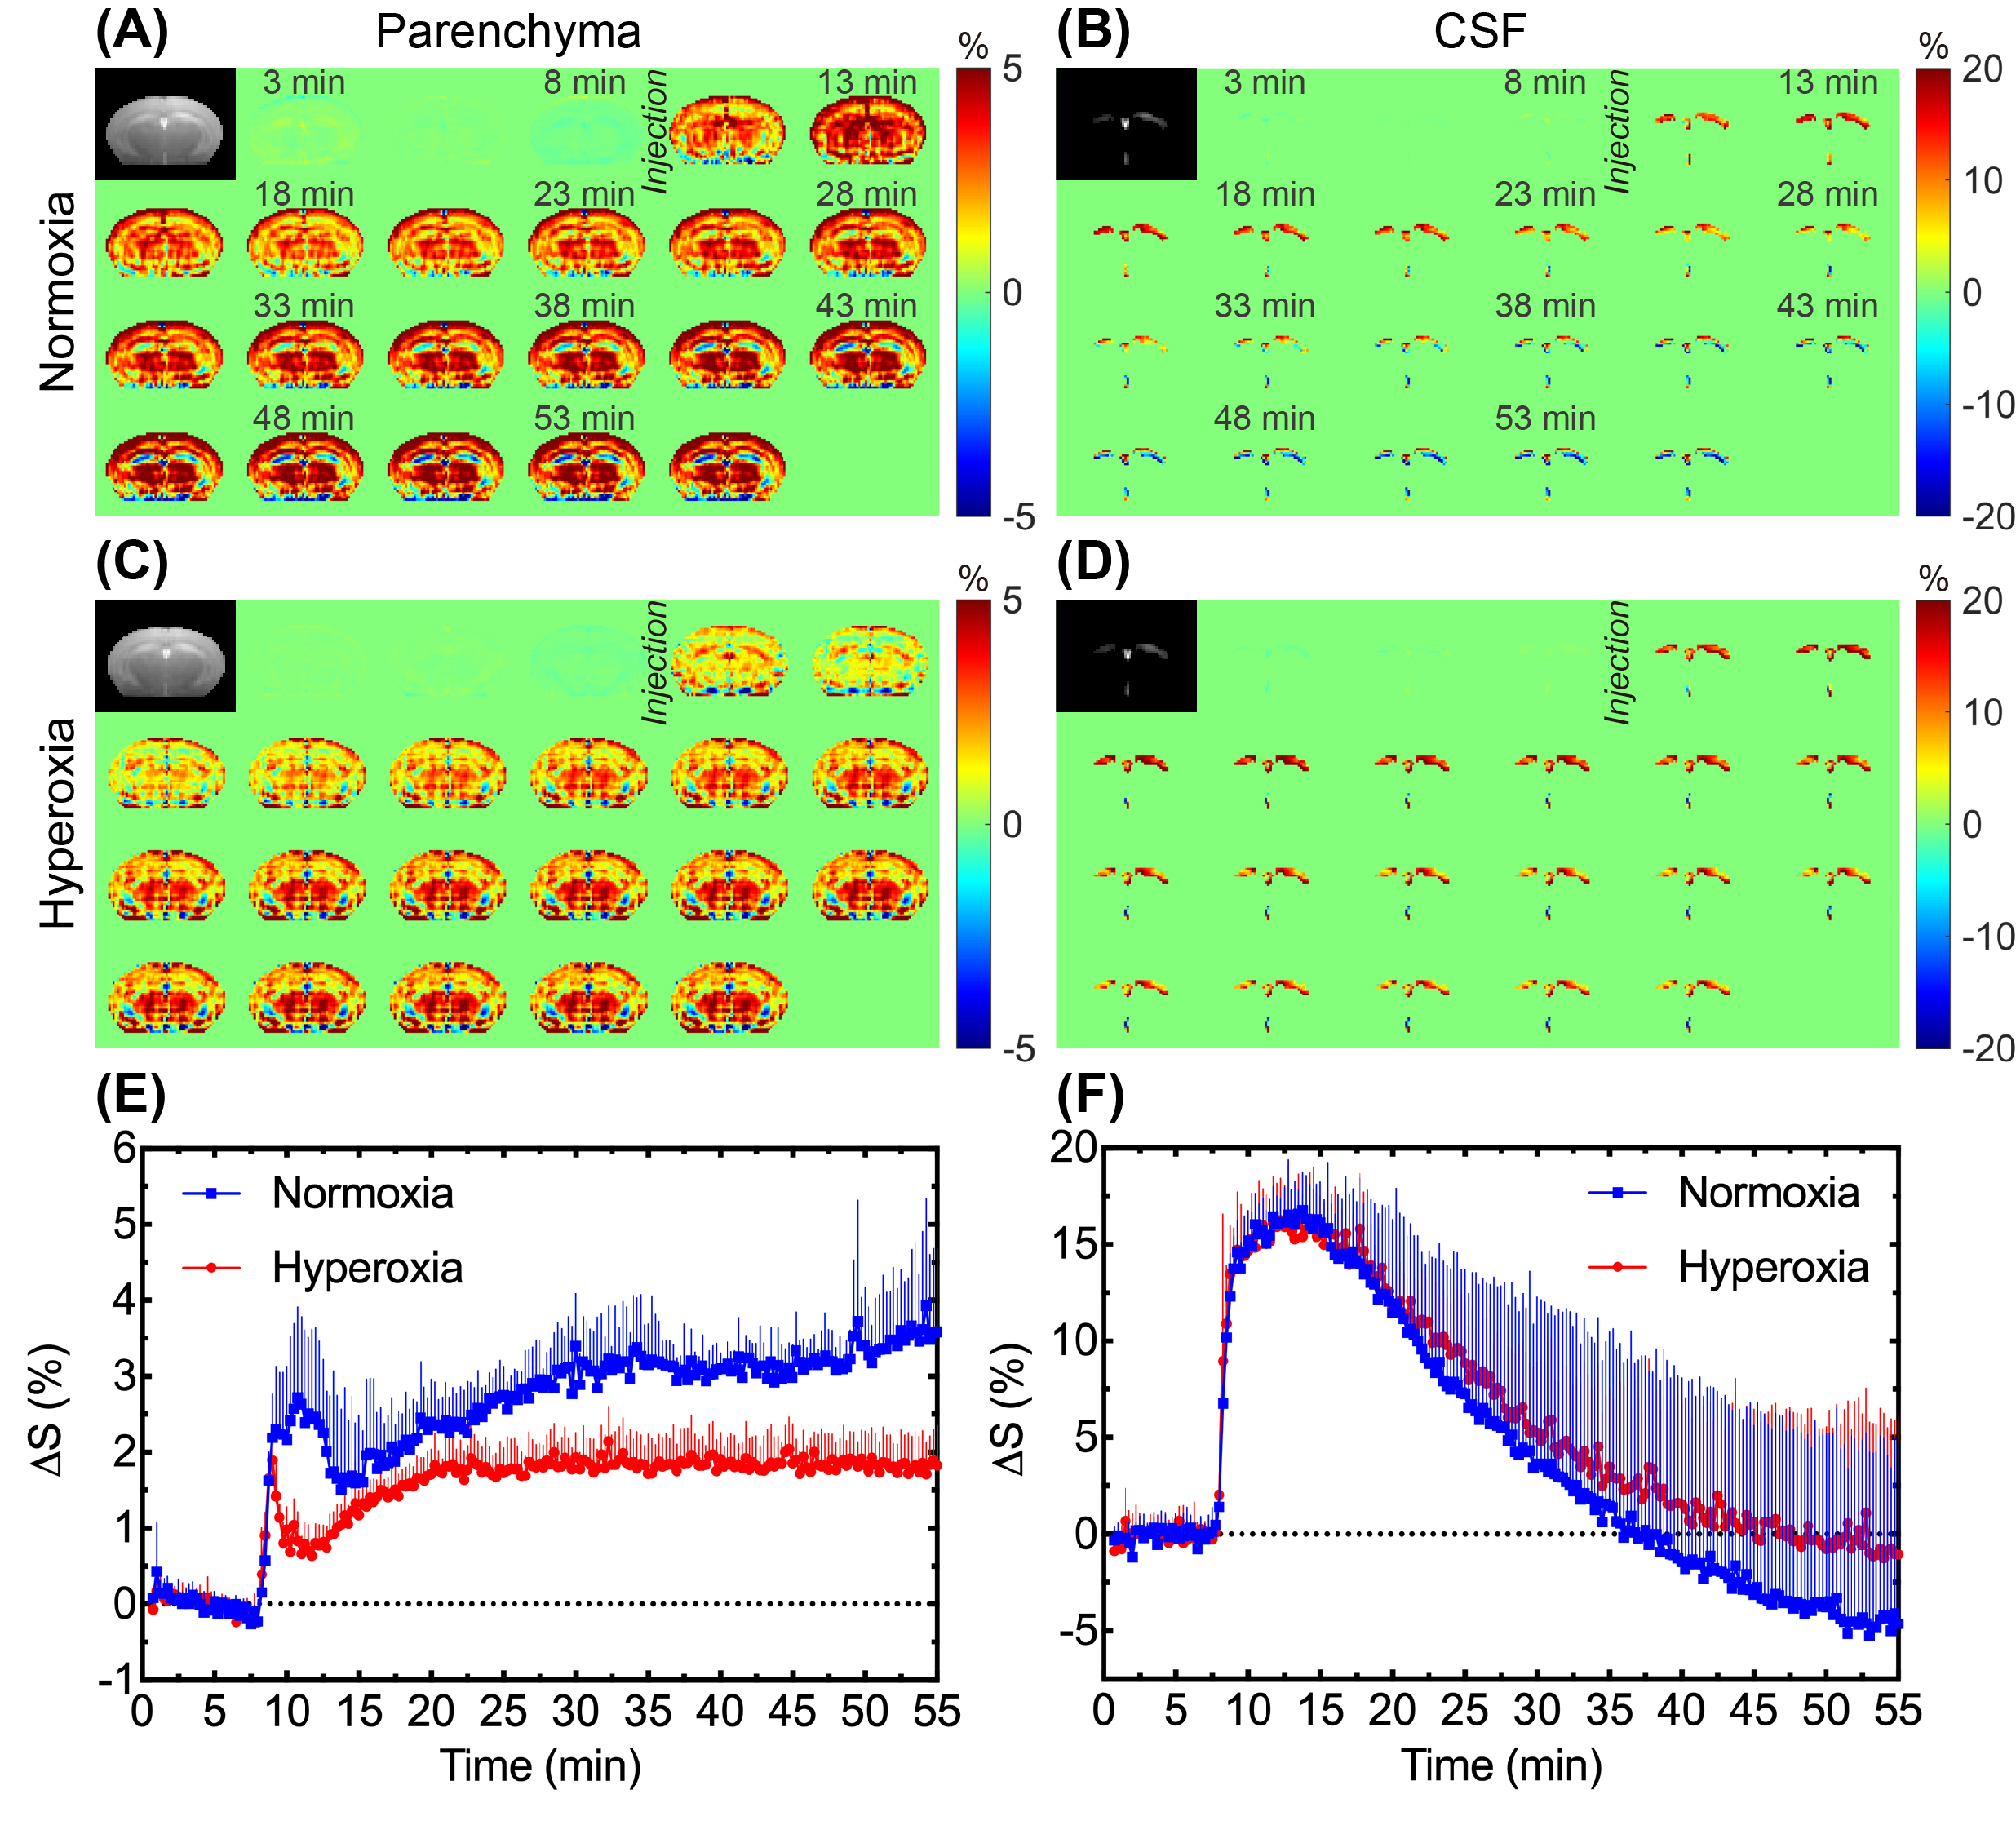
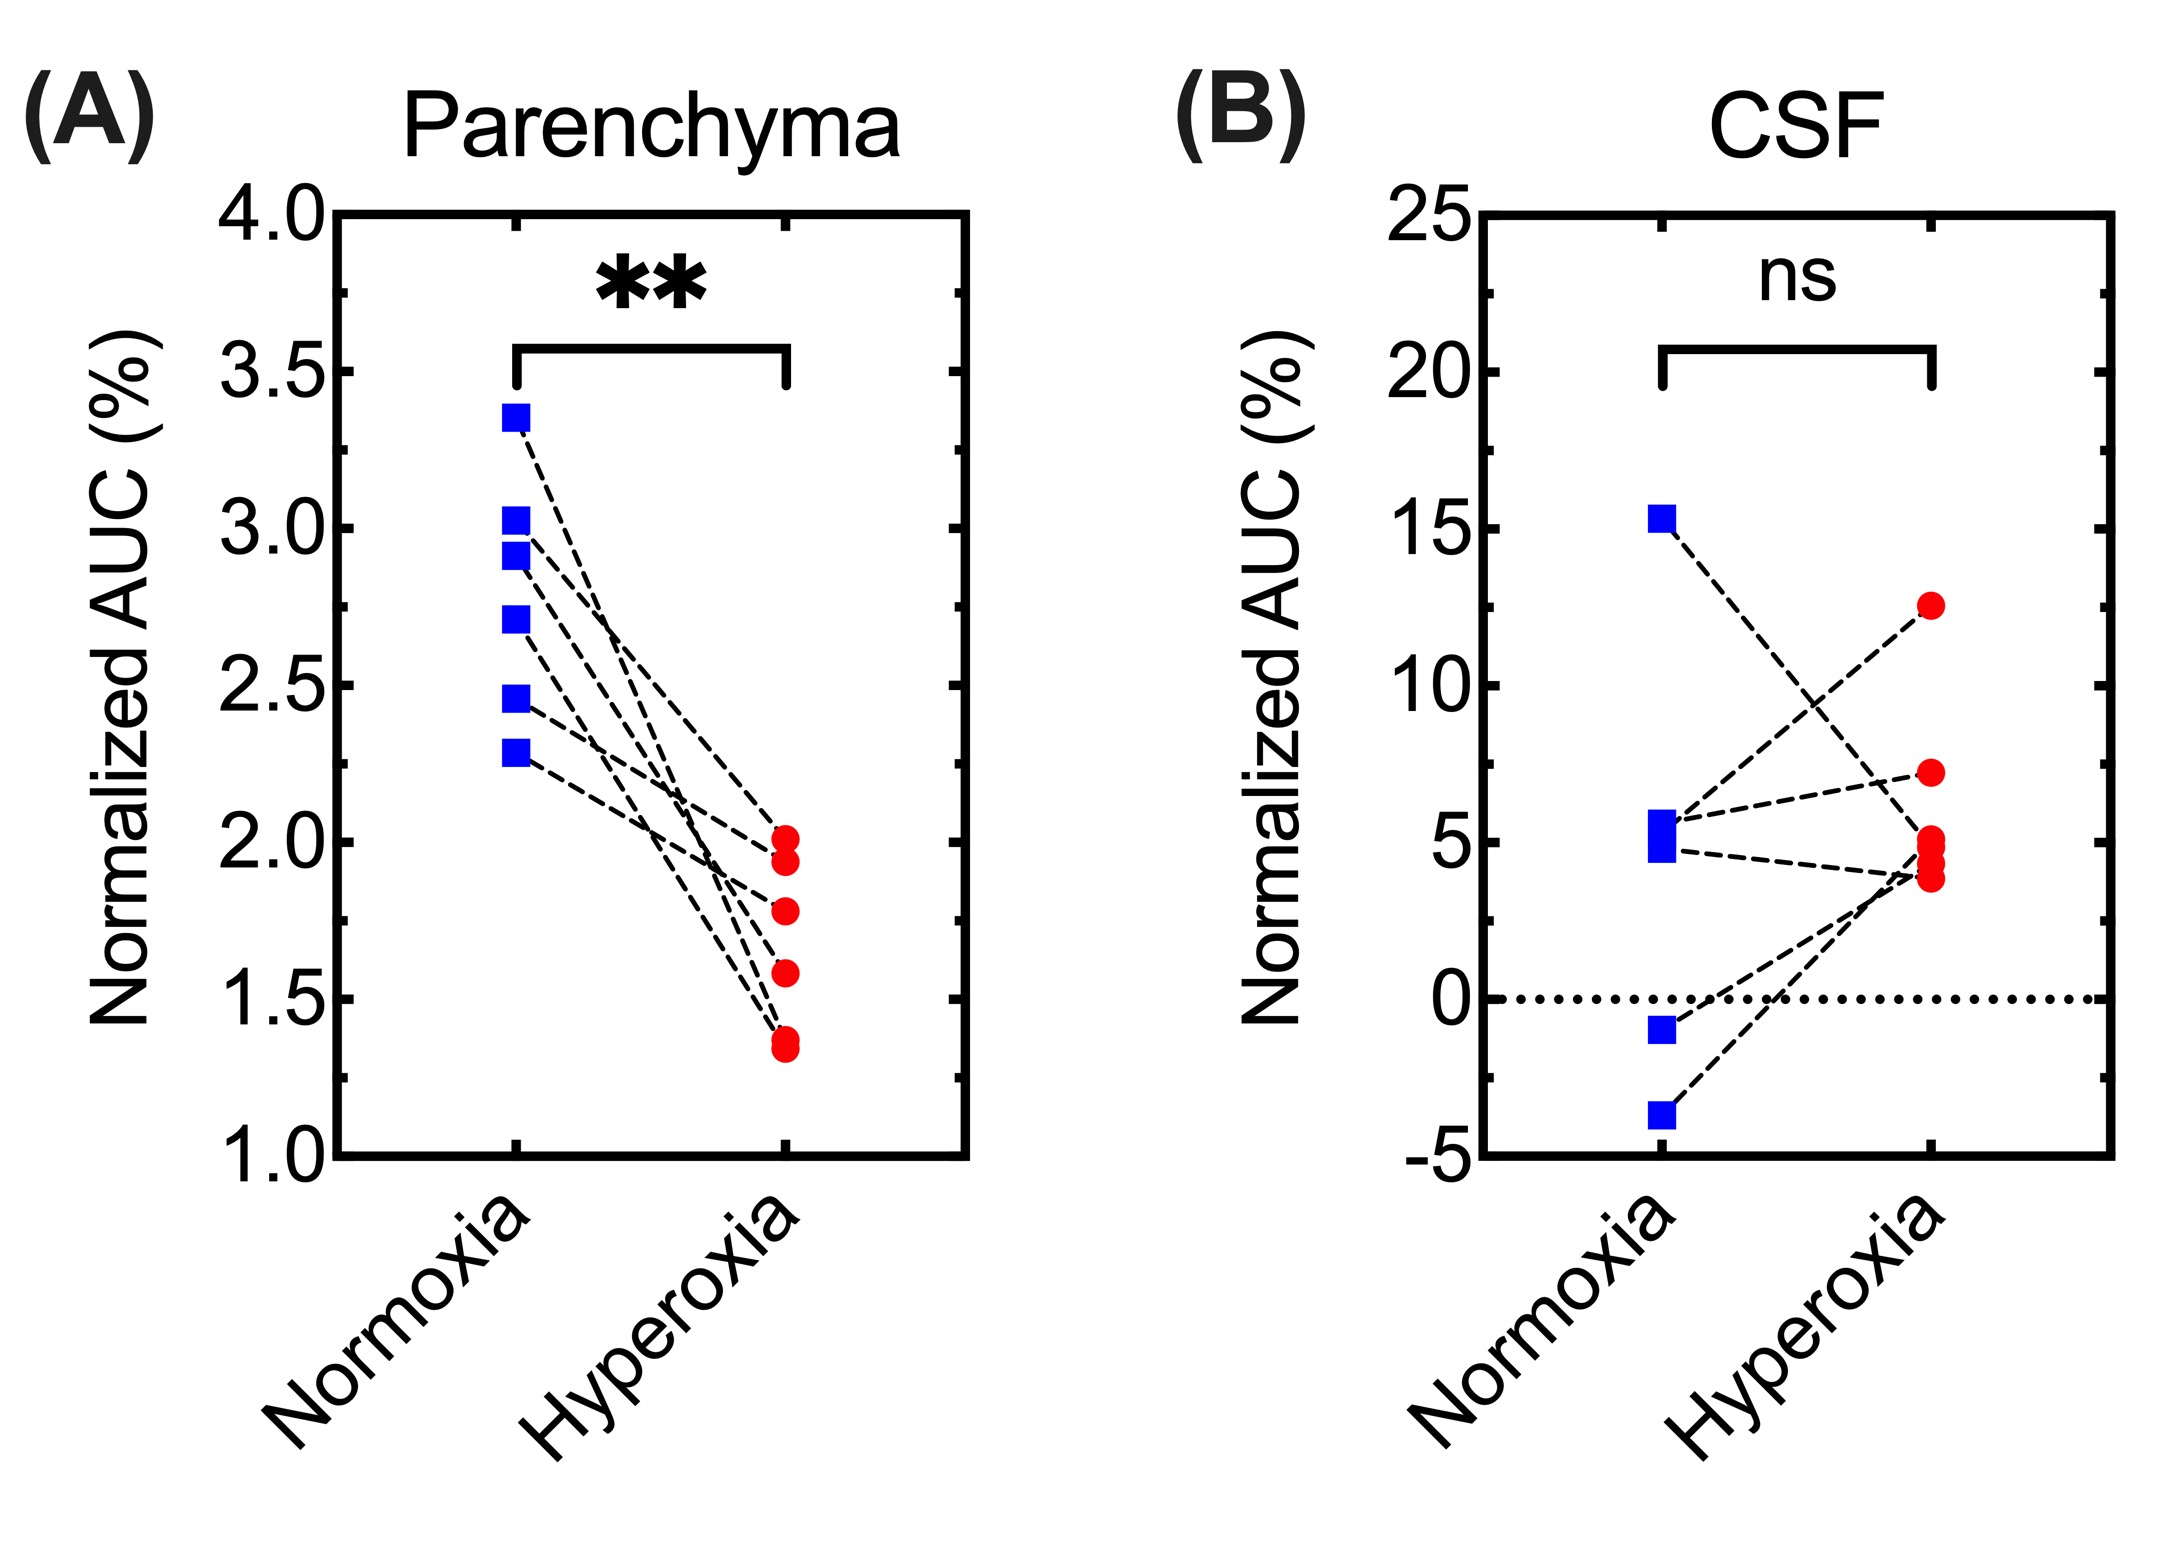
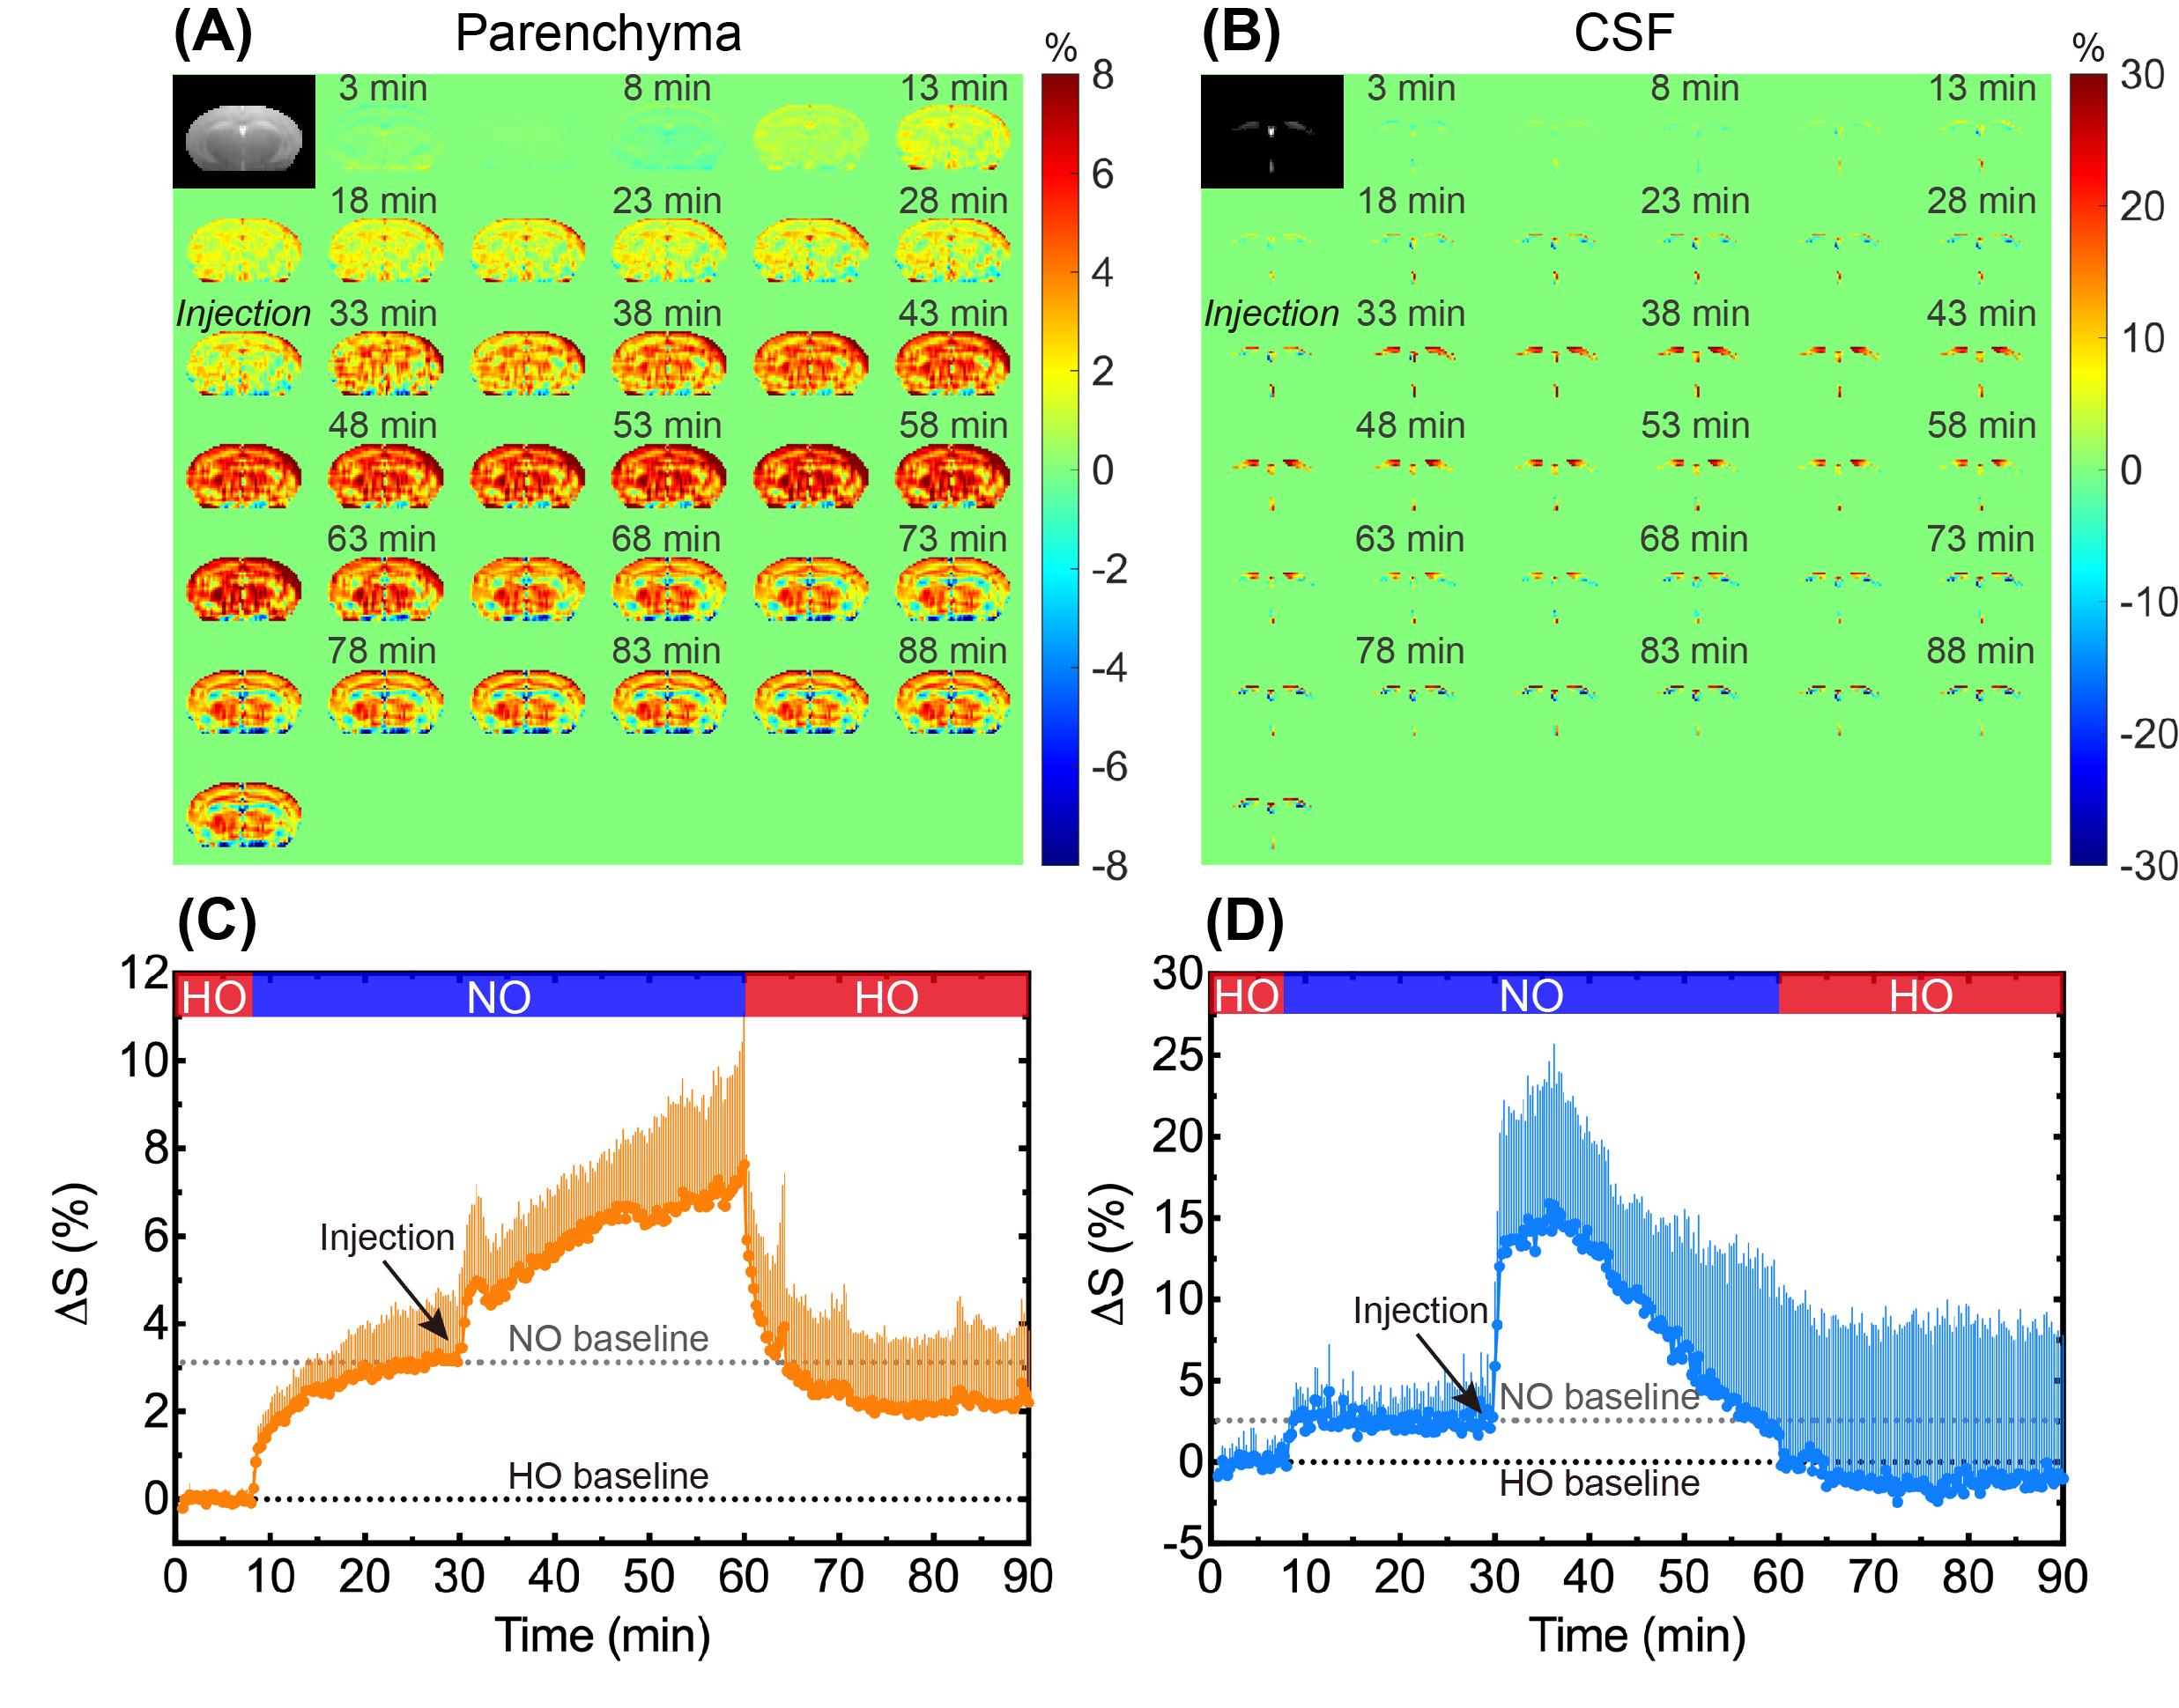
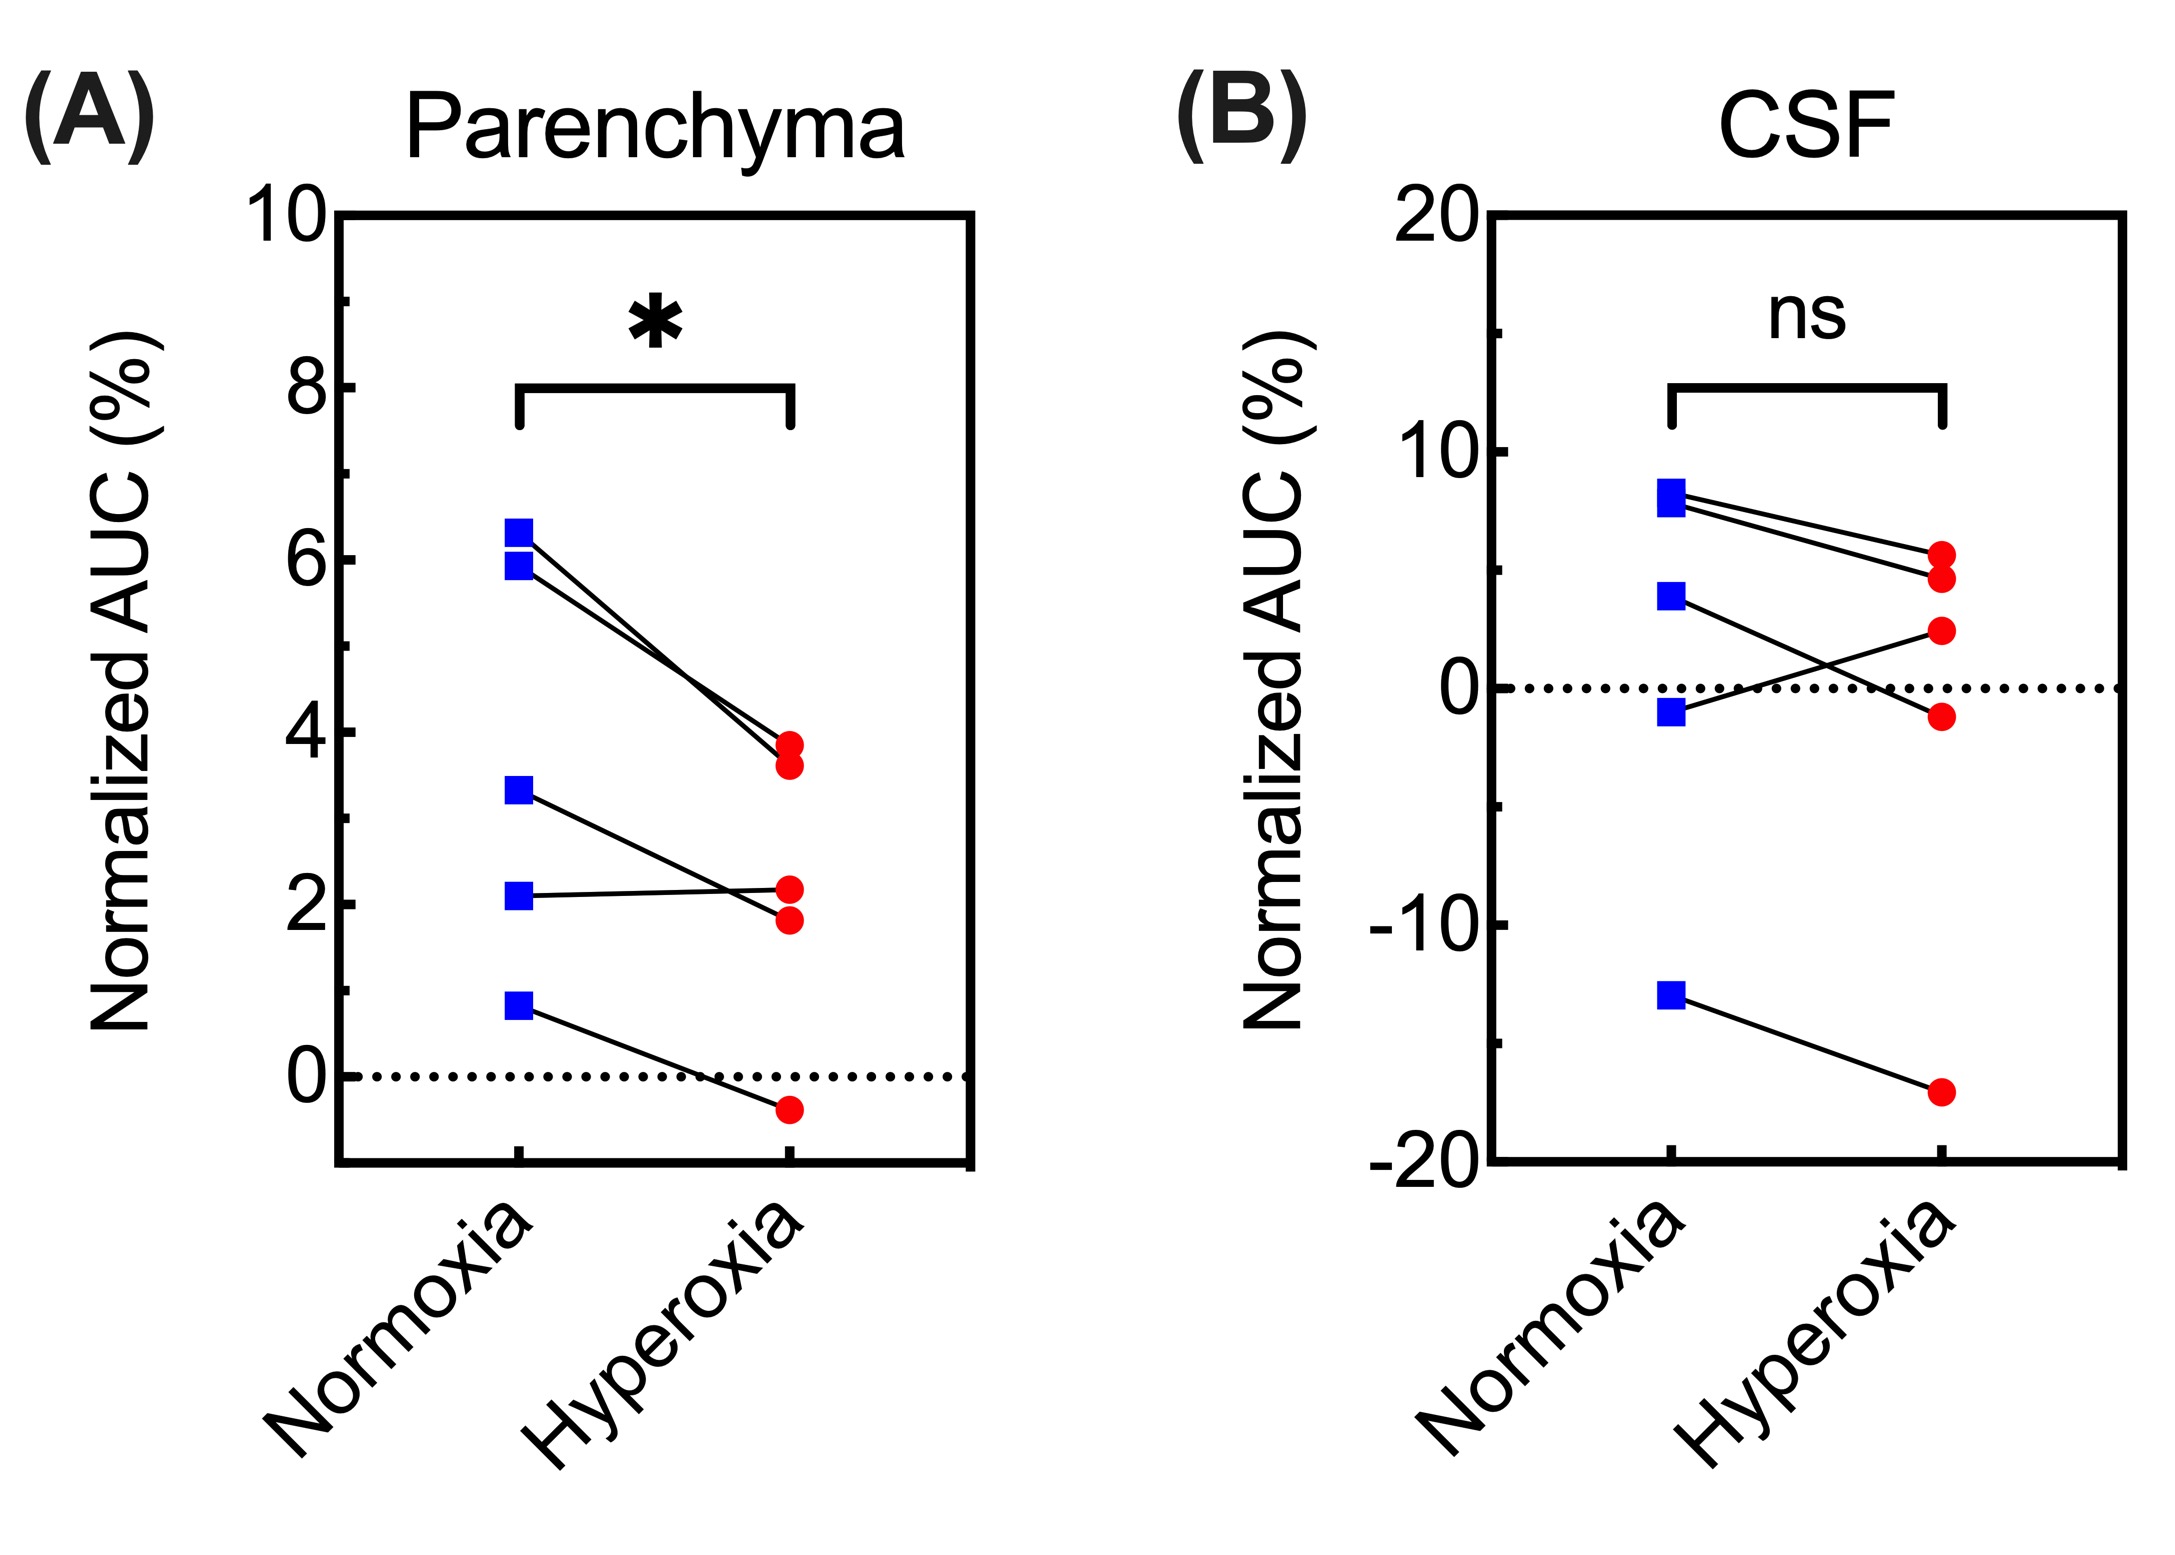
In independent experiments (Figure 1A), DGE images/curves of both parenchyma and CSF showed clear glucose response after D-glucose injection, either under normoxia or hyperoxia (Figure 2). For the parenchymal DGE results, an initially rapid enhancement (likely vascular) followed by a fast decrease and gradual elevation to steady state was observed (Figure 2A,C&E). For the CSF DGE results, the initial enhancement quickly reached a maximum and then gradually washed out (Figure 2B,D&F). The observations were consistent with a previous study.5 Notably, the averaged parenchymal DGE curve under normoxia was obviously higher than that under hyperoxia, while the averaged CSF DGE curves showed comparable amplitude and trend (Figure 2E-F) under different levels of oxygen. Normalized AUC of normoxia was significantly larger than that of hyperoxia in parenchyma (2.79±0.39% versus 1.67±0.28%, P=0.005), as shown in Figure 3. We speculated that this difference could be related to the vasoconstriction caused by the hyperoxia, as the percentage change ([2.79-1.67]/2.79*100%=40%) was comparable to previously reported percentage change (33%, from 53.6 ml·100g-1·min-1 to 36.1 ml·100g-1·min-1) of global cerebral blood flow (CBF) from normoxia (21% O2) to hyperoxia (100% O2).28 However, no substantial difference was observed in CSF under normoxia and hyperoxia (4.41±6.58% versus 6.33±3.26%, P=0.534). This could be due to the higher accessibility of CSF to blood than parenchyma to blood. To investigate the influences of baseline and experimental error, interleaved experiments were performed (Figure 1B). Interestingly, there was an obvious increment of 3.1±0.1% in parenchyma and 2.6±0.8% in CSF after switching the hyperoxia baseline to normoxia (Figure 4C,D). We conclude that this difference observed under two gas conditions is due to the blood oxygenation level dependent (BOLD) effect.29 At 30 min after glucose injection during normoxia, the setup was shifted back to HO and the NO/HO signals were compared to their respective baselines. The DGE images/curves under normoxia showed higher signal than that under hyperoxia, while no difference was found in CSF (Figure 4). These were consistent with the results of independent experiments. From Figure 5, significant difference of normalized AUC at last 10-min duration between normoxia and hyperoxia was found in parenchyma (3.70±2.39% versus 2.22±1.70%, P=0.033), but not in CSF (1.22±8.76% versus -1.09±9.29%, P=0.197).Conclusion
DGE MRI have been proposed and developed in the past decade, but the influence of altered oxygen levels on DGE signal remains unknown. Here we performed DGE experiments under normoxia and hyperoxia on the same mouse, in both independent and interleaved experiments. Significantly higher signal change under normoxia than under hyperoxia was observed in parenchyma but not in CSF. An signal increment of about 3% was found when switching to normoxia from hyperoxia without glucose injection, most likely due to the BOLD effect under two oxygenations. We suggested that the inhaled oxygen level is a factor that needs consideration when performing DGE MRI in research studies or clinical applications.Acknowledgements
This work was supported by Research Grants Council: 11102218, PDFS2122-1S01; City University of Hong Kong: 7005210, 7005433, 9680247, 9667198 and 9609307; National Natural Science Foundation of China: 81871409. Jianpan Huang and Zilin Chen contributed equally to this work.References
1. Wise RG, Harris AD, Stone AJ, Murphy K. Measurement of OEF and absolute CMRO2: MRI-based methods using interleaved and combined hypercapnia and hyperoxia. Neuroimage 2013;83:135-147.
2. Bulte DP, Chiarelli PA, Wise RG, Jezzard P. Cerebral perfusion response to hyperoxia. J Cereb Blood Flow Metab 2007;27(1):69-75.
3. Rostrup E, Larsson H, Toft P, Garde K, Henriksen O. Signal changes in gradient echo images of human brain induced by hypo‐and hyperoxia. NMR Biomed 1995;8(1):41-47.
4. Chen L, Wei Z, Chan KW, Li Y, Suchal K, Bi S, Huang J, Xu X, Wong PC, Lu H. D-Glucose uptake and clearance in the tauopathy Alzheimer’s disease mouse brain detected by on-resonance variable delay multiple pulse MRI. J Cereb Blood Flow Metab 2021;41(5):1013-1025.
5. Huang J, van Zijl PC, Han X, Dong CM, Cheng GW, Tse K-H, Knutsson L, Chen L, Lai JH, Wu EX, Xu J, Chan KW. Altered D-glucose in brain parenchyma and cerebrospinal fluid of early Alzheimer’s disease detected by dynamic glucose-enhanced MRI. Sci Adv 2020;6:eaba3884.
6. Huang J, Xu J, Dong CM, Chen L, Han X, Wu EX, Van Zijl P, Chan KW. Impaired glucose uptake in mouse brain with Alzheimer's disease detected by dynamic glucose enhanced (DGE) MRI at 3T. Alzheimer's Association International Conference 2019;15(7S):747.
7. Jin T, Mehrens H, Wang P, Kim S-G. Chemical exchange-sensitive spin-lock MRI of glucose analog 3-O-methyl-d-glucose in normal and ischemic brain. J Cereb Blood Flow Metab 2018;38(5):869-880.
8. Kentrup D, Bovenkamp P, Busch A, Schuette-Nuetgen K, Pawelski H, Pavenstädt H, Schlatter E, Herrmann K-H, Reichenbach JR, Löffler B. GlucoCEST magnetic resonance imaging in vivo may be diagnostic of acute renal allograft rejection. Kidney Int 2017;92(3):757-764.
9. Knutsson L, Seidemo A, Scherman AR, Bloch KM, Kalyani RR, Andersen M, Sundgren PC, Wirestam R, Helms G, van Zijl PC. Arterial Input Functions and Tissue Response Curves in Dynamic Glucose-Enhanced (DGE) Imaging: Comparison Between glucoCEST and Blood Glucose Sampling in Humans. Tomography 2018;4(4):164-171.
10. Nasrallah FA, Pagès G, Kuchel PW, Golay X, Chuang K-H. Imaging brain deoxyglucose uptake and metabolism by glucoCEST MRI. J Cereb Blood Flow Metab 2013;33(8):1270-1278.
11. Paech D, Schuenke P, Koehler C, Windschuh J, Mundiyanapurath S, Bickelhaupt S, Bonekamp D, Bäumer P, Bachert P, Ladd ME. T1ρ-weighted dynamic glucose-enhanced MR imaging in the human brain. Radiology 2017;285(3):914-922.
12. Schuenke P, Koehler C, Korzowski A, Windschuh J, Bachert P, Ladd ME, Mundiyanapurath S, Paech D, Bickelhaupt S, Bonekamp D. Adiabatically prepared spin-lock approach for T1ρ-based dynamic glucose enhanced MRI at ultrahigh fields. Magn Reson Med 2017;78(1):215-225.
13. Schuenke P, Paech D, Koehler C, Windschuh J, Bachert P, Ladd ME, Schlemmer H-P, Radbruch A, Zaiss M. Fast and quantitative T1ρ-weighted dynamic glucose enhanced MRI. Sci Rep 2017;7:42093.
14. Sehgal AA, Li Y, Lal B, Yadav NN, Xu X, Xu J, Laterra J, van Zijl PC. CEST MRI of 3-O-methyl-D-glucose uptake and accumulation in brain tumors. Magn Reson Med 2019;81(3):1993-2000.
15. Tolomeo D, Micotti E, Serra SC, Chappell M, Snellman A, Forloni G. Chemical exchange saturation transfer MRI shows low cerebral 2-deoxy-D-glucose uptake in a model of Alzheimer’s Disease. Sci Rep 2018;8(1):1-10.
16. Wang J, Weygand J, Hwang K-P, Mohamed AS, Ding Y, Fuller CD, Lai SY, Frank SJ, Zhou J. Magnetic resonance imaging of glucose uptake and metabolism in patients with head and neck cancer. Sci Rep 2016;6:30618.
17. Xu X, Chan KW, Knutsson L, Artemov D, Xu J, Liu G, Kato Y, Lal B, Laterra J, McMahon MT. Dynamic glucose enhanced (DGE) MRI for combined imaging of blood–brain barrier break down and increased blood volume in brain cancer. Magn Reson Med 2015;74(6):1556-1563.
18. Xu X, Xu J, Chan KW, Liu J, Liu H, Li Y, Chen L, Liu G, van Zijl PC. GlucoCEST imaging with on-resonance variable delay multiple pulse (onVDMP) MRI. Magn Reson Med 2019;81(1):47-56.
19. Xu X, Xu J, Knutsson L, Liu J, Liu H, Li Y, Lal B, Laterra J, Artemov D, Liu G. The effect of the mTOR inhibitor rapamycin on glucoCEST signal in a preclinical model of glioblastoma. Magn Reson Med 2019;81(6):3798-3807.
20. Xu X, Yadav NN, Knutsson L, Hua J, Kalyani R, Hall E, Laterra J, Blakeley J, Strowd R, Pomper M. Dynamic glucose-enhanced (DGE) MRI: translation to human scanning and first results in glioma patients. Tomography 2015;1(2):105-114.
21. Zaiss M, Herz K, Deshmane A, Kim M, Golay X, Lindig T, Bender B, Ernemann U, Scheffler K. Possible artifacts in dynamic CEST MRI due to motion and field alterations. J Magn Reson 2019;298:16-22.
22. Chan KW, McMahon MT, Kato Y, Liu G, Bulte JW, Bhujwalla ZM, Artemov D, van Zijl PC. Natural D-glucose as a biodegradable MRI contrast agent for detecting cancer. Magn Reson Med 2012;68(6):1764-1773.
23. van Zijl PC, Lam WW, Xu J, Knutsson L, Stanisz GJ. Magnetization transfer contrast and chemical exchange saturation transfer MRI. Features and analysis of the field-dependent saturation spectrum. Neuroimage 2018;168:222-241.
24. Van Zijl PC, Yadav NN. Chemical exchange saturation transfer (CEST): what is in a name and what isn't? Magn Reson Med 2011;65(4):927-948.
25. Walker-Samuel S, Ramasawmy R, Torrealdea F, Rega M, Rajkumar V, Johnson SP, Richardson S, Gonçalves M, Parkes HG, Årstad E. In vivo imaging of glucose uptake and metabolism in tumors. Nat Med 2013;19(8):1067-1072.
26. Ward K, Aletras A, Balaban RS. A new class of contrast agents for MRI based on proton chemical exchange dependent saturation transfer (CEST). J Magn Reson 2000;143(1):79-87.
27. Xu J, Chan KW, Xu X, Yadav N, Liu G, van Zijl PC. On-resonance variable delay multipulse scheme for imaging of fast-exchanging protons and semisolid macromolecules. Magn Reson Med 2017;77(2):730-739.
28. Floyd TF, Clark JM, Gelfand R, Detre JA, Ratcliffe S, Guvakov D, Lambertsen CJ, Eckenhoff RG. Independent cerebral vasoconstrictive effects of hyperoxia and accompanying arterial hypocapnia at 1 ATA. J Appl Physiol 2003;95(6):2453-2461.
29. Liu EY, Haist F, Dubowitz DJ, Buxton RB. Cerebral blood volume changes during the BOLD post-stimulus undershoot measured with a combined normoxia/hyperoxia method. Neuroimage 2019;185:154-163.
Figures