3834
Inclusion of B0 mapping images in motion correction for improved quality of CEST maps1Key Laboratory for Biomedical Engineering of Ministry of Education, Department of Biomedical Engineering, College of Biomedical Engineering & Instrument Science, Zhejiang University, Zhejiang, China, 2MR Collaboration, Siemens Healthcare Ltd., Shanghai, China
Synopsis
The inhomogeneity of the main magnetic field (B0) often results in degraded quality of CEST images. Currently, various B0 mapping methods have been used to correct the B0 inhomogeneity of CEST images. Motion inevitably happens between B0 mapping and CEST scans, which, however, is usually ignored in the current CEST processing pipeline. Here, we show that the inclusion of B0 mapping images into the motion correction process improved the quality of the CEST maps, and statistically significantly improved the uniformity indices. Thus, we suggest adding the motion correction of B0 mapping data step into the standard CEST processing pipeline.
Introduction
The inhomogeneity of the main magnetic field (B0) often results in degraded MR image quality. And in CEST-MRI, the z-spectrum will shift due to the variation of the resonant frequency caused by the B0 inhomogeneity. Up to now, several methods for calculating the B0 field map have been proposed, including water saturation shift referencing (WASSR) and dual-echo gradient-echo.1, 2 When using the B0 map for correction of the CEST data, the motion between the B0 mapping scan and CEST scan is usually ignored, probably due to the smooth profile the B0 map in space. The recent studies mainly focus on the motion correction of the CEST data.3-5 In this study, we take the misalignment of the B0 scan from the CEST scan into account, and show that inclusion of the B0 images into motion correction improve the quality of the final CEST maps.Methods
Data Acquisition:Seven healthy volunteers (5 males and 2 females) were scanned on a Siemens 3T Prisma scanner. A whole-brain SPACE-CEST sequence6 was used for acquiring CEST data: TR=3000ms, TE=17ms, matrix size=152×152×72, FOV=212mm×212mm×201.6mm, and forty saturation offsets with a total duration of 28 min. The dual-echo gradient-echo sequence was used for B0 field mapping with TR=30ms, TE=4.92ms and 9.84ms, and identical matrix size and FOV as the CEST sequence.
Data Processing:
All frames of the CEST data were registered to either the unsaturated S0 image (reg@S0) or the saturated 3.5ppm image (reg@3.5ppm) for motion correction.3 The two sets of registered data and the unregistered data (original) all went through succeeding B0 correction. The typical B0 map (raw B0) was calculated directly from the division of the phase difference of the dual-echo data and the TE difference. The registration of the calculated B0 map may cause noise, so we registered the original dual-echo data. Specifically, we first chose the 3.5ppm frame as the reference image for dual-echo data as it was reported to be the best for amide proton transfer (APT) imaging.3 Second, the motion between the amplitude dual-echo images and the reference image was estimated by SPM12 (The Wellcome Centre for Human Neuroimaging, London, UK)7, with the transformation matrix saved. Third, the transform matrix was applied to the real-part and imaginary-part images of the raw dual-echo data. Last, the motion-corrected phase data was calculated from the registered real and imaginary images and then used to obtain the final corrected B0 map (cor B0). The whole process of motion-correcting the raw B0 mapping images is shown in Fig 1.
Evaluation:
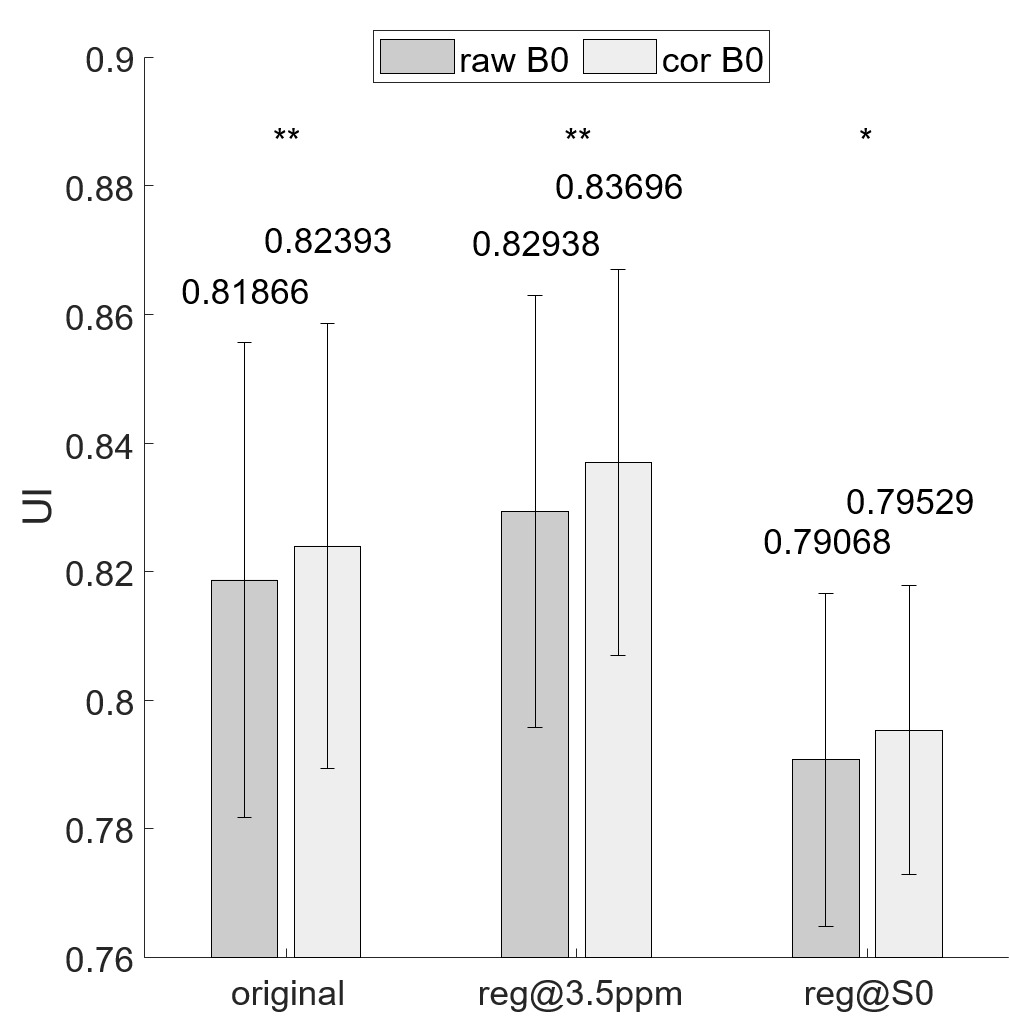
We used the uniformity index (UI) to evaluate the quality of the B0-corrected CEST z-spectral data and magnetization transfer ratio asymmetry maps at different frequency offsets. The formula of UI is as follows:
$$UI=1-\frac{1}{N\cdot \overline{X}}\sum^N_{i=1}\limits|X_i-\overline{X}|$$
where $$$N$$$ is the number of voxels in the region of interest (ROI), $$$X_i$$$ is the intensity of the ith voxel, and $$$\overline{X}$$$ is the mean intensity in ROI. The ROI was manually defined to include the whole brain region.
Results and Discussion
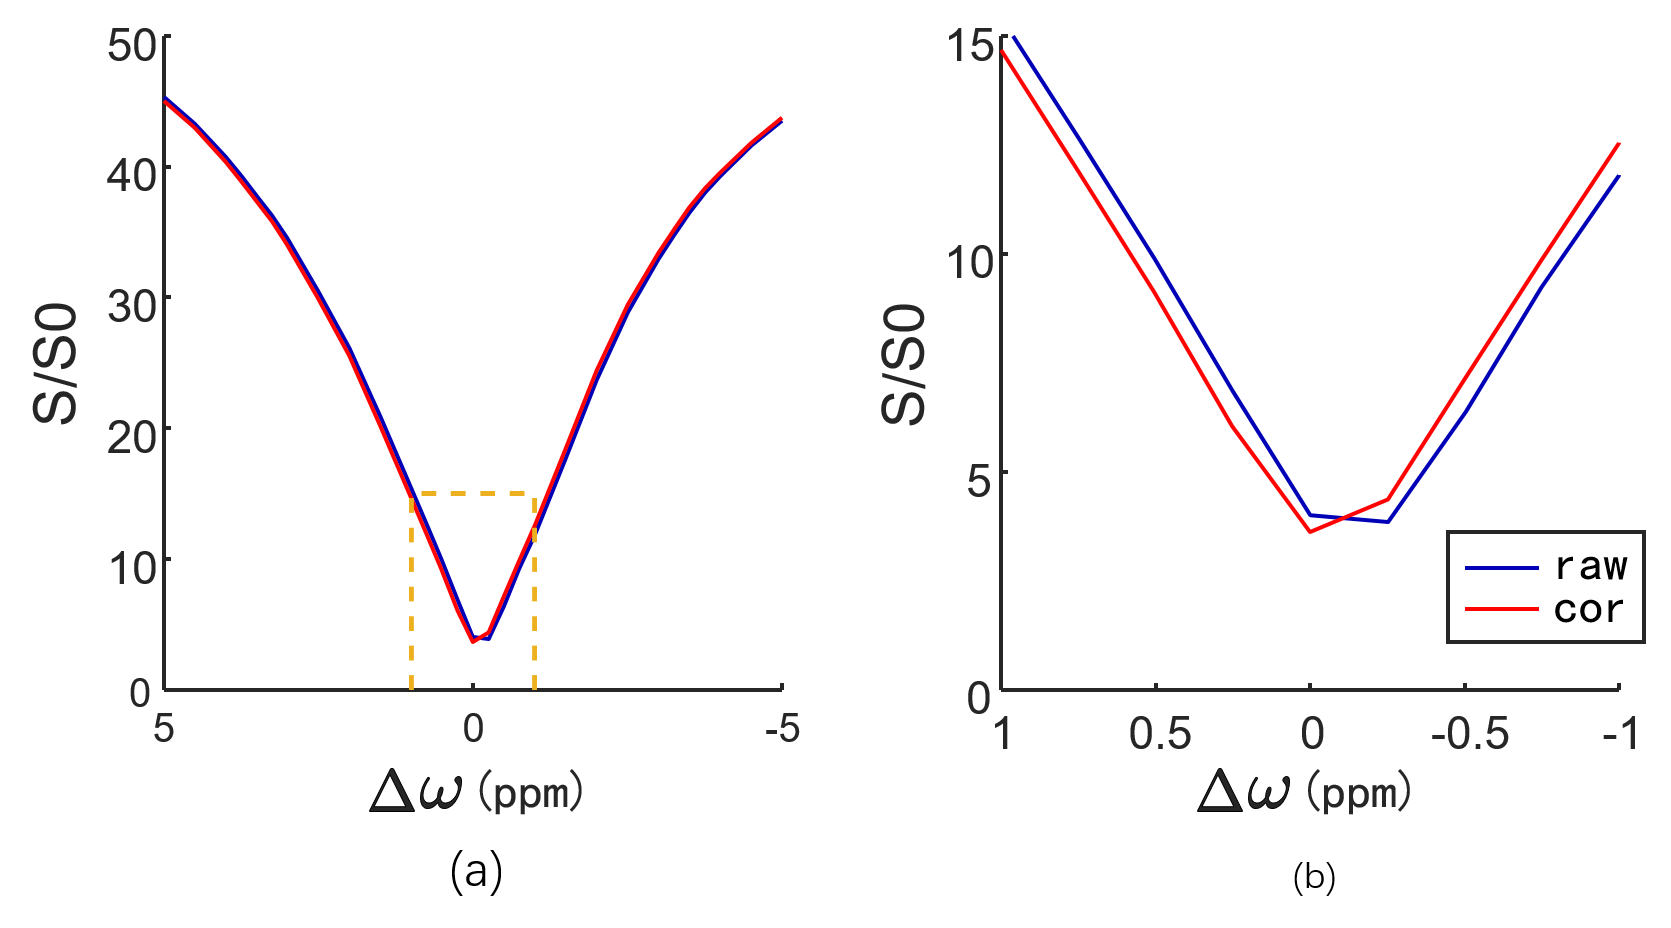
Fig. 2 shows the APT-weighted images from the 3 kinds of registration methods (original, reg@3.5ppm, and reg@S0), which used B0 maps of the original and proposed methods (raw B0 and cor B0). It was found that the artifacts in the APT-weighted images of this healthy volunteer were reduced by motion correction of the B0 data, no matter to which frame the CEST images were registered. Fig. 3 illustrates the comparison of two z-spectra of reg@3.5ppm with raw and motion-corrected B0 maps. The lowest point of the z-spectrum was restored to 0ppm after motion correction of the B0 maps, while it was at -0.25ppm if using the raw B0 map for data processing. Furthermore, with the B0 motion correction method we proposed, the mean UI from seven volunteers all improved statistically significantly, with p-values of 0.05, 0.01, and 0.01 for original, 3.5ppm-registered and S0-registered source CEST images, respectively. All these results (Figs. 2-4) demonstrated the importance and efficacy of including B0 mapping images into the motion correction process. It is worthwhile noting that the motion correction of B0 mapping data couldn’t generate satisfactory APT-weighted images when the displacement between dual-echo data and CEST data was too large. Lastly, this B0 correction method using dual-echo data instead of B0 maps can be applied to other registration schemes such as LRAZ or RPCA+PCA to further improve the quality of the images.4, 5Conclusion
The inclusion of B0 mapping images into the motion correction process improved the quality of the CEST maps, and statistically significantly improved the uniformity indices. Thus, we suggest adding the motion correction of B0 mapping data step into the standard CEST processing pipeline.Acknowledgements
NSFC grant numbers: 61801421 and 81971605. Leading Innovation and Entrepreneurship Team of Zhejiang Province: 2020R01003. This work was supported by the MOE Frontier Science Center for Brain Science & Brain-Machine Integration, Zhejiang University.References
1. Poblador E, Moser P, Dymerska B, et al. A comparison of static and dynamic ∆ B 0 mapping methods for correction of CEST MRI in the presence of temporal B 0 field variations. Magnetic Resonance in Medicine. 2019;82
2. Kim M, Gillen J, Landman BA, Zhou J, van Zijl P. Water saturation shift referencing (WASSR) for chemical exchange saturation transfer (CEST) experiments. Magnetic Resonance in Medicine. 2009;61(6):1441-1450.
3. Zhang Y, Heo H-Y, Lee D-H, et al. Selecting the Reference Image for Registration of CEST Series. Journal of magnetic resonance imaging : JMRI. 2015;43
4. Bie C, Liang Y, Zhang L, et al. Motion correction of chemical exchange saturation transfer MRI series using robust principal component analysis (RPCA) and PCA. Quantitative Imaging in Medicine and Surgery. 2019;9:1697-1713.
5. Wech T, Köstler H. Robust motion correction in CEST imaging exploiting low-rank approximation of the z-spectrum. Magnetic Resonance in Medicine. 2018;80
6. Zhang Y, Yong X, Liu R, et al. Whole-brain chemical exchange saturation transfer imaging with optimized turbo spin echo readout. Magnetic resonance in medicine. 2020;84(3):1161-1172.
7. Friston KJ, Holmes AP, Worsley KJ, Poline JP, Frith CD, Frackowiak RSJ. Statistical parametric maps in functional imaging: A general linear approach. Human Brain Mapping. 1994;2(4):189-210.
Figures