3832
New parameters on CEST imaging by multi pool model in gliomas in comparison with conventional IVIM and 11C-MET uptake on PET/CT1Department of Radiology, Faculty of Medicine, Kagawa University, Miki-cho, Kita-gun, Japan, 2Department of Neurological Surgery, Faculty of Medicine, Kagawa University, Miki-cho, Kita-gun, Japan, 3Kagawa University Hospital, Miki-cho, Kita-gun, Japan, 4GE Healthcare, Hino-shi, Japan
Synopsis
The purpose of this study was to evaluate the correlation among parameters on CEST imaging by multi pool model, IVIM and 11C-methionine (MET) uptake on PET/CT in gliomas. The maximum values of the parameters on CEST imaging, the minimum parameters (ADC, D, D*) and maximum f on IVIM were measured respectively. 11C-MET uptake was semiquantitatively assessed using tumor-to-contralateral normal brain tissue (T/N) ratio. Several strong correlations were observed among some of the parameters. These preliminary results suggest that parameters on CEST imaging by multi pool model and IVIM seems to correlate with 11C-MET uptake on PET/CT in gliomas.
Introduction
Although MTR asymmetry (MTRasym) is often used as a chemical exchange saturation transfer (CEST) parameter, it has some pitfalls1. Positron emission tomography (PET) with 11C-methionine (MET) has been widely used as an imaging tool for brain tumor detection and tumor grading in patients with gliomas2. Intravoxel incoherent motion (IVIM) imaging has been reported to be useful for differentiating low-grade gliomas (LGGs) and high-grade gliomas (HGGs)3. However, to the best of our knowledge, there are few reports that combine them together4-6. The purpose of this study was to evaluate the correlation of parameters on CEST imaging by multi pool model, IVIM and 11C-MET uptake on PET/CT in gliomas.Methods
Preoperative MRI and 11C-MET PET/CT were performed in 16 gliomas. All MR imaging data were acquired on a 3.0 T MR system (SIGNA Architect, GE Healthcare, Waukesha, WI, USA). Multi pool model assumes the magnetization transfer (MT) between free water pool, APT pool and binding water MT pool. Some known parameters (i.e. Transfer rate, T2 of binding water pool) are reused from the literature7. Unknown parameters (T2/T1 of free water pool, density of proton in each pool) was calculated by solving Bloch equation. Because the density of APT pool cannot be separated from free water time constant in this method, "APT density" x "APT transfer rate" x ("Free water T1" or "T2") was visualized as APT_T2 or APT_T1, respectively. MT rate is a binding water MT saturation rate at 7ppm in Z-spectrum. The maximum values of the parameters (MTRasym, APT_T1, APT_T2, T2/T1 ratio, and MT) on CEST imaging, the minimum parameters (ADC, D, D*) and maximum f on IVIM were measured respectively. 11C-MET uptake was semiquantitatively assessed using tumor-to-contralateral normal brain tissue (T/N) ratio. Linear regression analysis and Spearman’s rank correlation were performed to determine the correlation among parameters on CEST imaging by multi pool model, IVIM and 11C-MET T/N ratio. The presence of isocitrate dehydrogenase 1 (IDH1) mutation in tumor specimens was examined by immunohistochemistry and compared with parameters on CEST imaging, IVIM and 11C-MET T/N ratio.Results and Discussion
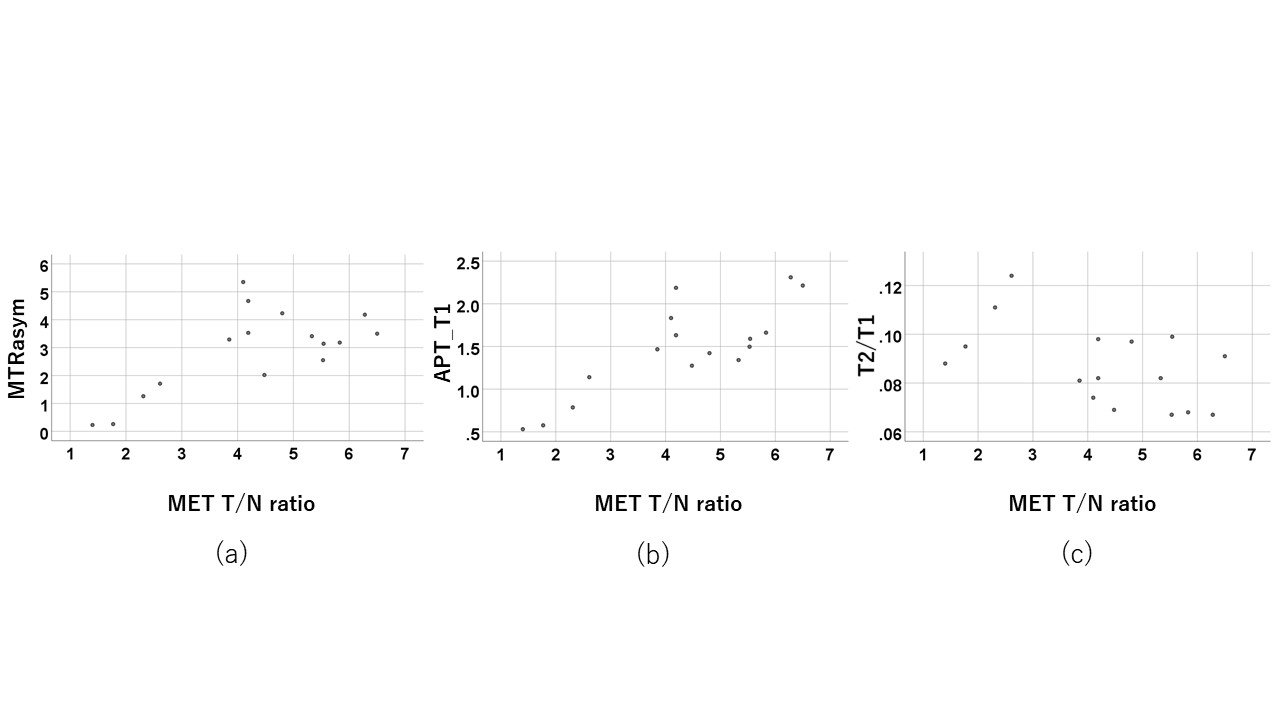
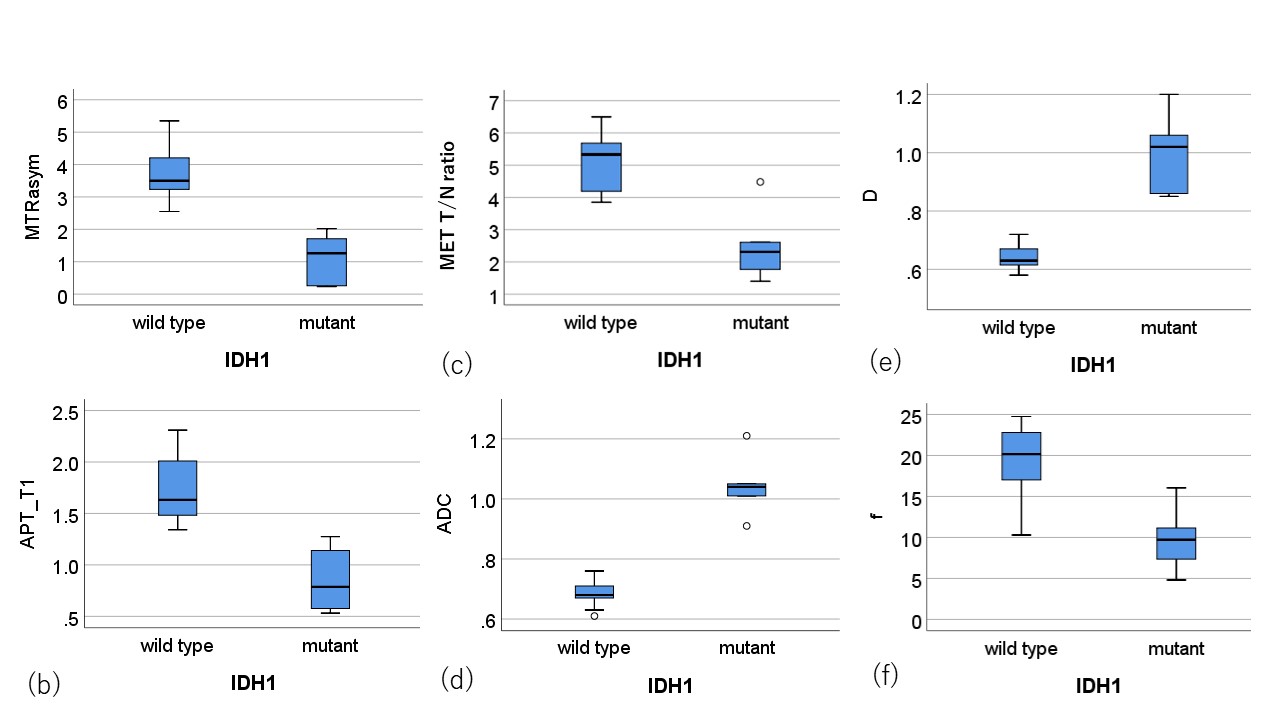
The mean MTRasym signal intensity (SI) values, APT_T1 SI values, APT_T2 SI values, f values and 11C-MET T/N ratio in HGGs (n = 13) were significantly higher than those in LGGs (n = 3), whereas the median ADC values and D values in HGGs were significantly lower than those in LGGs. There were significant positive correlations between MTRasym and 11C-MET T/N ratio (r = 0.68), APT_T1 and 11C-MET T/N ratio (r = 0.81), f and 11C-MET T/N ratio (r = 0.72), MTRasym and f (r = 0.77), APT_T1 and f (r = 0.72). In addition, there existed significant negative correlations between T2/T1 ratio and 11C-MET T/N ratio (r = -0.51), ADC and 11C-MET T/N ratio (ρ = -0.72), D and 11C-MET T/N ratio (ρ = -0.58), MTRasym and ADC (ρ = -0.67), MTRasym and D (ρ = -0.88), APT_T1 and ADC (ρ = -0.78), APT_T1 and D (ρ = -0.90), APT_T2 and D (ρ = -0.63). The mean MTRasym, APT_T1, f and 11C-MET T/N ratio of IDH1-mutant glioma patients (n = 5) was significantly lower than that of IDH1 wildtype patients (n = 11) (p < 0.05). The median ADC and D of IDH1 mutant glioma patients was significantly higher than that of IDH1 wildtype patients (p < 0.05). These results indicate a possibility that combining CEST and IVIM with 11C-MET uptake may improve the diagnostic ability of gliomas.Conclusion
These preliminary results suggest that parameters on CEST imaging by multi pool model and IVIM seems to correlate with 11C-MET uptake on PET/CT in patients with newly diagnosed gliomas.Acknowledgements
No acknowledgement found.References
1. Zhou J, Heo HY, Knutsson L, et al. APT-Weighted MRI: Techniques, Current Neuro Applications, and Challenging Issues. J Magn Reson Imaging. 2019;50(2):347–364.
2. Glaudemans AW, Enting RH, Heesters MA, et al. Value of 11C-methionine PET in imaging brain tumours and metastases. Eur J Nucl Med Mol Imaging. 2013;40(4):615-35.
3. Togao O, Hiwatashi A, Yamashita K, et al. Differentiation of high-grade and low-grade diffuse gliomas by intravoxel incoherent motion MR imaging. Neuro Oncol. 2016;18(1):132–141.
4. da Silva NA, Lohmann P, Fairney J, et al. Hybrid MR-PET of brain tumours using amino acid PET and chemical exchange saturation transfer MRI. Eur J Nucl Med Mol Imaging. 2018;45(6):1031-1040.
5. Schön S, Cabello J, Liesche-Starnecker F, et al. Imaging glioma biology: spatial comparison of amino acid PET, amide proton transfer, and perfusion-weighted MRI in newly diagnosed gliomas. Eur J Nucl Med Mol Imaging. 2020;47(6):1468-1475.
6. Zou T, Yu H, Jiang C, et al. Differentiating the Histologic Grades of Gliomas Preoperatively Using Amide Proton Transfer-Weighted (APTW) and Intravoxel Incoherent Motion MRI. NMR Biomed (2018) 31(1):e3850.
7. Zaiss M, Bachert P. Chemical exchange saturation transfer (CEST) and MR Z-spectroscopy in vivo: a review of theoretical approaches and methods. Phys Med Biol. 2013;58(22):R221-69.
Figures