3831
Rapid Acquisition using Water pre-saturation for quantitive CEST imaging (RAW-qCEST): exchange rate quantitation at 3-Tesla1Center for Biomedical Imaging Research, Department of Biomedical Engineering, Tsinghua University, Beijing, China, 2State Key Laboratory of Southwestern Chinese Medicine Resources, Chengdu University of Traditional Chinese Medicine, Chengdu, China, 3Institute of Science and Technology for Brain-Inspired Intelligence, Fudan University, Shanghai, China
Synopsis
We proposed a Rapid Acquisition using Water pre-saturation for quantitative CEST imaging (RAW-qCEST) sequence, which validated by phantom experiments at 3-Tesla. Raw-qCEST allowed rapid acquisition of multiple readouts with varied saturation powers within one TR, by adding a water pre-saturation module that suppress interference among readouts and a seconds-long CEST saturation module before each readout. Simulation and phantom experiments showed that RAW-qCEST could accurately determine pH-related exchange rates, calculated using a modified omega-plot analysis. Owing to its fast speed and quantitative capability, RAW-qCEST could be useful for imaging stroke and cancers, which will be investigated in future.
Introduction
Quantitative CEST (qCEST) can be achieved by measuring images weighted with different saturation powers (B1,s), allowing estimation of exchange rate, leading to more reliable and specific mapping of pH and other metabolic changes occurred in diseases like stroke and cancers [1]. Spin-lock theorem for steady-state CEST and omega-plot analysis give a simplified numerical solution of qCEST parameters, but it is challenging for clinical use because of high SAR value and long scan time for acquisition multiple B1,s. Recently, QUASS method included saturation time (Ts) and delay time (Td) in qCEST quantification, leading to shorter scan time with Ts/Td of 1.5 s /1.5 s [2, 3]. In this study, we proposed a Rapid Acquisition sequence using Water pre-saturation for qCEST, termed as RAW-qCEST. By simulation and phantom experiments, RAW-qCEST proved rapid acquisition of multiple readouts weighted with varied saturation powers within one TR, allowing exchange rate quantitation via omega-plot.Methods
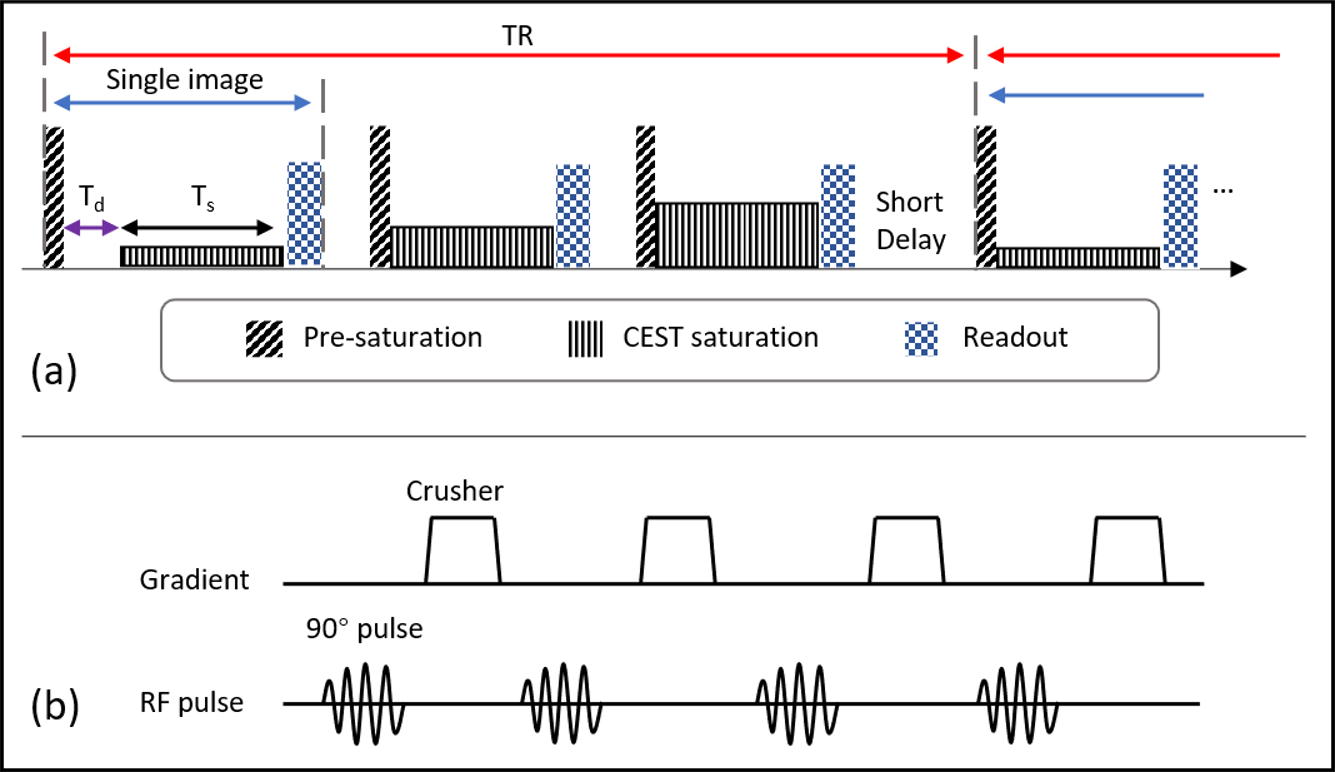
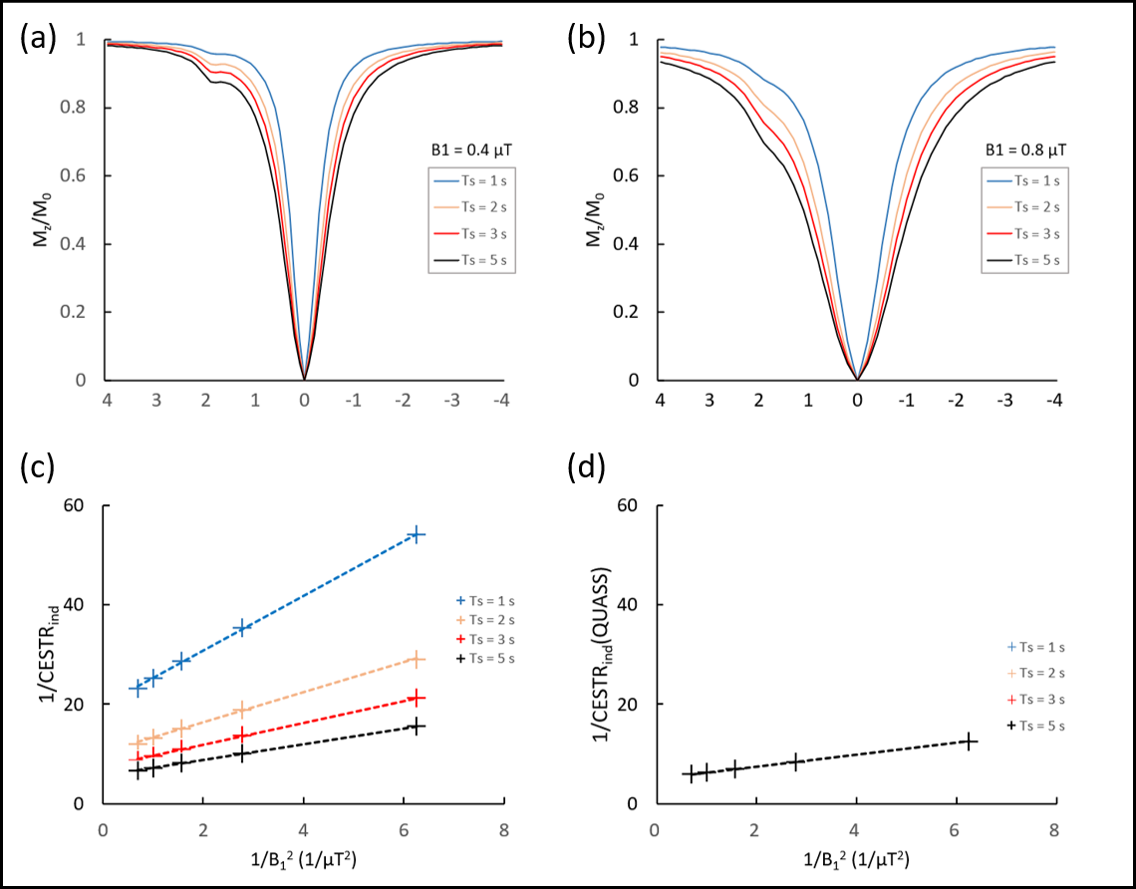
Sequence design: Diagram of the proposed sequence is shown in Figure 1. The RAW-qCEST sequence framework is similar to MeLOVARS by Song et al. in 2015 [4], but added a water pre-saturation module before each saturation module. The basic elements of pre-saturation module are hard RF pulse and strong crusher gradient, and the pair of RF pulse and crusher gradient is repeated 3 or 4 times to achieve better saturation effect. Due to the water pre-saturation module, net magnetization vector M begins to recover from zero, thus removing interference among readouts weighted with different B1,s.Simulation: Simulation was performed with a conventional 2-pool CEST exchange pool in Matlab R2019a (Mathworks, Natick MA). Basic parameters in the 2-pool exchange model were as follows: T1w = 2 s, T2w = 0.1 s, T1s = 1 s, T2s = 15 ms. The fraction of labile proton was fr = 0.001, and exchange rate ksw was assumed of 100 s-1. Chemical shift of labile proton was set as 1.9 ppm, and magnetic field strength was B0 = 3 Tesla. Z-spectrum was simulated from -5 to 5 ppm with intervals of 0.1 ppm. CESTRind was estimated from the simulated CEST Z-spectrum, and ksw and fr were reconstructed by omega-plot analysis.
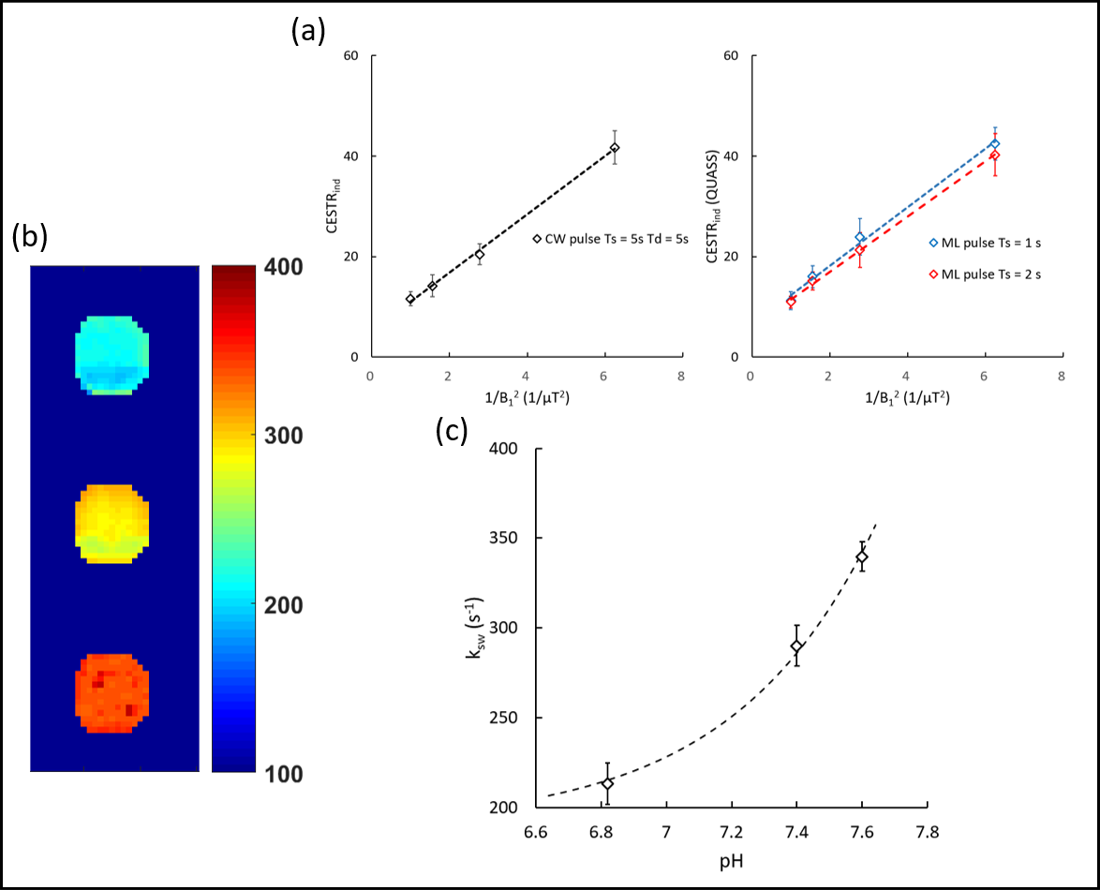
Phantom experiments: All experimental images were obtained from a Philips Ingenia CX 3T MR scanner (Philips Healthcare, Best, The Netherlands) with a 32-channel head coil receiver. A self-prepared creatine-agarose gel phantom with varied pH (6.82, 7.40, 7.60) was scanned by using the proposed RAW-qCEST sequence with the following main parameters: Ts = 1 s and 2 s, slice thickness = 5 mm, FOV = 210*210 mm, and scanning matrix = 72*72. We also scanned typical CEST-EPI sequence of long saturation and delay time (Ts = 5 s, Td = 5 s) as a reference. B0 inhomogeneity of images was accessed by using WASSR acquisition. T1 maps were separately acquired using a built-in sequence of Philips scanner. All of the data analysis was performed in Matlab R2019a.
Results and Discussion
The simulation results showed that apparent CEST effect was more obvious when the duration of CEST saturation increased (Figure 2). It was observed that omega-plot analysis without correction of QUASS generated inaccurate results, and the error was especially severe for Ts with short duration. However, analysis with correction of QUASS solution was robust even when the saturation time was as short as one second. The fitting of ksw and fr was well in line with our expectations.B0 maps showed a maximum B0 inhomogeneity of 0.1 ppm, and we corrected the CEST Z-spectrum with a per-pixel WASSR correction. On the experimental images, a region of interest (ROI) was drawn to generate omega-plot figures for the conventional CW CEST sequence and RAW-qCEST sequence (Figure 3). The same method was used to generate a ksw map of the 3 phantom tubes. As shown in Figure 3, good exponential-function fitting for the relationship between exchange rate and pH of the creatine phantom was obtained by the RAW-qCEST [5].
Conclusion
The simulation and phantom experiments show that proposed RAW-qCEST sequence with water pre-saturation module can provide robust measurement of exchange rate. More solid validations for the proposed sequence are on-going.Acknowledgements
The authors acknowledged funding from National Natural Science Foundation of China (82071914). and the startup package from Tsinghua University to Dr. Song.References
[1] van Zijl, et al. Chemical Exchange Saturation Transfer (CEST): What is in a Name and What Isn't? Magn Reson Med, 2011. 65(4): p. 927-48.
[2] Sun, P.Z. Quasi-steady state chemical exchange saturation transfer (QUASS CEST) analysis-correction of the finite relaxation delay and saturation time for robust CEST measurement. Magn Reson Med, 2021. 85(6): p. 3281-89.
[3] Sun, P.Z. Quasi-steady-state CEST (QUASS CEST) solution improves the accuracy of CEST quantification: QUASS CEST MRI-based omega plot analysis. Magn Reson Med, 2021. 86(3): p. 765-76.
[4] Song, X.L. Multi-Echo Length and Offset VARied Saturation (MeLOVARS) Method for Improved CEST Imaging. Magn Reson Med, 2015. 73(2): p. 488-96.
[5] Sun, P.Z. Simplified Quantification of Labile Proton Concentration-Weighted Chemical Exchange Rate (k(ws)) with RF Saturation Time Dependent Ratiometric Analysis (QUESTRA): Normalization of Relaxation and RF Irradiation Spillover Effects for Improved Quantitative Chemical Exchange Saturation Transfer (CEST) MRI. Magn Reson Med, 2012. 67(4): p. 936-42.
Figures