3828
Comparison of multi-atlas based and template based method in the quantitative analysis of [18F]-FP-DTBZ PET1Department of Electronic and Information Engineering, Harbin Institute of Technology at Shenzhen, Shenzhen, China, 2Xuanwu Hospital Capital Medical University, Beijing, China, 3Peng Cheng Laboratory, Shenzhen, China, 4Mindsgo Life Science Shenzhen Co. Ltd, Shenzhen, China
Synopsis
[18F]-FP-DTBZ PET provides reliable information for the diagnosis of Parkinson’s disease. Quantitative analysis of PET images requires a precise segmentation of the region of interest. Two [18F]-FP-DTBZ PET image quantification methods, multi-atlas based and template based methods were compared in this study. A total of 68 subjects were included, each of them underwent 3D T1-weighted MR imaging and [18F]-FP-DTBZ PET imaging. Twenty subjects were used to build atlases and 48 were used for validation. Using dice coefficient and ICC coefficient for evaluation, we observed that the multi-atlas based method showed better performance than the template based method.
Introduction
[18F]9-fluoropropyl-(+)-dihydrotetrabenazin ([18F]-FP-DTBZ) positron emission tomography (PET) is a reliable tool for monitoring the severity of Parkinson’s disease (PD)1. Quantitative analysis of PET images requires the definition of region of interest (ROI)2. To extract ROI, template based method is widely used, which avoids the dependence on MR images3,4. However, the single template strategy ignores the inter-subject variability, which may lead to ROI segmentation error and result in quantitative misestimate. The reliability of ROI acquisition still needs further validation. In this study, we compared two quantification methods for [18F]-FP-DTBZ PET, a classical single template based method, and a multi-atlas based method.Methods
A total of 68 subjects including 38 PD patients and 30 healthy controls from Xuanwu Hospital of Capital Medical University were included in this study. Data acquisition was performed using a hybrid 3.0-T PET/MR scanner (uPMR790, UIH, Shanghai, China). 3D T1-weighted imaging (T1WI) data were collected from all participants with the following parameters: TR/TE: 7.86/3.2 ms; flip angle: 10; FOV: 230×256 mm2; voxel size: 0.5 mm × 0.5 mm × 0.67 mm. Scanning parameters of [18F]-FP-DTBZ PET imaging were as follows: FOV = 300 mm; voxel size = 1.17 × 1.17 × 1.4 mm. Twenty subjects including 10 PD patients and 10 HCs were selected randomly to build the PET template and atlases. The PET template was constructed by merging these samples using Advanced Normalization Tools (ANTs)5. Atlases were generated by coregistering individual PET images to the PET templates. The remaining subjects were used for testing. The label of each PET image was generated from corresponding MRI using Brain Label and coregistration methods, and the subregions of striatum including the putamen, caudate, and nucleus accumben were selected as ROI6. For ROI extraction of test subjects, the MRI-based method was applied as the ground truth. The multi-atlas method was performed by finding and merging best-matched atlases, while the template based method simply coregistered the individual PET images with the template. Dice coefficient was applied for segmental evaluation. ICCs of SUVR were calculated to identify the consistency between the results of each method and the ground truth.Results
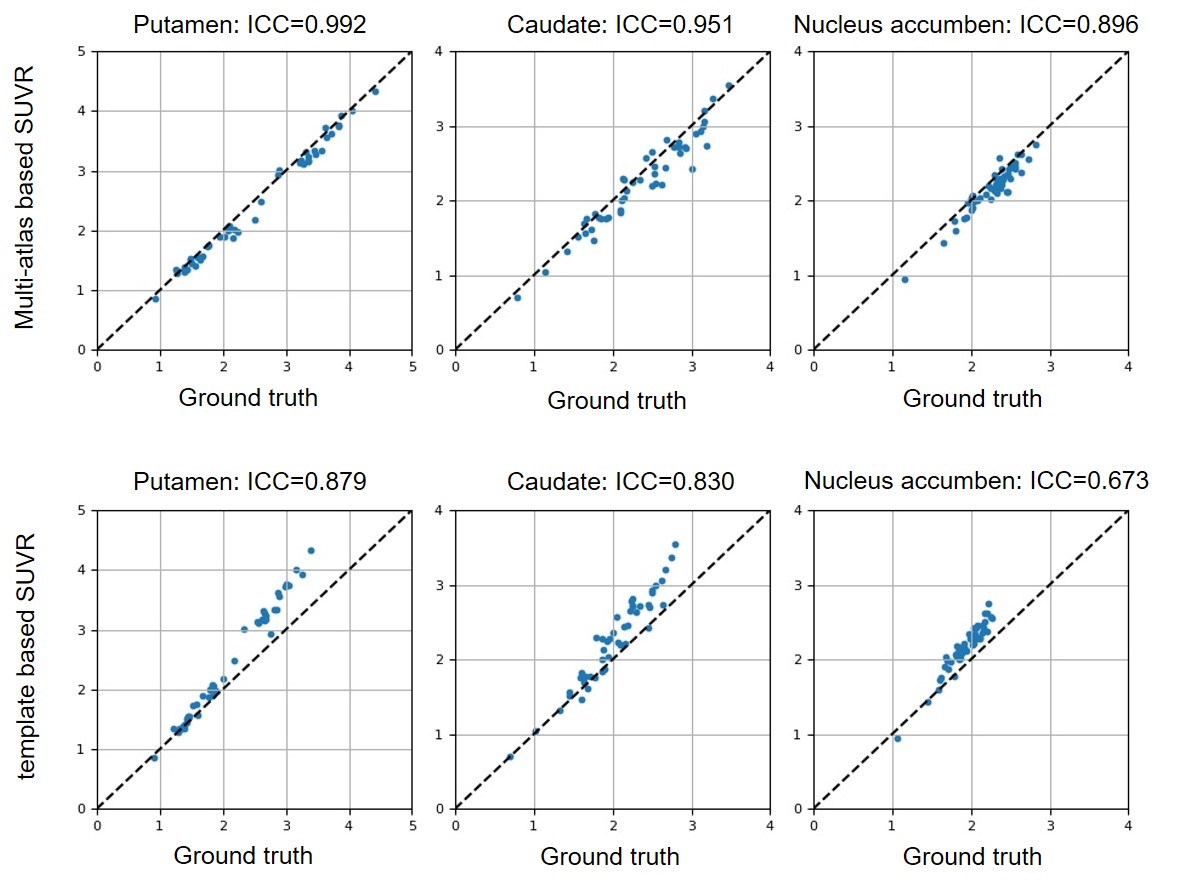
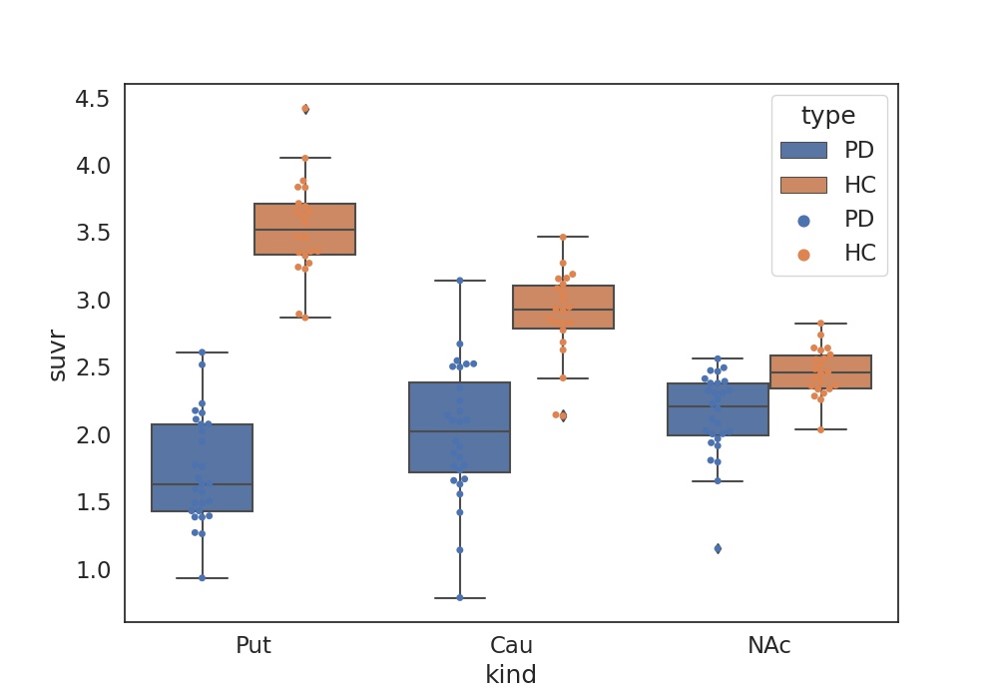
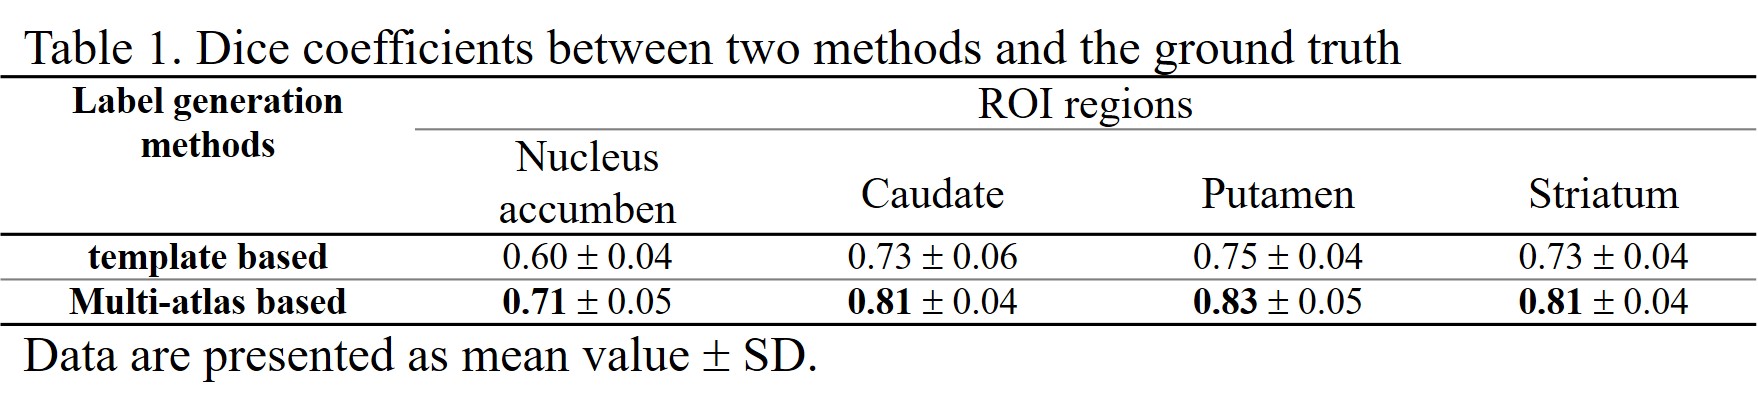
Table 1 demonstrated the dice coefficients between each method and the ground truth. The multi-atlas based method held better segmentation accuracy than the template based method on all three subregions as well as on the whole striatum. Figure 1 showed the SUVR quantification correlations of the two methods with the ground truth. As demonstrated, the multi-atlas based method showed great performance with an average ICC of 0.953. SUVRs calculated by the template method were generally higher than standard values which resulted in ICC degeneration. Figure 2 showed the SUVRs calculated by the multi-atlas method in the subregions of PD and HC groups. The SUVRs of PD patients were generally lower than that of HCs and showed significant differences in all of the subregions (p < 0.001). The SUVRs of the putamen could be separated clearly from HCs.Discussion
The present study was designed to compare two quantitative methods for [18F]-FP-DTBZ PET evaluation. Our results suggest that the multi-atlas method held higher accuracy than the template based method on quantification. Due to the lack of structural information in PET images, the intensity distribution caused by the absorption difference of tracers in different brain regions has become the main basis for structural localization in the process of image registration2. When tracer uptake decreases (especially in PD patients), the image intensity between sample and template loses structural consistency, which might lead to registration errors3. Multi-atlas method could reduce the distortion in the coregistration process by searching the most similar atlases for samples. The appliance of the multi-label fusion strategy increased the reliability of ROI extraction and restrained the noise of inter-subject variability. The discriminant study suggests that SUVR distributions of HC and PD patients have significant divergence in the subregions of the striatum, which was in line with the previous study.Conclusion
For [18F]-FP-DTBZ PET image quantification, the multi-atlas method showed better performance than the template based method, indicating great potential for Parkinson’s disease diagnosis in clinical routine.Acknowledgements
This study is supported by grants from Basic research foundation of Shenzhen Science and Technology Stable Support Plan (GXWD20201230155427003-20200822115709001).References
1. Okamura N, Villemagne VL, Drago J, Pejoska S, Rowe CC. In Vivo Measurement of Vesicular Monoamine Transporter Type 2 Density in Parkinson Disease with F-18-AV-133. Journal of Nuclear Medicine. 2010;51(2):223-228.
2. Edison P, Carter SF, Rinne JO, et al. Comparison of MRI based and PET template based approaches in the quantitative analysis of amyloid imaging with PIB-PET. Neuroimage. 2013;70:423-433.
3. Lung HJ, Weng Y-H, Wen M-C, Hsiao T, Lin K-J. Quantitative study of 18 F-(+) DTBZ image: comparison of PET template-based and MRI based image analysis. Scientific reports. 2018;8(1):1-10.
4. Kuhn FP, Warnock GI, Burger C, Ledermann K, Martin-Soelch C, Buck A. Comparison of PET template-based and MRI-based image processing in the quantitative analysis of C 11-raclopride PET. EJNMMI research. 2014;4(1):1-7.
5. Avants BB, Tustison N, Song G. Advanced normalization tools (ANTS). Insight j. 2009;2(365):1-35.
6. Wu D, Ma T, Ceritoglu C, et al. Resource atlases for multi-atlas brain segmentations with multiple ontology levels based on T1-weighted MRI. Neuroimage. 2016;125:120-130.
Figures