3827
Pulmonary Compliance Imaging Using Hyperpolarized Gas MRI1Key Laboratory of Magnetic Resonance in Biological Systems, State Key Laboratory of Magnetic Resonance and Atomic and Molecular Physics, National Center for Magnetic Resonance in Wuhan, Wuhan Institute of Physics and Mathematics, Innovation Academy for Precision Measurement Science and Technology, Chinese Academy of Sciences- Wuhan National Laboratory for Optoelectronics, Wuhan, China, 2Department of Radiology, Chinese PLA General Hospital, Beijing, China
Synopsis
Pulmonary compliance is generally measured using ventilator and esophageal balloon in clinical practice, and only global compliance could be obtained. In this study, we proposed a method for imaging pulmonary compliance using hyperpolarized (HP) 129Xe MRI. Lung compliance derived by HP 129Xe MRI could be used for quantifying the injuries caused by fibrosis in rats.
Introduction
Lung compliance is one of the most important parameters that reflect the elastic properties of the lung. Current clinic methods could only provide the global measurement of lung compliance, while the imaging modalities have the potential in regional assessment of the lung compliance. Hyperpolarized (HP) 129Xe MRI has been widely used in pre-clinical research in recent years, it has inherent advantages in measuring the lung volume 1,2. Previous study has demonstrated the ability of HP 129Xe MRI in measuring global lung compliance3. Herein, we proposed a method for obtaining regional lung compliance using HP 129Xe MRI, and the feasibility of the proposed method for evaluating the lung compliance changes caused by fibrosis was also demonstrated.Methods
Twenty Sprague Dawley rats were divided into two groups. The fibrosis group were treated with 0.4 mL solution of bleomycin, and the control group were treated with an equivalent amount of normal saline. HP 129Xe MRI was performed on all the rats from 21 to 23 days after treatment. For 129Xe MRI, multi-slice 2D fast low angle shot sequence was used to acquire the ventilation images with different airway pressures using the following parameters: FOV = 5 cm×5 cm, matrix = 64 × 64, FA = 12°, TE/TR = 2.7/177.3 ms, slice thickness = 1.6 mm, interslice distance = 1.6 mm, and number of slices = 24. For each rat, the ventilation images at different airway pressures were registered to the images with minimal pressure using Advanced Normalization Toolkit4. Jacobian determinant maps were derived from diffeomorphic transformation which pulled the affine transformed different pressures ventilation images toward the reference images. Regional lung volume changes were depicted by multiplying the Jacobian determinant maps to the voxel size. The 3D distribution of lung compliance (Cmap) was obtained by fitting the lung volume change maps with corresponding pressures to the equation of CXe = △V/△P pixel-by-pixel, where the V is the lung volume and the P is the breath-holding airway pressure recorded by a home-built 129Xe delivery system. Apart from HP 129Xe MRI, CT images were also acquired as cross-validation of fibrosis, and the acquisition parameters were as follows: tube voltage = 120 kV, FOV = 6 cm, spatial resolution = 0.5×0.5×0.5 mm3.Results
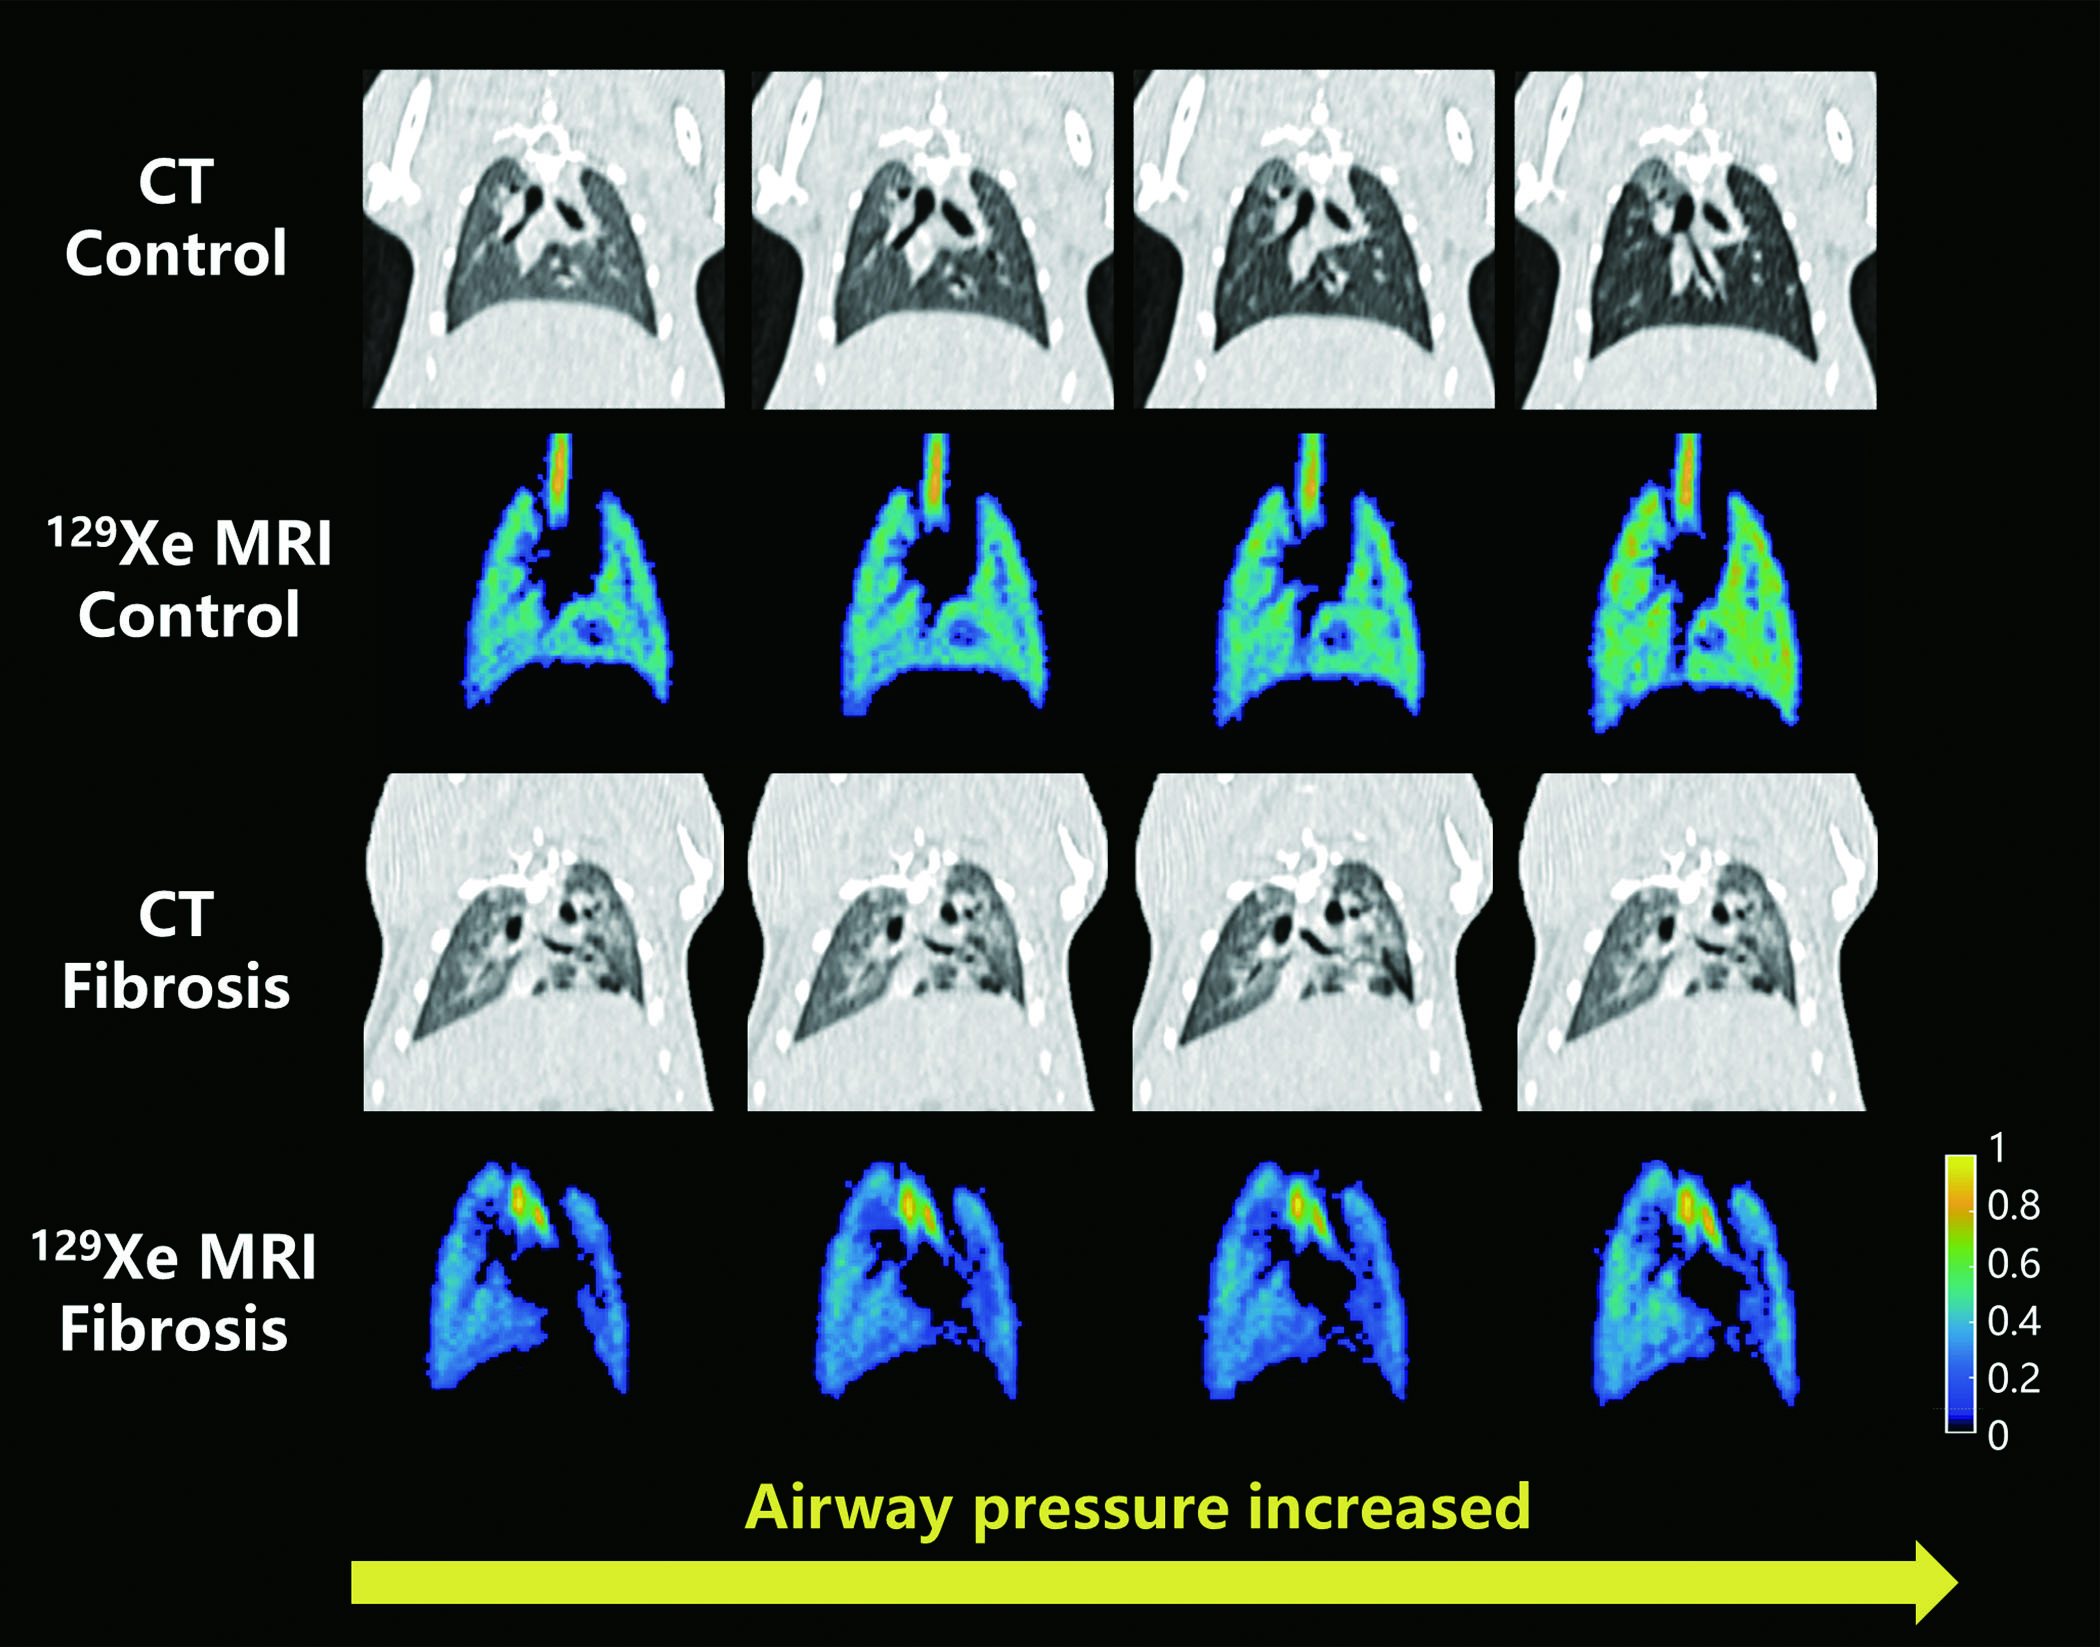
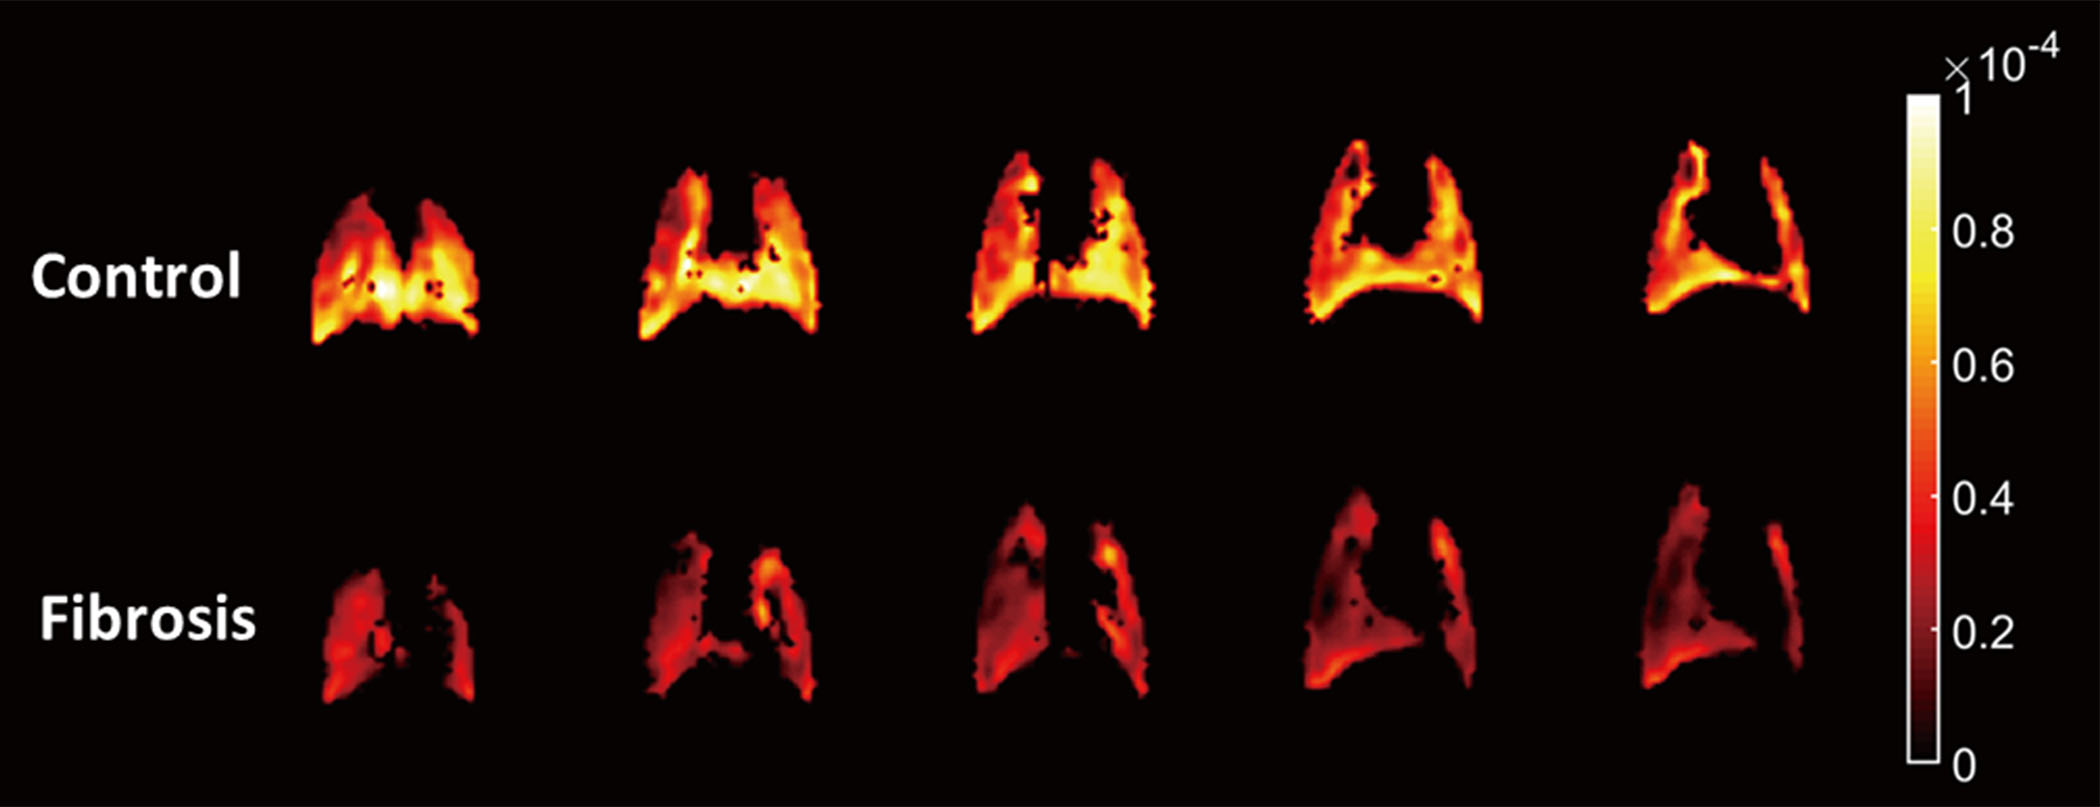
Typical ventilation and CT images from fibrosis and control groups with different airway pressures were shown in Figure 1. As the airway pressure increased, obvious lung expansion could be observed. Figure 2 showed the representative Cmap (5 of 24 slices were shown for each rat). Higher compliance was observed in the basal areas of control rat, while the distribution of lung compliance was relatively homogeneous in fibrosis rats. The mean compliance in fibrosis group was significantly lower than that in control group ((2.60 ± 0.78) × 10-5 mL/cm H2O vs. (4.31 ± 0.59) × 10-5 mL/cm H2O; p < .001).Discussion and conclusion
In this study, we proposed a method for measuring regional pulmonary compliance using HP 129Xe MRI. Significant difference was found in the pulmonary compliance derived by 129Xe ventilation images between the fibrosis and control group. These results indicate the proposed method might enhance our understanding of pulmonary compliance changes caused by restrictive lung diseases, such as fibrosis.Acknowledgements
This work is supported by National Natural Science Foundation of China (91859206, 21921004, 81825012), National key Research and Development Project of China (2018YFA0704000), Key Research Program of Frontier Sciences (ZDBS-LY-JSC004) and Scientific Instrument Developing Project of the Chinese Academy of Sciences (GJJSTD20200002, YJKYYQ20200067), CAS. Haidong Li acknowledges the support from Youth Innovation Promotion Association, CAS (2020330). Xin Zhou acknowledges the support from the Tencent Foundation through the XPLORER PRIZE.References
1. He M, Driehuys B, Que L G, et al. Using hyperpolarized 129Xe MRI to quantify the pulmonary ventilation distribution. Acad Radiol, 2016, 23(12): 1521-1531.
2. Virgincar R S, Cleveland Z I, Sivaram Kaushik S, et al. Quantitative analysis of hyperpolarized 129Xe ventilation imaging in healthy volunteers and subjects with chronic obstructive pulmonary disease. NMR in Biomed, 2013, 26(4): 424-435.
3. Zhang M, Li H, Li H, et al. Quantitative Evaluation of Changes in Lung Compliance Caused by Fibrosis using Hyperpolarized Gas MRI. In: Proc 28th Annual Meeting ISMRM. 2020. 5416.
4. Avants BB, Tustison N, Song G. Advanced normalization tools (ANTS). Insight j 2009;2(365):1-35.
Figures