3825
Optimized Ultrashort Echo Time – Magnetic Resonance Fingerprinting (UTE-MRF) for Myelin-Proton fraction Imaging1Center for Brain Imaging Science and Technology, College of Biomedical Engineering and Instrumental Science, Zhejiang University, Hangzhou, China, 2MR Collaborations, Siemens Healthineers Ltd, Shanghai, China, 3Department of Radiology, Stanford University, Stanford, CA, United States, 4Department of Electrical Engineering, Stanford University, Stanford, CA, United States, 5State Key Laboratory of Modern Optical Instrumentation, College of Optical Science and Engineering, Zhejiang University, Hangzhou, China, 6Department of Imaging Sciences, University of Rochester, Rochester, NY, United States
Synopsis
Optimization of MRF (MR fingerprinting) sequence is important for encoding MR tissue parameters with the maximal SNR for better quantification of representative tissues of WM, GM and CSF. Here, we targeted ultrashort T2 tissues and proposed an optimized acquisition parameter patterns for 3D ultrashort echo time MRF sequence with the goal of achieving higher quantification accuracy for myelin-proton based on Cramér‐Rao Lower Bound. Our results show that the optimized UTE-MRF sequence achieved high accuracy in myelin-proton quantification and whole-brain myelin-proton imaging in 15 min with 1mm isotropic resolution. The optimization also opens the door to further reduce scan time.
Introduction
MRF has been shown to be a reliable method for estimating relaxometric parameters of many types of brain tissues1,2. However, due to the short T2 and low proton density, the detection of myelin-related structure is still difficult. Previously, we developed a novel MRF sequence3-5 that used a 2D/3D ultrashort echo time technique to image bone- and myelin-like structures. In this work, we further proposed a design with an optimized 3D MRF pattern based on Cramér‐Rao Lower Bound (CRLB)6, which allows for accurate myelIn-proton quantification and whole brain myelin-proton imaging in 15 minutes with 1 mm isotropic resolution.Methods
Optimization: Our theoretical characterization was based on CRLB. We calculated CRLB using automatic differentiation7. The CRLB of the unknown parameter estimate $$$\hat{\theta}$$$ is formulated as:$$V(\theta )=I^{-1}({\theta})$$
where $$$V(\theta)$$$ is the CRLB matrix and $$$I({\theta})$$$ is the Fisher information matrix which, with the assumption of white Gaussian noise, is simplified as:
$$I(\theta ) =\frac{1}{\sigma ^2}\sum_{n=1}^{N}{J_{n}^{T}(\theta )J_n(\theta )}$$
where $$$J_n(\theta )={\partial \mathbf{m}[n] }/{\partial \theta }\in \mathbb{R}^{2\times p}$$$ is the Jacobian matrix of each UTE-MRF signal $$$\mathbf{m}[n]$$$ w.r.t. the unknown parameter $$$\theta $$$. The parameter $$$\theta$$$ refers to T1 and T2 values of three representative tissues: myelin-proton, WM and GM. We assume the prior knowledge of $$$\theta $$$ (T1/T2 = 300/1 ms for myelin-proton; 800/60 ms for WM; 1300/80 ms for GM) based on literature8-15.
With the bound constraints on flip angle (FA) and TE following our previous work3 and smoothness constraints on FA and TE variations according to literature2, the optimization function is as:$$\min_{{[FA_n,TE_n]}_{n=1}^{564}}\textrm{Tr}(WV(\theta))$$s.t. $$0.05\leqslant TE_n\leqslant 0.2, 1\leqslant n\leqslant 564$$$$5\leqslant {FA}_n\leqslant 60, 1\leqslant n\leqslant 564$$$$\left | TE_{n+1}-TE_n \right |\leqslant 0.005, 1\leqslant n\leqslant 564$$$$\left | FA_{n+1}-FA_n \right |\leqslant 1, 1\leqslant n\leqslant 564$$
where $$$\textrm{Tr}$$$ is the trace of matrix, $$$W$$$ is $$$\textrm{diag}([\frac{1}{T1_{myelin}^2},\frac{1}{T2_{myelin}^2},\frac{1}{T1_{WM}^2},\frac{1}{T2_{WM}^2},\frac{1}{T1_{GM}^2},\frac{1}{T2_{GM}^2}])$$$ to weight the CRLB of each parameter equally according to literature7.
Simulations, phantom and in vivo experiments:
Numerical simulations were implemented on a digital phantom shown in Fig.1, including 10 tubes with pure myelin-proton, WM, GM and mixture of myelin-proton and WM. Note that we did not include the mixture of myelin-proton and GM, since our interest focused on separating myelin-proton from long T2 tissue in WM. Different PD in pure tissue tube was set to see the effect of signal intensity in tissue matching. In signal generating, we considered two sets of acquisitions: (1) Original UTE-MRF4 , and (2) the CRLB-derived UTE-MRF. Fig.2b depicts the sequence diagram in a TR, and Fig.2a depicts the FA and TE patterns of two sequences with other parameters listed in Fig.2d. An optimized 2D golden angle method16 was employed to cover the 3D k-space with the k-space coverage of the first frame under repetitions of 160 shown in Fig.2c. The scan time is in 15 min with 1 mm isotropic resolution. To evaluate the feasibility of CRLB method for improving parameter mapping quality without increasing k-space coverage rate, we also did the simulation under repetitions of 800 and 1600, corresponding to five and ten times increase in scan time.
For phantom experiments, ultrashort T2 phantoms were created by doping distilled water with manganese chloride ($$$\mathrm{MnCl_2}$$$), leading to T1/T2 of 10.6/0.67, 10.5/0.47, 9.9/0.36, 11.2/0.58, 10/0.26, 10.7/0.29 ms. Both phantom and in vivo experiments were performed with the CRLB-derived UTE-MRF sequence on a 3T MAGNETOM Prisma scanner (Siemens Healthcare, Erlangen, Germany) using a 64-coil channel head coil. The reference T1 and T2* of phantom experiments were obtained with inversion recovery UTE and UTE sequences employed in the literature3. In vivo brain imaging was performed on three consenting healthy volunteers.
Dictionary matching was performed after a sliding window combination using a window size of 30 for pure tissue tubes in simulation and phantom experiments. To quantify myelin-proton fraction in the mixed tissue tubes and in vivo studies, non-negative least-square method was used to decompose the UTE-MRF signal.
To assess the reconstruction accuracy, we calculated the normalized error for each tube, i.e., $$$\left | I_n - \hat{I_n} \right |/\left | I_n \right |$$$ , where $$$I_n$$$ and $$$\hat{I_n}$$$ denote the true and estimated value in the nth tube/phantom, respectively.
Results
Fig.3 shows the simulation results.Fig.4 shows the phantom results.
Fig.5 shows the reconstructed myelin-proton fraction in WM from three healthy subjects. The range of corresponding myelin fraction is in agreement with a previous MT study17.
Discussion
The simulation results show that CRLB-derived UTE-MRF outperformed the original one in both T1/T2 quantification and tissue fraction estimation. Comparing with the original one, even lower k-space coverage in optimized sequence performed better than the original one with higher k-space coverage, which shows the potential of CRLB optimization in reducing scan time while maintaining the quantification accuracy. Phantom and in vivo experiments also show feasibility of the proposed sequence in myelin-proton quantification and imaging. Validation for quantitative in vivo applications still require more controlled studies and comparison with pathological measurements.Conclusion
We optimized our previous UTE-MRF sequence based on CRLB. Our results show that the optimized UTE-MRF sequence achieved higher accuracy for myelin-proton quantification and whole-brain myelin-proton imaging in 15 min with 1mm isotropic resolution. The results also show that the CRLB optimization opens the door to further reduce scan time, important for routine clinical use of the method.Acknowledgements
The work was supported in part by the National Key R&D Program of China (grant number: 2020AAA0109500), National Natural Science Foundation of China (grant number: 81871428), and Fundamental Research Funds for the Central Universities (grant number: 2021FZZX002-19)References
1. Jordan SP, Hu S, Rozada I, et al. Automated design of pulse sequences for magnetic resonance fingerprinting using physics-inspired optimization. Proc Natl Acad Sci. 2021;118(40).
2. Zhao B, Haldar JP, Liao C, et al. Optimal Experiment Design for Magnetic Resonance Fingerprinting: Cramer-Rao Bound Meets Spin Dynamics. IEEE Trans Med Imaging. 2019;38(3):844-861.
3. Li Q, Cao X, Ye H, et al. Ultrashort echo time magnetic resonance fingerprinting (UTE-MRF) for simultaneous quantification of long and ultrashort T2 tissues. Magn Reson Med. 2019;82(4):1359-1372.
4. Li Q, Cao X, Ye H, et al. 3D UTE-MRF for multiple parameteric maps with sub-millimeter isotropic resolution using multi-dimensional golden-angle radial trajectory. Int Soc Magn Reson Med. 2020. Virtual meeting.
5. Zhou Z, Li Q, Liao C, et al. 3D ultrashort echo time MR fingerprinting (3D UTE-MRF) for whole brain myelin imaging. Int Soc Magn Reson Med. 2021. Virtual Meeting.
6. Kay SM. Fundamentals of Statistical Signal Processing, Volume I:Estimation Theory. Upper Saddle River: Prentice Hall, 1993.
7. Lee PK, Watkins LE, Anderson TI, et al. Flexible and efficient optimization of quantitative sequences using automatic differentiation of Bloch simulations. Magn Reson Med. 2019;82(4):1438-1451.
8. Ma D, Coppo S, Chen Y, et al. Slice profile and B1 corrections in 2D magnetic resonance fingerprinting. Magn Reson Med. 2017;78(5):1781-1789.
9. Wansapura JP, Holland SK, Dunn RS, et al. NMR Relaxation Times in the Human Brain at 3.0 Tesla. Journal of Magnetic Resonance Imaging. 1999;9:531-538.
10. Cao X, Ye H, Liao C, et al. Fast 3D brain MR fingerprinting based on multi-axis spiral projection trajectory. Magnetic Resonance in Medicine. 2019;82(1):289-301.
11. Liao C, Wang K, Cao X, et al. Detection of Lesions in Mesial Temporal Lobe Epilepsy by Using MR Fingerprinting. Radiology. 2018;288(3):804-812.
12. Buonincontri G, Kurzawski JW, Kaggie JD, et al. Three dimensional MRF obtains highly repeatable and reproducible multi-parametric estimations in the healthy human brain at 1.5T and 3T. Neuroimage. 2021;226:117573.
13. Deoni SC, Peters TM, Rutt BK. High-resolution T1 and T2 mapping of the brain in a clinically acceptable time with DESPOT1 and DESPOT2. Magn Reson Med. 2005;53(1):237-241.
14. Ma D, Jiang Y, Chen Y, et al. Fast 3D magnetic resonance fingerprinting for a whole-brain coverage. Magn Reson Med. 2018;79(4):2190-2197.
15. Du J, Ma G, Li S, et al. Ultrashort echo time (UTE) magnetic resonance imaging of the short T2 components in white matter of the brain using a clinical 3T scanner. Neuroimage. 2014;87(Supplement C):32–41.
16. Zhang J, Feng L, Otazo R, et al. Rapid dynamic contrast-enhanced MRI for small animals at 7T using 3D ultra-short echo time and golden-angle radial sparse parallel MRI. Magn Reson Med. 2019;81(1):140-152.
17. Saccenti L, Hagiwara A, Andica C, et al. Myelin Measurement Using Quantitative Magnetic Resonance Imaging: A Correlation Study Comparing Various Imaging Techniques in Patients with Multiple Sclerosis. Cells. 2020;9(2).
Figures
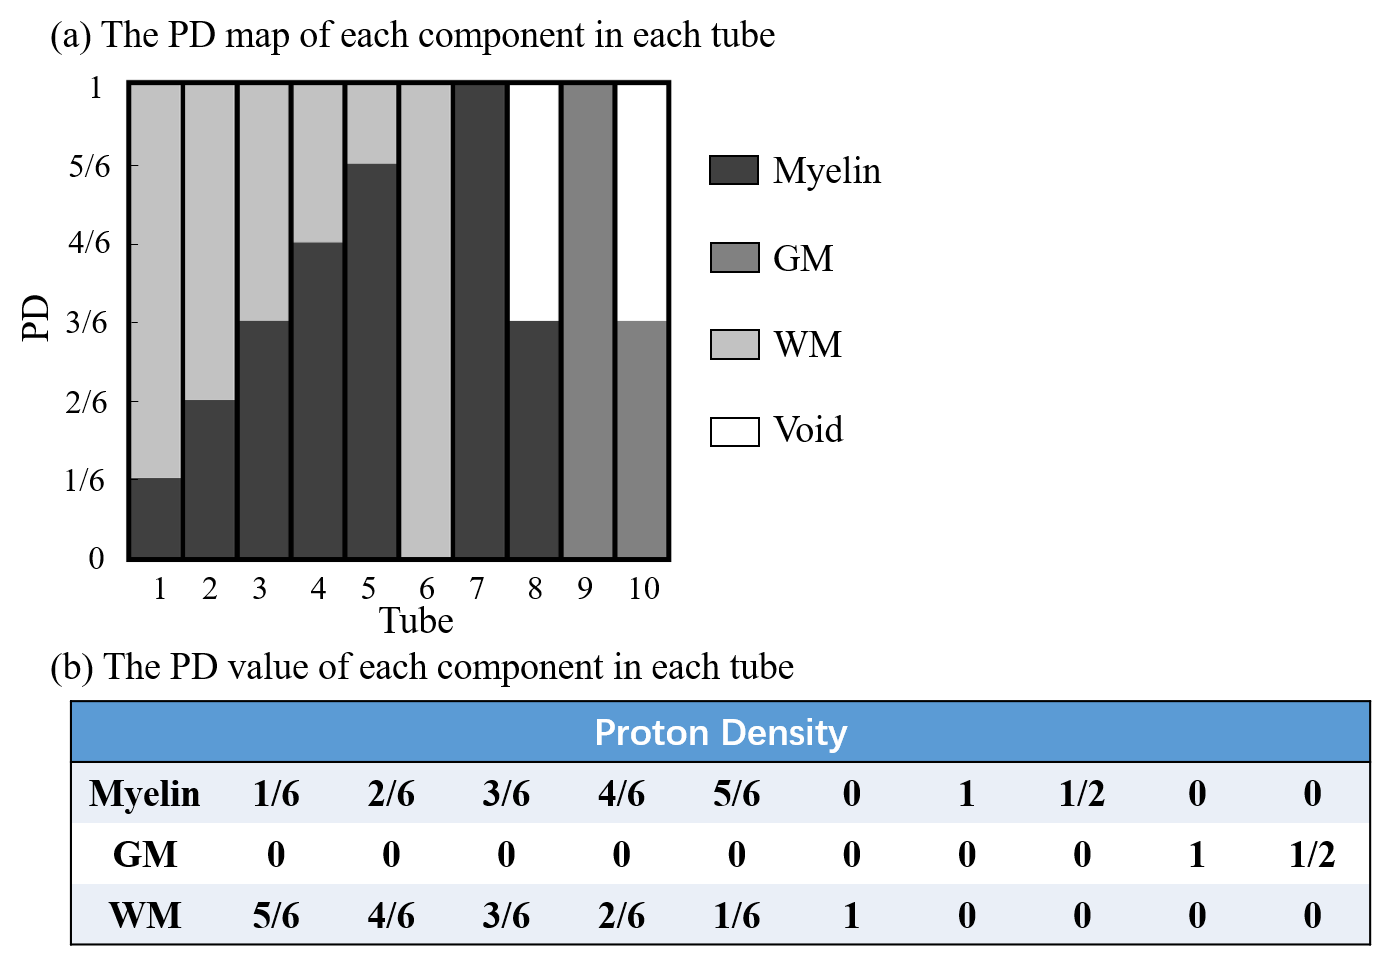
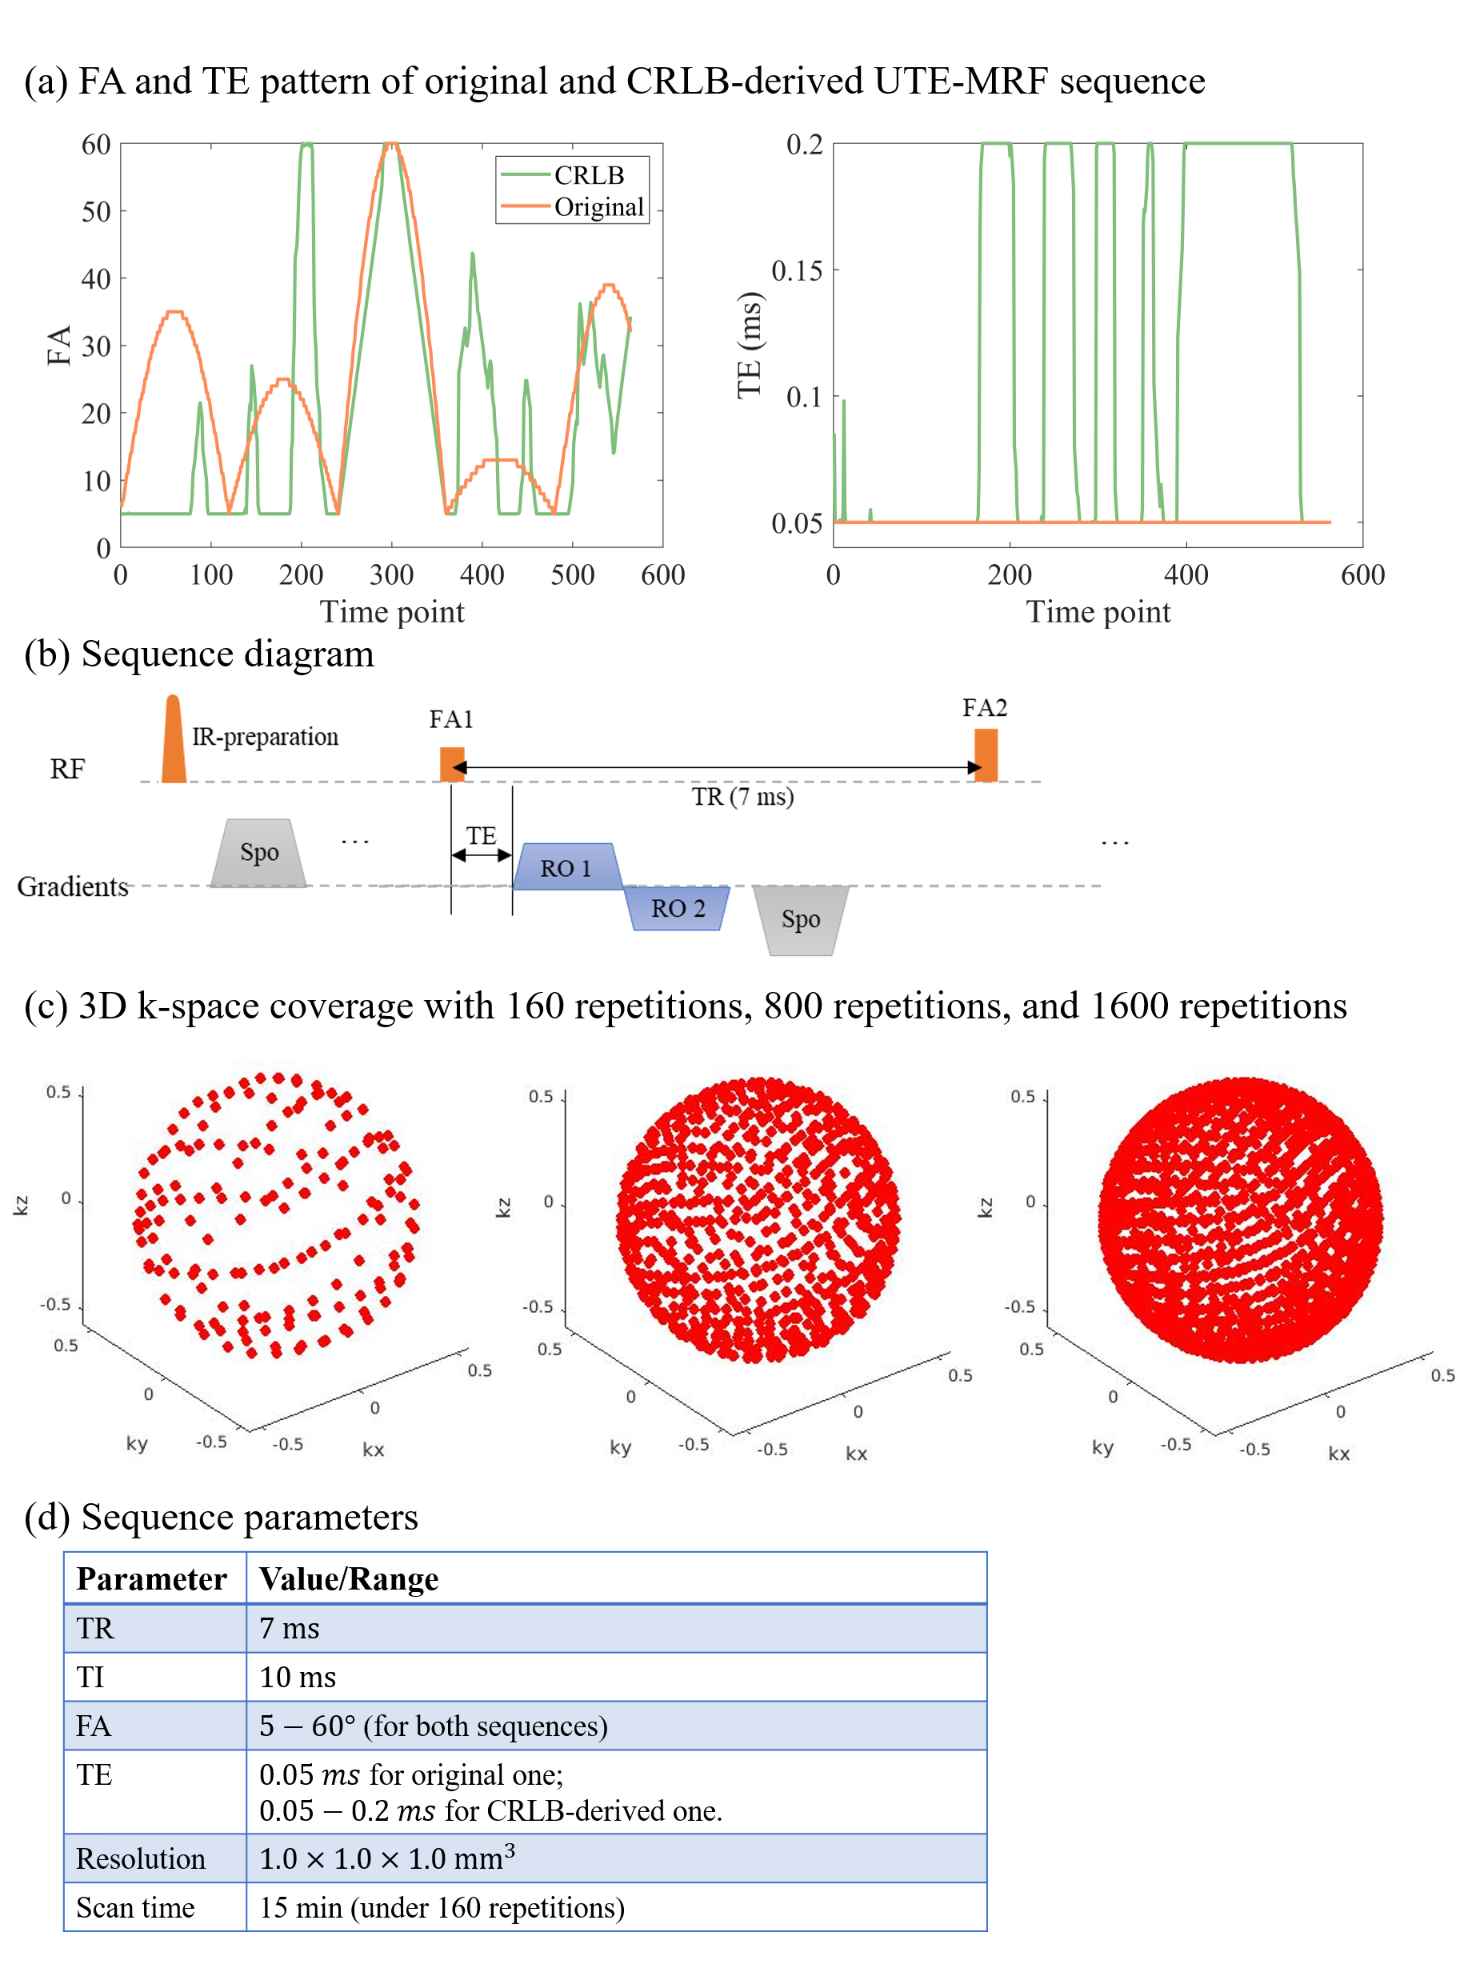
Fig.2. Sequence diagram of original UTE-MRF and CRLB-derived UTE-MRF. (a) Flip angle (FA) and TE pattern of two sequences. (b) sequence diagram in a TR. (c) shows the 3D k-space coverage of frame 1 using a 2D golden angle method under repetition of 160, 800 and 1600. (d) shows other sequence parameters.
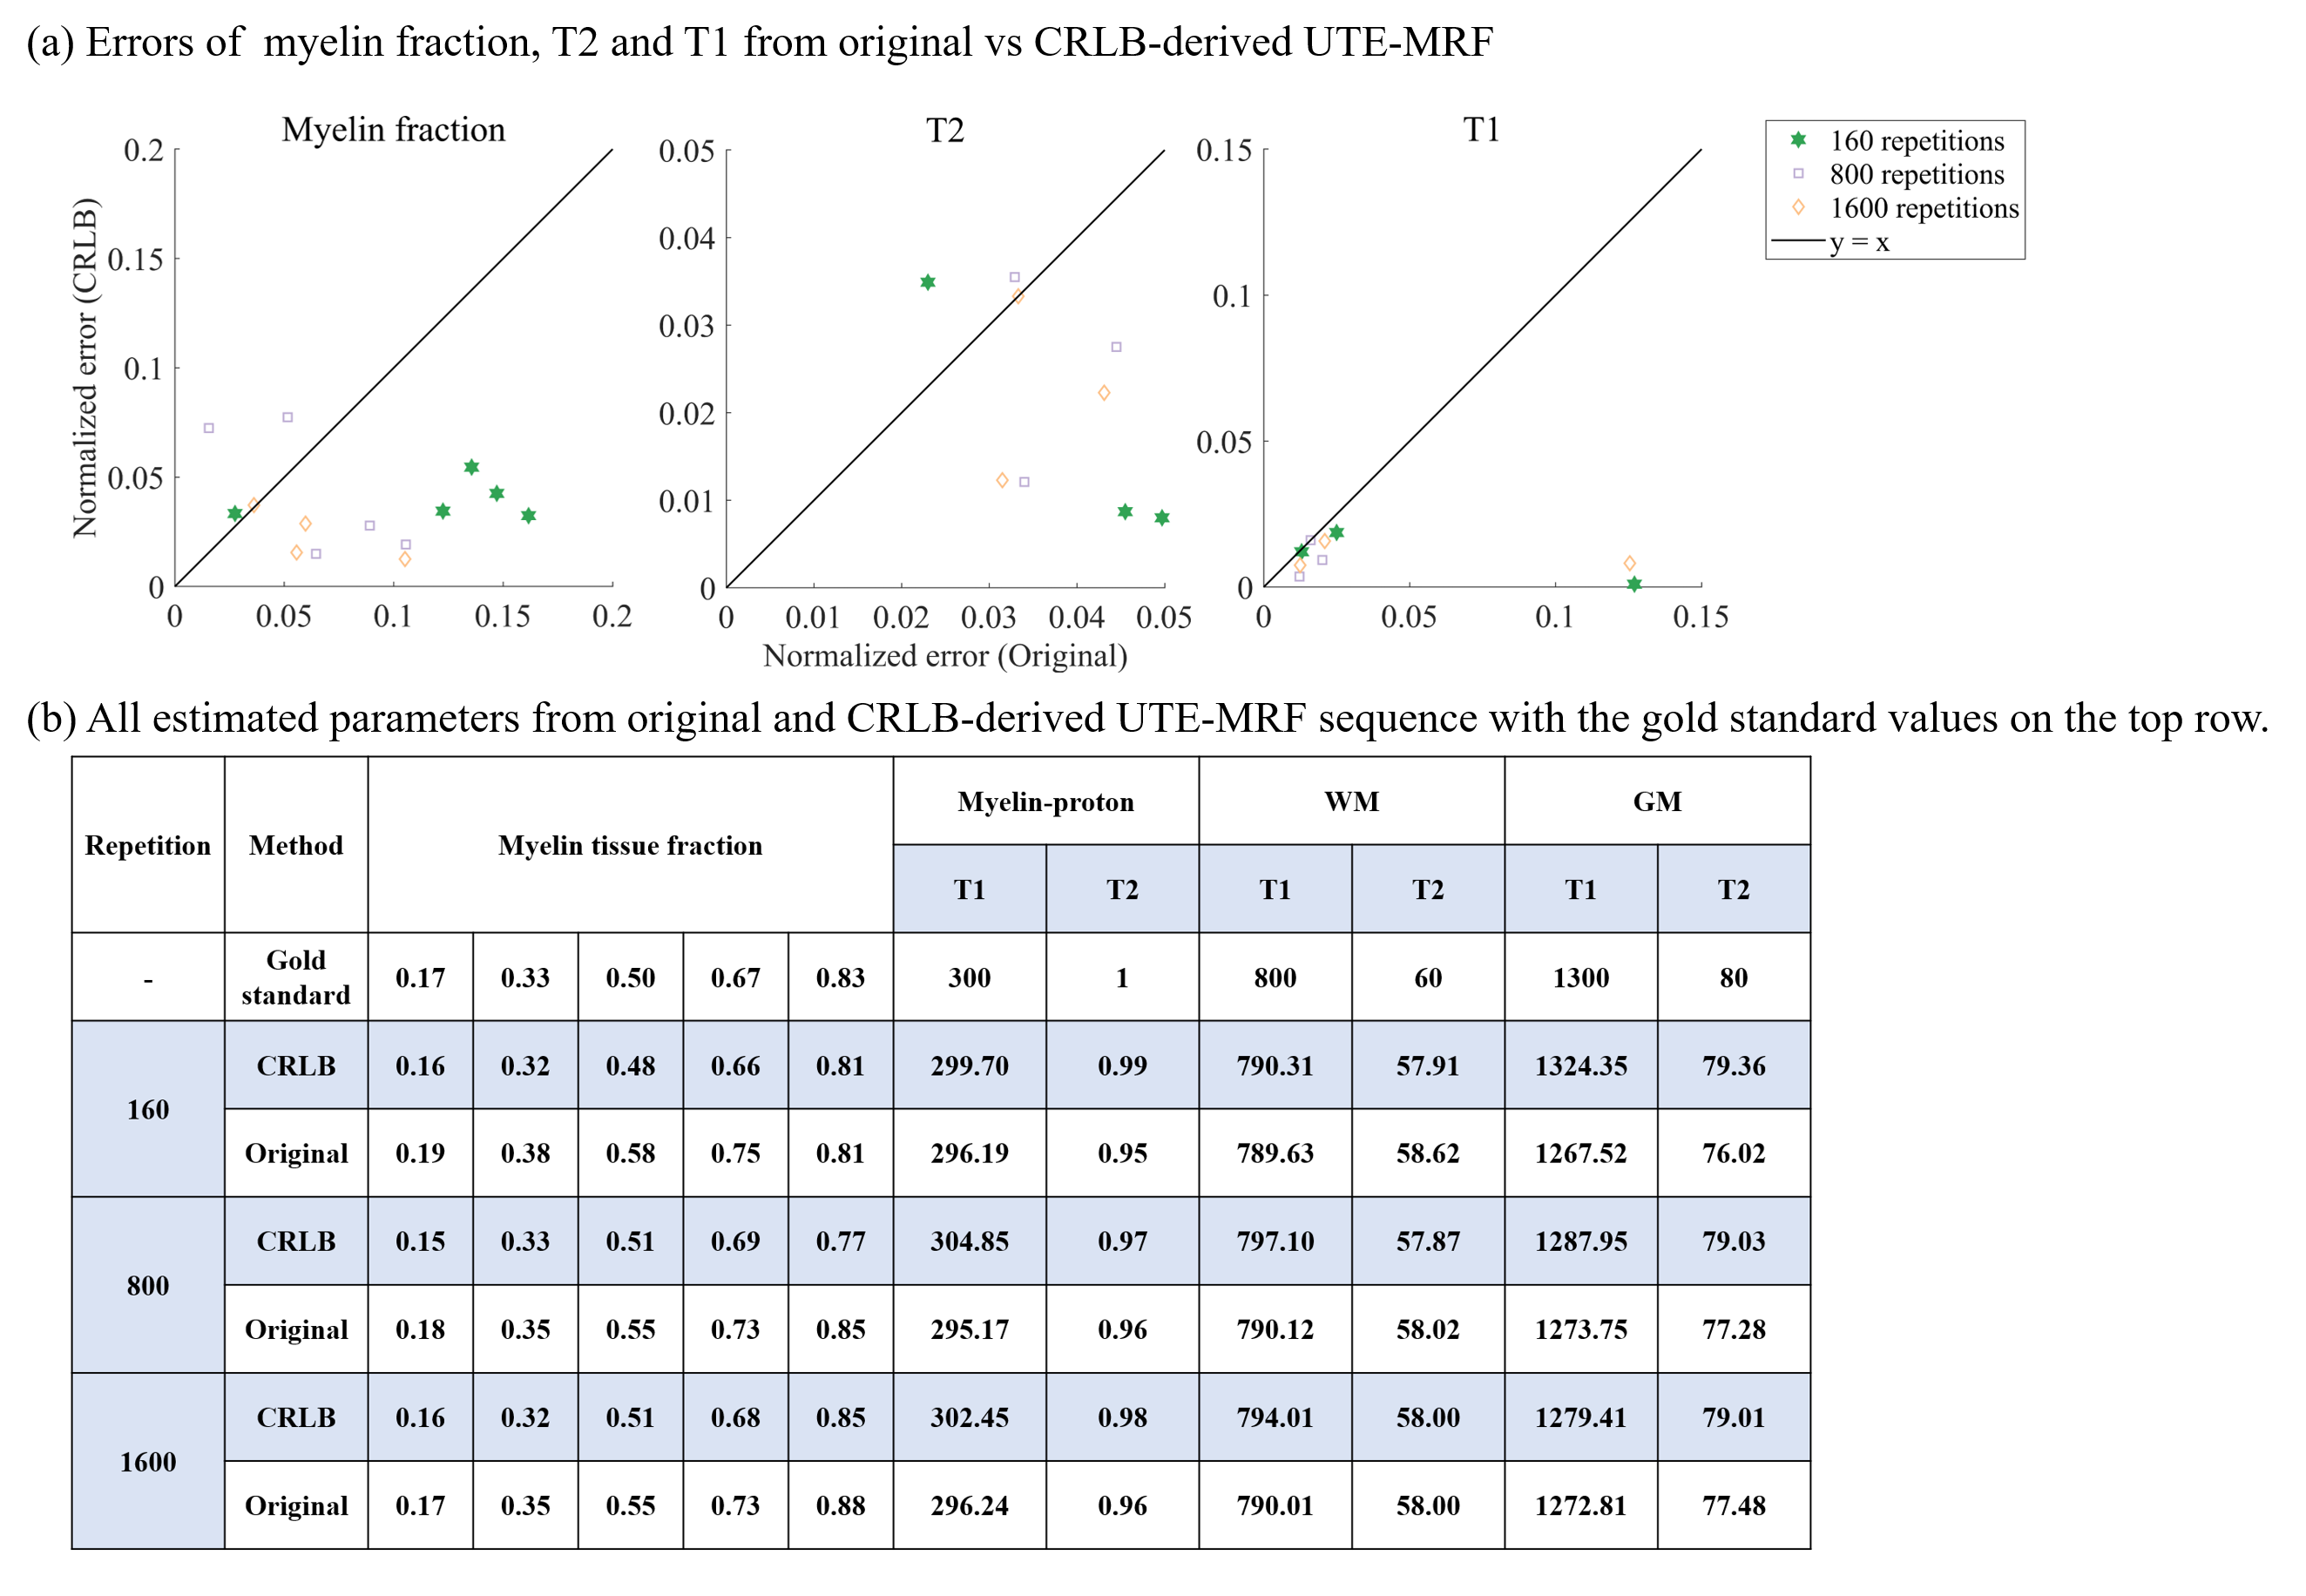
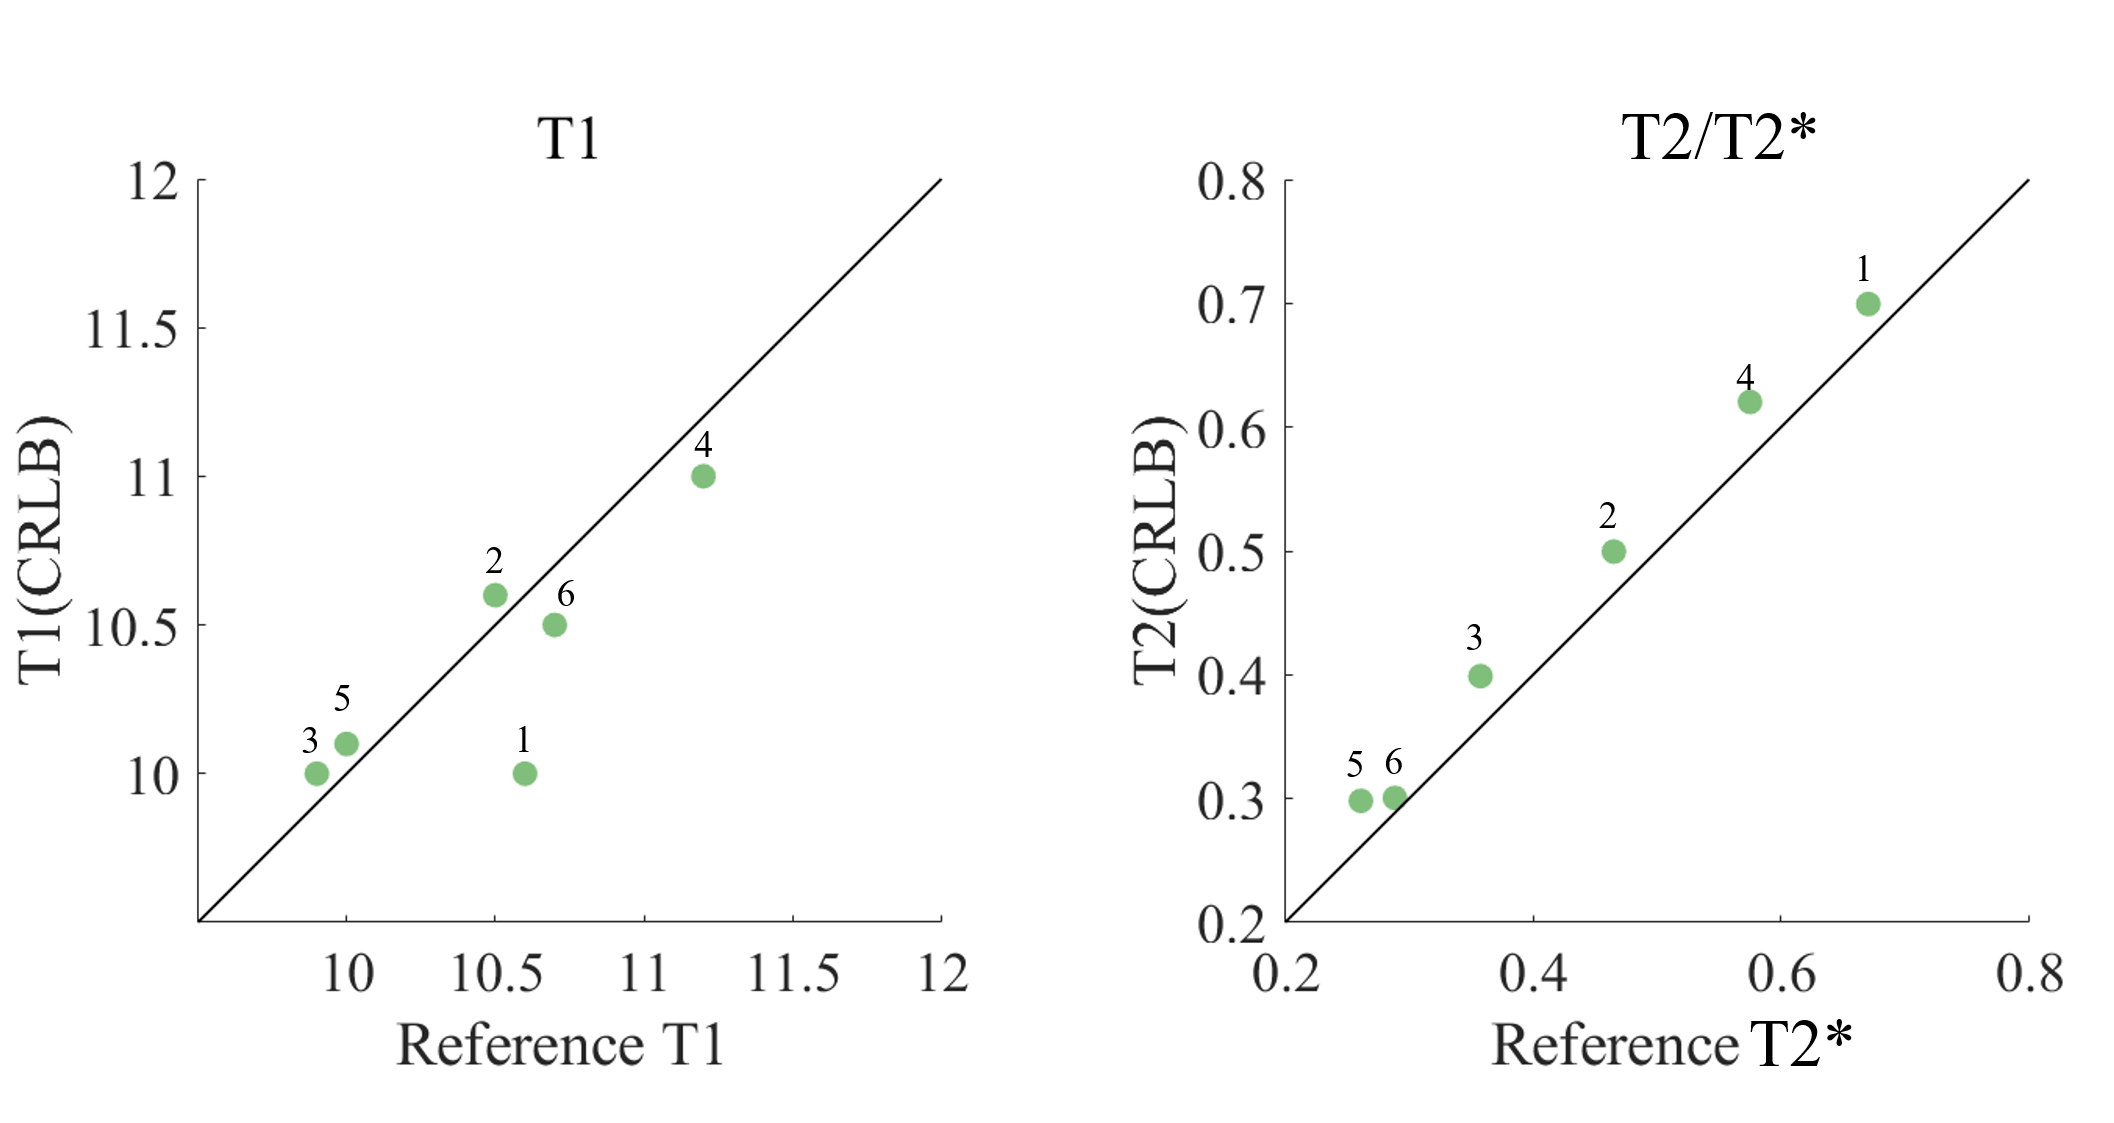
Fig.4. Phantom results: comparisons of T1 and T2/T2* quantifications of 6 phantoms between CRLB-derived UTE‐MRF and reference values.

Fig.5. In vivo results. The first column of each subject is the T1 mapping from UTE-MRF sequence, with the second and the third column being the long T2 WM fraction and myelin-proton fraction in WM.