3824
Whole-Brain 3D CMRO2 Mapping with Prior-Guided Quantitative BOLD1Electronics Engineering, Kyungpook National University, Daegu, Korea, Republic of, 2Radiology, University of Pennsylvania, Philadelphia, PA, United States
Synopsis
qBOLD permits noninvasive measurements of the two critical determinants of the BOLD signal, i.e., deoxygenated-blood-volume (DBV) and venous-oxygen-saturation-level (Yv), and along with CBF imaging, the cerebral metabolic rate of oxygen (CMRO2). Two major challenges in qBOLD are 1) separation of heme-originated R2′ from other signal sources, and 2) subsequent extraction of DBV and Yv. We had previously addressed these issues by developing a prior-guided qBOLD method. Here, we aimed to evaluate the method's utility in 3D CMRO2 mapping. Results suggest feasibility of the new qBOLD method as a practical means for measuring neurometabolic parameters over an extended brain coverage.
Introduction
Quantitative BOLD MRI1,2 permits noninvasive evaluation of hemodynamic and metabolic states of the brain by quantifying parametric maps of deoxygenated blood volume (DBV) and hemoglobin oxygen saturation level of venous blood (Yv), and along with a measurement of cerebral blood flow (CBF), the cerebral metabolic rate of oxygen (CMRO2). One major challenge in qBOLD is to separate deoxyhemoglobin’s contribution to R2′ from other sources modulating the voxel signal, for instance, R2, R2′ from non-heme iron (R2′,nh), and macroscopic magnetic field variations. Further, even with successful separation of the several confounders, it is still challenging to extract DBV and Yv from the heme-originated R2′ because of limited sensitivity of the qBOLD model3. To address these issues, we had previously proposed a prior-guided 3D qBOLD method4 in which a R2′-sensitive, steady-state 3D pulse sequence (termed ‘AUSFIDE’)5 is employed for data acquisition, while a constrained qBOLD problem is solved using a plurality of preliminary parameters (R2, R2′, ΔB0, and voxel susceptibility (Δχ)) obtained via AUSFIDE, along with additionally measured cerebral venous blood volume (CBVv). It was shown that the method properly disentangled the above-mentioned confounding factors, and yielded the expected contrast for both Yv and DBV maps across the entire brain5. The purpose of this work was to evaluate feasibility of the new qBOLD method in 3D whole-brain CMRO2 mapping.Methods
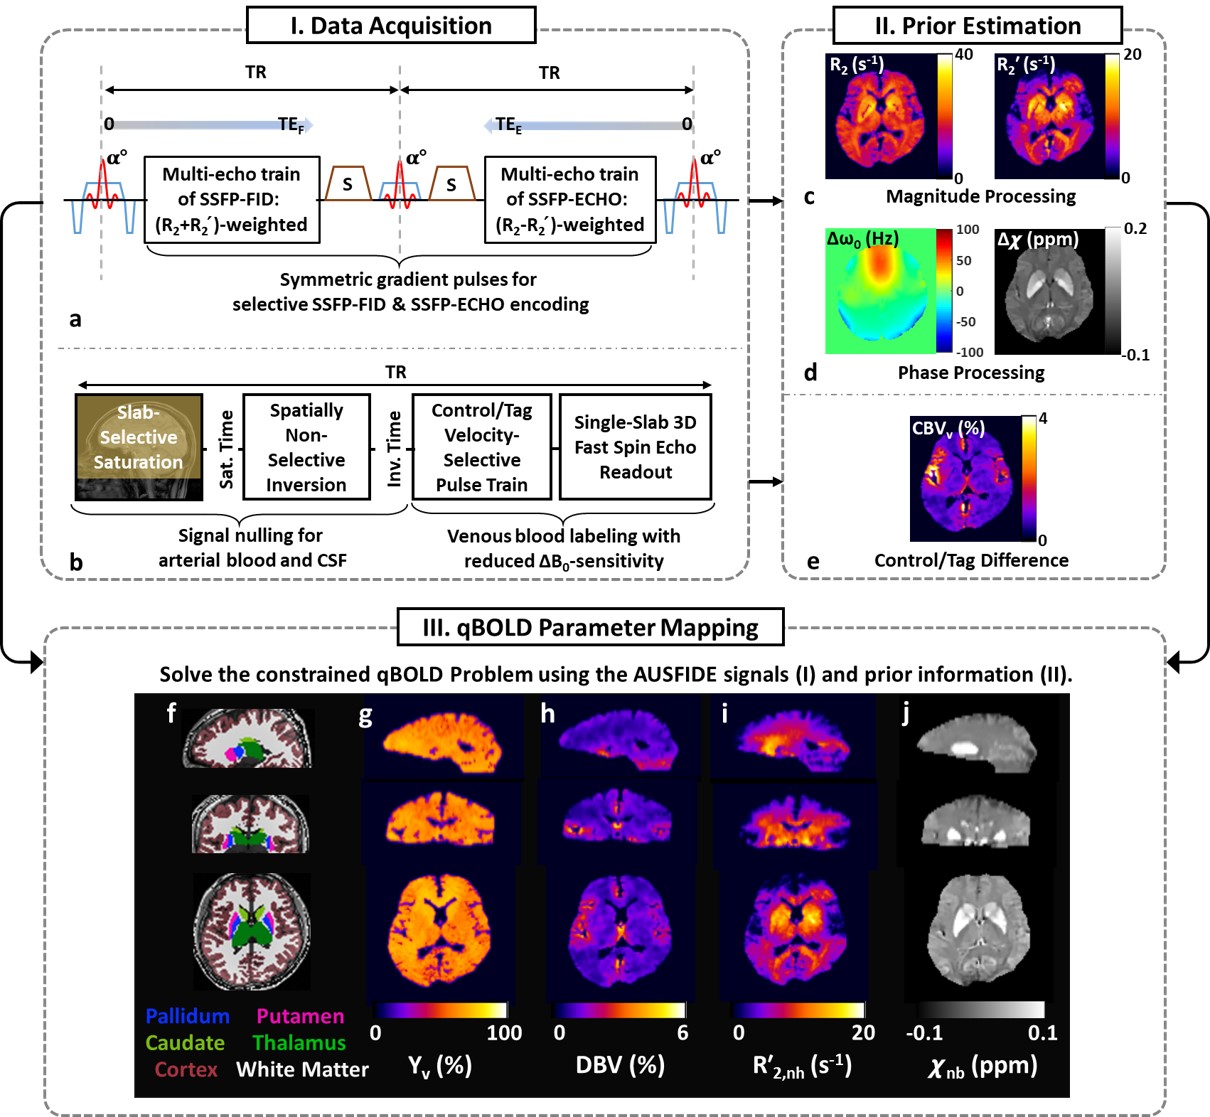
Constrained qBOLD mapping: The 3D qBOLD protocol in this study consists of two pulse sequences: AUSFIDE5 (Fig. 1a) yielding a set of volumetric maps (R2, R2′, ΔB0, and Δχ; Figs. 1c, 1d), and additionally velocity-selective venous-spin-labeling (VS-VSL)6 (Fig. 1b) leading to voxel-wise CBVv estimates (Fig. 1e) across the entire brain. The AUSFIDE-derived parameters employed to serve as preliminary estimates in solving the following problem:$$min_\mathbf{\theta}\sum_{TE}|\textbf{y}(TE)-\mathbf{\Xi}(\mathbf{\theta},TE)|^2 + w|\Delta\chi-\Psi(\mathbf{\theta})|^2+p|{R_2}'-\mathbf{\Gamma}(\mathbf{\theta})|^2$$
where $$$\mathbf{\theta} = \{Y_v, DBV, R'_{2,nh}, \chi_{nb}\}$$$ is the set of unknown parameters. Definitions for the models, Ξ, Ψ, and Γ, along with sub-parameters therein are provided in Reference 4. In solving the above equation, VS-VSL-derived CBVv maps were employed to initialize and constrain the solution of DBV. The regularization parameters w and p were empirically determined to 10 and 0.1, respectively. Resultant parametric maps are shown in Figs. 1g-1j.
Whole-brain 3D CMRO2 mapping: 3D pseudo-continuous arterial spin labeling (pCASL) with stack-of-spirals readout7 was employed for CBF imaging. Control and tag pCASL images were realigned to the proton-density image acquired prior to the actual pCASL data collection using SPM12, and their pair-wise difference was averaged over multiple measurements, yielding ∆SI and subsequently CBF maps8. Given the CBF measurements along with qBOLD-derived Yv across the entire brain, 3D CMRO2 maps were computed using the following equation:
$$CMRO_2 = C_a \cdot CBF \cdot (Y_a - Y_v)$$
Here, Ca is the oxygen carrying capacity of arterial blood and Ya is the hemoglobin oxygen saturation of arterial blood.
Experiments & data processing: Experiments were performed at 3T (Siemens Prisma) in seven healthy subjects using AUSFIDE, VS-VSL, and 3D pCASL. See References 5 and 6 for imaging parameters and data processing procedures for AUSFIDE and VS-VSL, respectively. Imaging parameters in 3D pCASL were: FOV=240x240x120mm3, matrix size=64x64x32, slice partial Fourier factor=6/8, labeling duration=1.8seconds, post labeling delay=1.5seconds, TR=4seconds, measurements=15 control/tag pairs, and scan time=4.5minutes. Additional data were collected using high-resolution MP-RAGE and T2-relaxation under spin tagging (TRUST)9 for brain segmentation and global Yv measurements. Whole-brain 3D maps of Yv, CBF, and CMRO2 in two representative subjects were presented in sagittal, coronal, and axial orientations. Regional averages of CBF and CMRO2 were calculated in gray and white matter, along with whole-brain averages of Yv obtained using the present qBOLD and TRUST.
Results
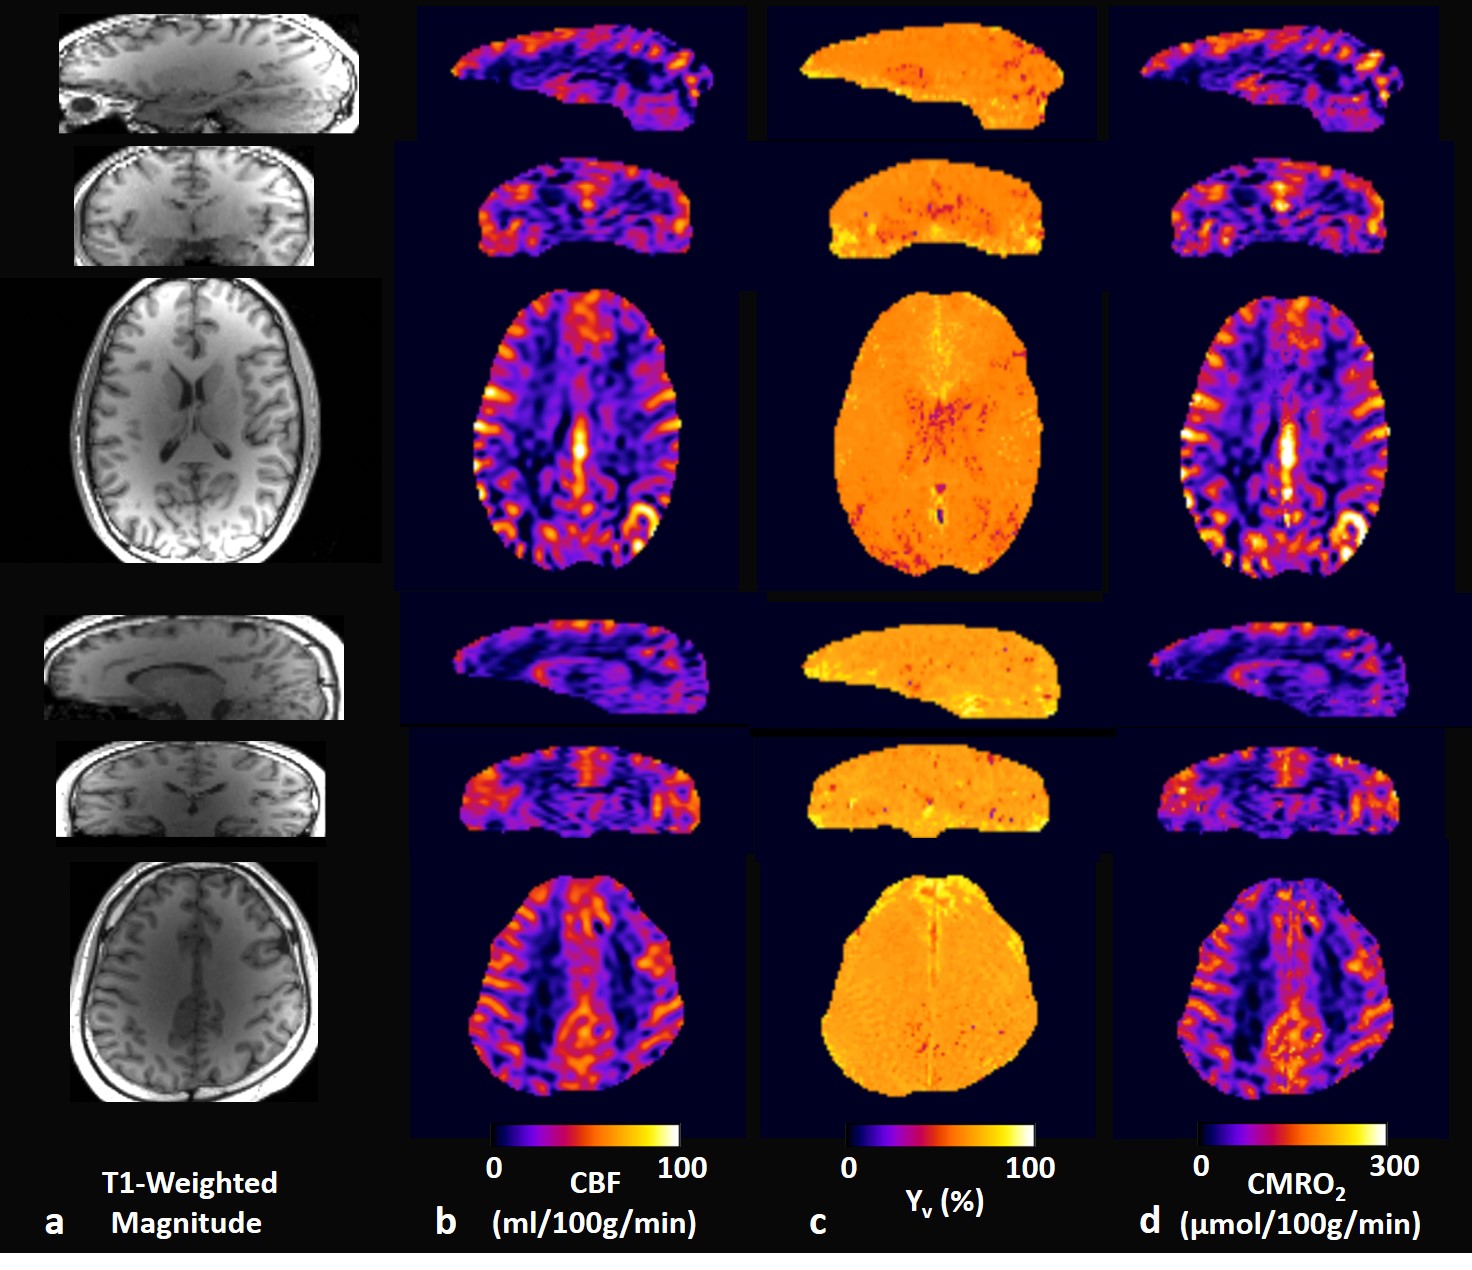
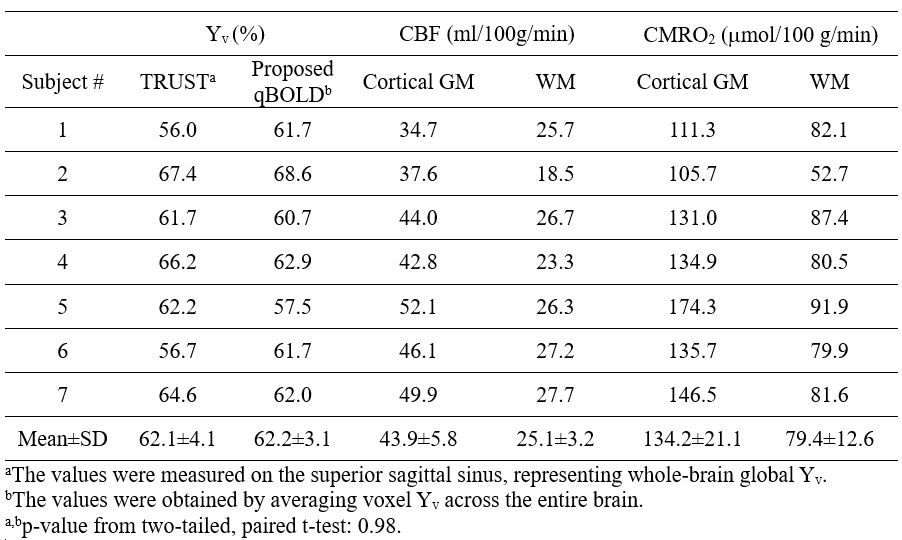
Figure 2 displays whole-brain 3D images in the three orthogonal planes in two study subjects: T1-weighted magnitude (Fig. 2a), and CBF (Fig. 2b), Yv (Fig. 2c), and CMRO2 (Fig. 2d) maps. Consistent with the results in our previous study4, Yv obtained using the proposed qBOLD method is largely invariable across the entire brain. In contrast, CBF maps highlight GM/WM differences, thereby contributing predominantly to the contrast of the derived CMRO2 maps. Table 1 compares TRUST’s global Yv against the proposed method’s Yv averaged across the entire brain voxels in the seven study volunteers, and summarizes individual averages of both CBF and CMRO2 estimates in cortical GM and WM regions, respectively. Two-tailed, paired t-test suggests that the difference of whole-brain average Yv values in TRUST and the proposed method is not statistically significant (p = 0.98).Discussion and Conclusions
We introduce a new, MRI-based, regional oximetry technique by means of 3D constrained qBOLD parameter mapping. At the core of the present qBOLD method is the AUSFIDE pulse sequence that enables rapid, high-resolution 3D scanning for the full brain while providing prior information of voxel-averaged magnetic susceptibility (Δχ) and associated parameters at different scales (R2, R2′, ΔB0), which is difficult to achieve with the currently practiced qBOLD techniques. In combination with CBF imaging, the new qBOLD method achieves 3D full-brain CMRO2 mapping with the expected contrast as well as measurement values in good agreement with those reported in literature. The present 3D MRI oximetry protocol may find a range of clinical applications where tissue oxygen metabolism is regionally altered, for example, in diseases resulting from arterial stenosis/occlusion.Acknowledgements
NIH grant P41-EB029460 and NRF 2021R1F1A1045621References
1. An HY, Lin WL. Quantitative measurements of cerebral blood oxygen saturation using magnetic resonance imaging. J Cereb Blood Flow Metab 2000; 20:1225-1236.
2. He X, Yablonskiy DA. Quantitative BOLD: mapping of human cerebral deoxygenated blood volume and oxygen extraction fraction: default state. Magn Reson Med. 2007;57:115-126.
3. Lee H, Englund EK, Wehrli FW. Interleaved quantitative BOLD: Combining extravascular R2’- and intravascular R2-measurements for estimation of deoxygenated blood volume and hemoglobin oxygen saturation. NeuroImage. 2018;174:420-431.
4. Lee H, Wehrli FW. Whole-brain 3D Quantitative BOLD mapping with preliminary estimation of R2’ and venous blood volume. ISMRM 2021
5. Lee H, Wehrli FW. Alternating unbalanced SSFP for 3D R2’ mapping of the human brain. Magn Reson Med. 2021;85:2391-2402.
6. Lee H, Wehrli FW. Venous cerebral blood volume mapping in the whole brain using venous-spin-labeled 3D turbo spin echo. Magn Reson Med. 2020;84:1991-2003.
7. Vidorreta, M., Wang, Z., Rodríguez, I., Pastor, M.A., Detre, J.A., Fernández-Seara, M.A., 2013. Comparison of 2D and 3D single-shot ASL perfusion fMRI sequences. Neuroimage 66, 662-671.
8. Alsop, D.C., Detre, J.A., Golay, X., Günther, M., Hendrikse, J., Hernandez‐Garcia, L., Lu, H., MacIntosh, B.J., Parkes, L.M., Smits, M., 2015. Recommended implementation of arterial spin‐labeled perfusion MRI for clinical applications: a consensus of the ISMRM perfusion study group and the European consortium for ASL in dementia. Magnetic resonance in medicine 73, 102-116
9. Lu, H., Ge, Y., 2008. Quantitative evaluation of oxygenation in venous vessels using T2‐relaxation‐under‐spin‐tagging MRI. Magnetic resonance in medicine 60, 357-363.
Figures