3823
Enhancing Analysis Algorithm for T2-based water suppressed diffusion MRI (T2wsup-dMRI) by adding least-square fitting1Radiological Science, Shizuoka College of Medical care Science, Hamamatsu, Japan
Synopsis
A T2-based water suppressed diffusion MRI (T2wsup-dMRI) was proposed to solve the CSF partial volume effects (CSF-PVE) in quantifying several parameters in tissue. There a simple closed form (CF) algorithm was used but errors were increased when tissue T2, T2t is long (> 100ms). In this study, to reduce those errors, several algorithms using least-squares (LSQ) fitting method were assessed by simulation and in vivo data. Through this study, the combined algorithm of single and bi-exponential LSQ applied in 2D (TE, b) space is the best in keeping those accuracies especially when applied in random data pattern.
Introduction
In diffusion MRI (dMRI), it is very important to suppress CSF because the quantitative parameter maps are affected by a partial volume effects (PVE).1 To solve the problem, a new diffusion MRI (dMRI) technique named T2-based water suppressed diffusion MRI (T2wsup-dMRI)2 was proposed based on the T2wsup FSE synthetic MRI3. There a simple closed form (CF) algorithm with minimum data points to calculate 4 unknown parameters in a two-compartment model. This method can keep tissue SNR for standard dMRI, however, there were limitations to obtain the correct parameters when the tissue T2 (T2t) is close to the selected TE (TElong) regarded as water-signal dominant.In this study, we proposed a modified algorithm to reduce the errors in those conditions and compared those.
Methods
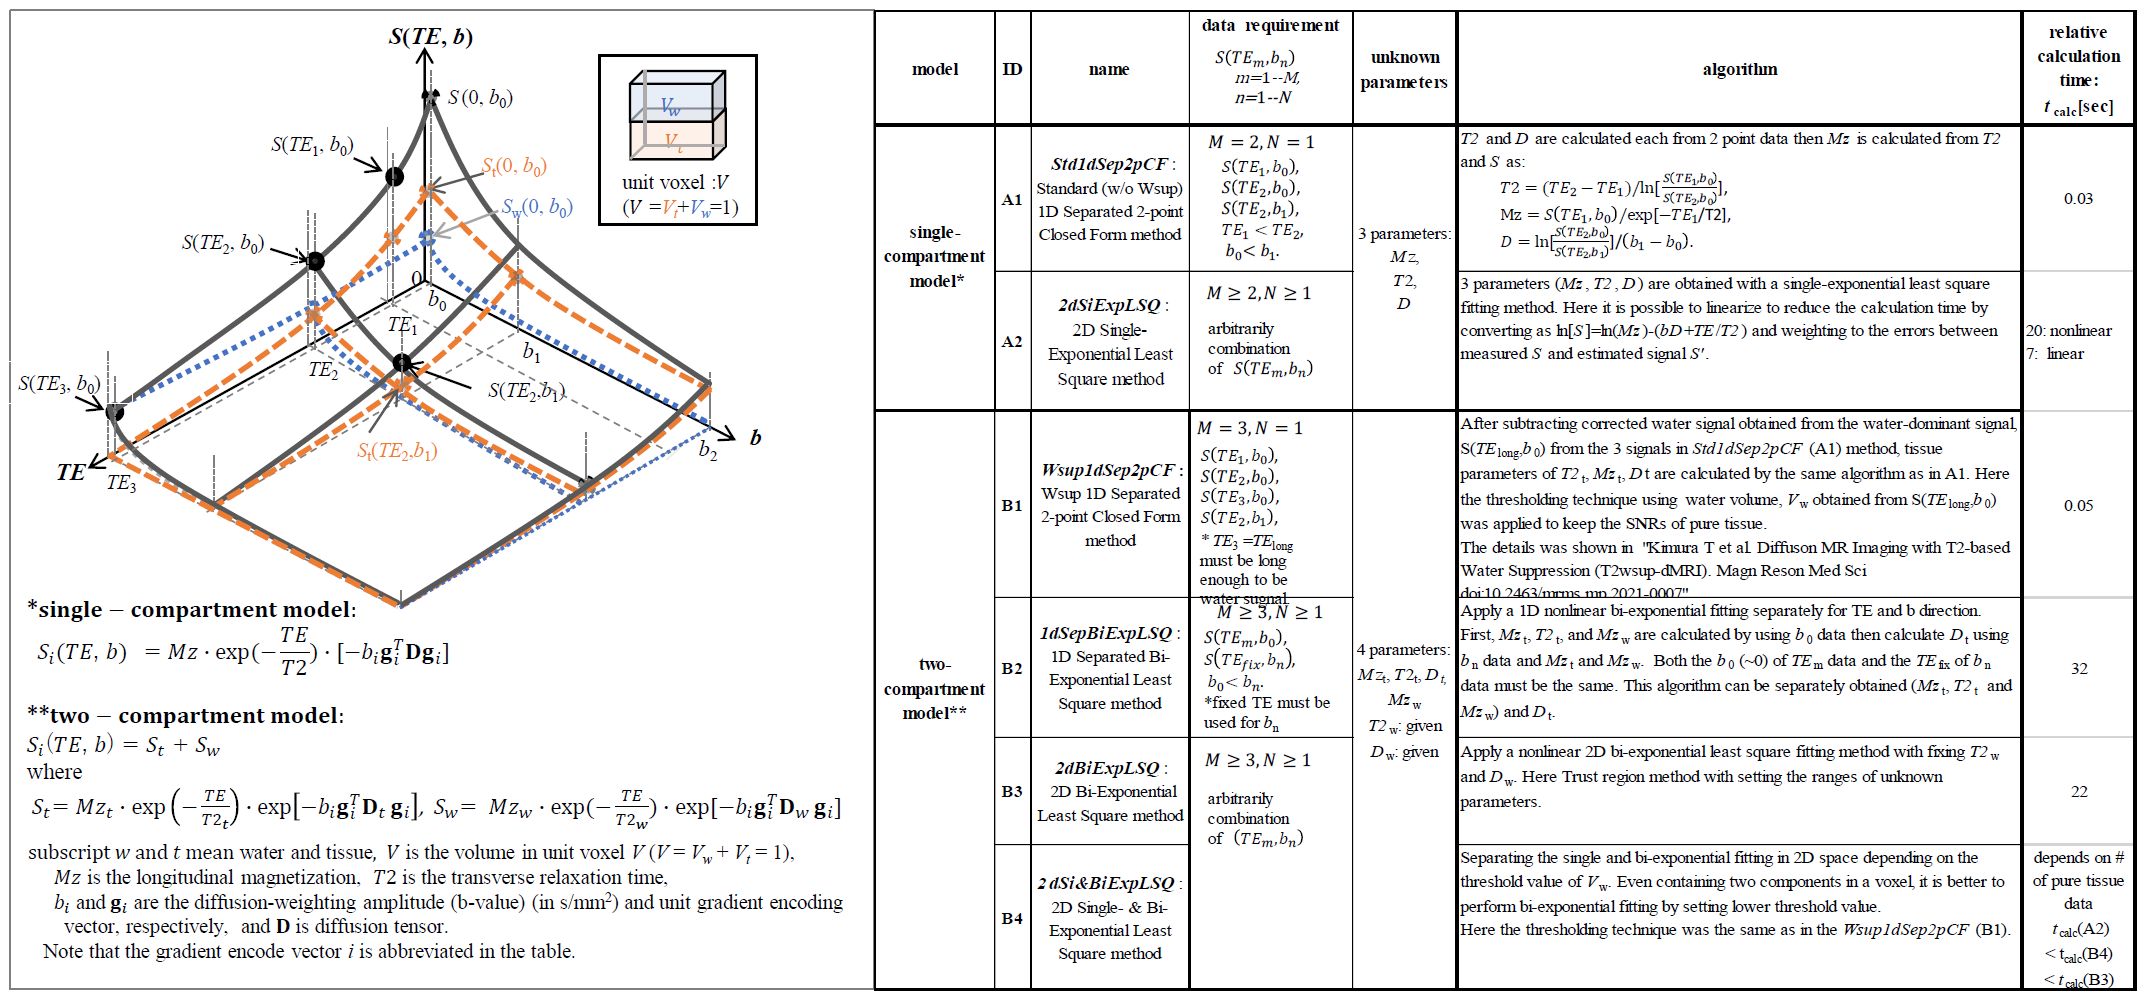
Analysis methodFollowing algorithms were assessed here:
A. single-compartment model base
A1.Standard (w/o Wsup) 1D Separated 2-point Closed form (Std1dSep2pCF)
A2. 2D Single-Exponential least square (2dSiExpLSQ)
B. two-compartment model base
B1. Wsup 1D Separated 2-point Closed form (Wsup1dSep2pCF)1
B2. 1D Separated Bi-exponential east square (1dSepBiExpLSQ)
B3. 2D Bi-Exponential least square (2dBiExpLSQ)
B4. 2D Single & Bi Exponential least square (2dSi&BiExpLSQ)
Those details are shown in Fig. 1. For 1D- and 2D- LSQ algorithm, a trust-region nonlinear least square algorithm with a function “fit” in Matlab R2018a (Mathworks corp.) was used. In a single-compartment model based algorithm, 3 parameters (Mz, T2, D) in a voxel were calculated; and in a two-compartment model based algorithm, 3 tissue parameters (Mzt, T2t, Dt ) and 1 water parameter (Mzw) were calculated with fixing the two water parameters of T2w and Dw.
Data pattern
Signal data in (TE, b) space were defined as , m=1--M, n=1—N.
1) T-pattern: Here the standard pattern that all TEs are the same for all b>0 data are named “T-pattern”. This pattern is available for the all algorithms but CF algorithm of A1 and B1 can only be applied to the minimum data points of M+N=4(3+1) but the other LSQ algorithms (A2, B2-B4) can be applied to the patterns of M>3 and N>1.
2) 2D random: Only the 2D-LSQ (A2, B3, and B4 ) can be applied to this pattern. Those detailed data patterns used here were shown in Fig. 2 - Fig. 4.
Simulation study
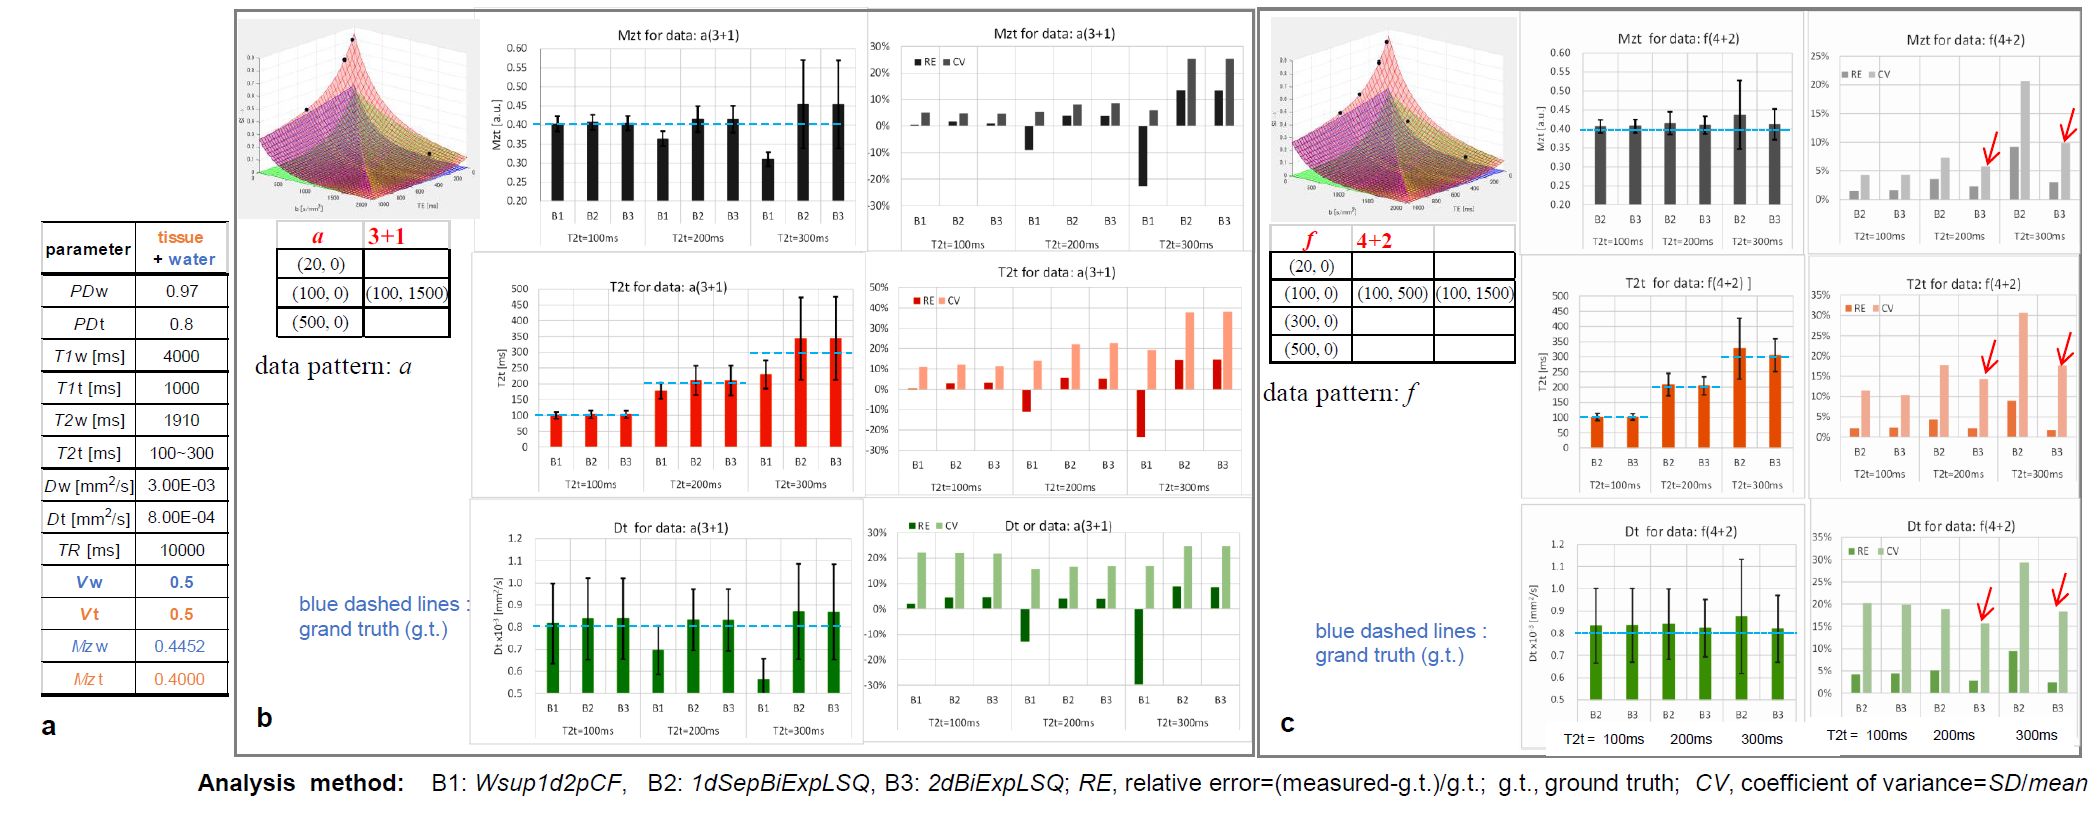
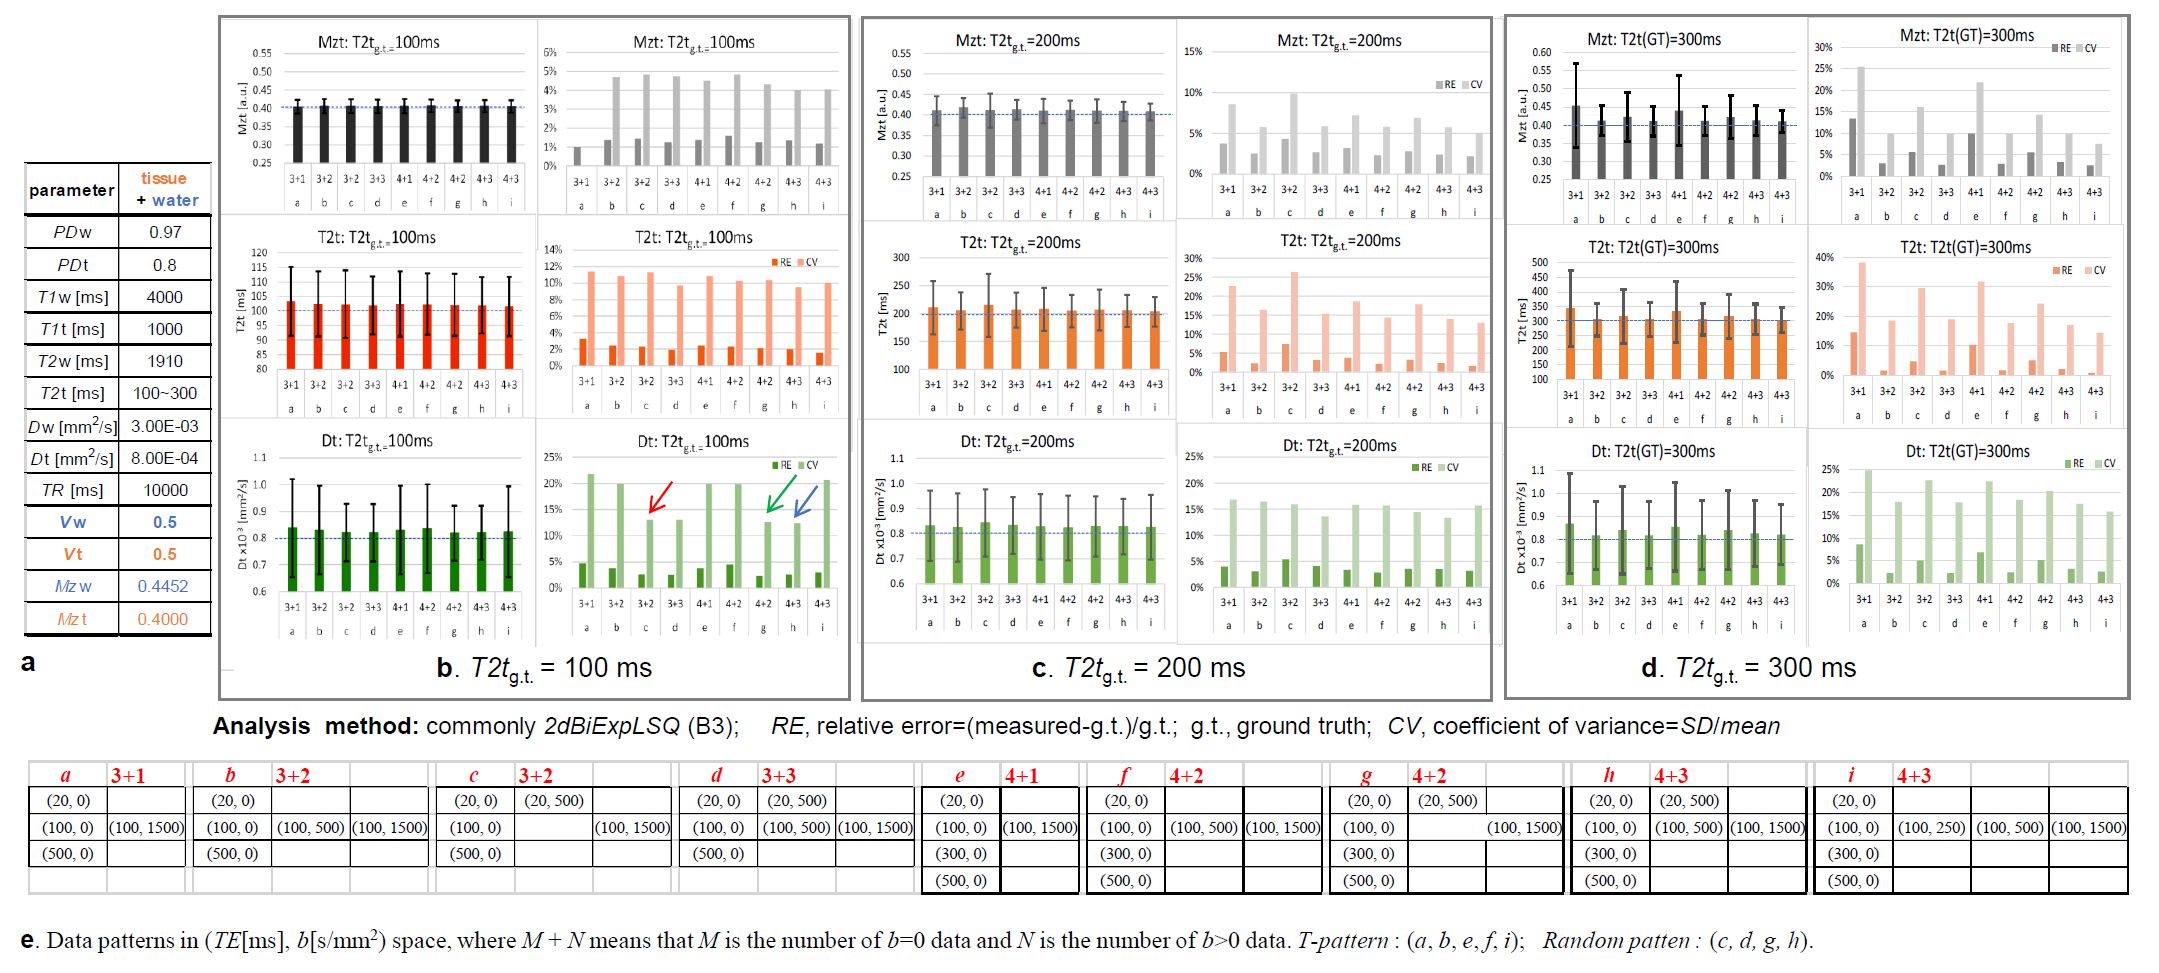
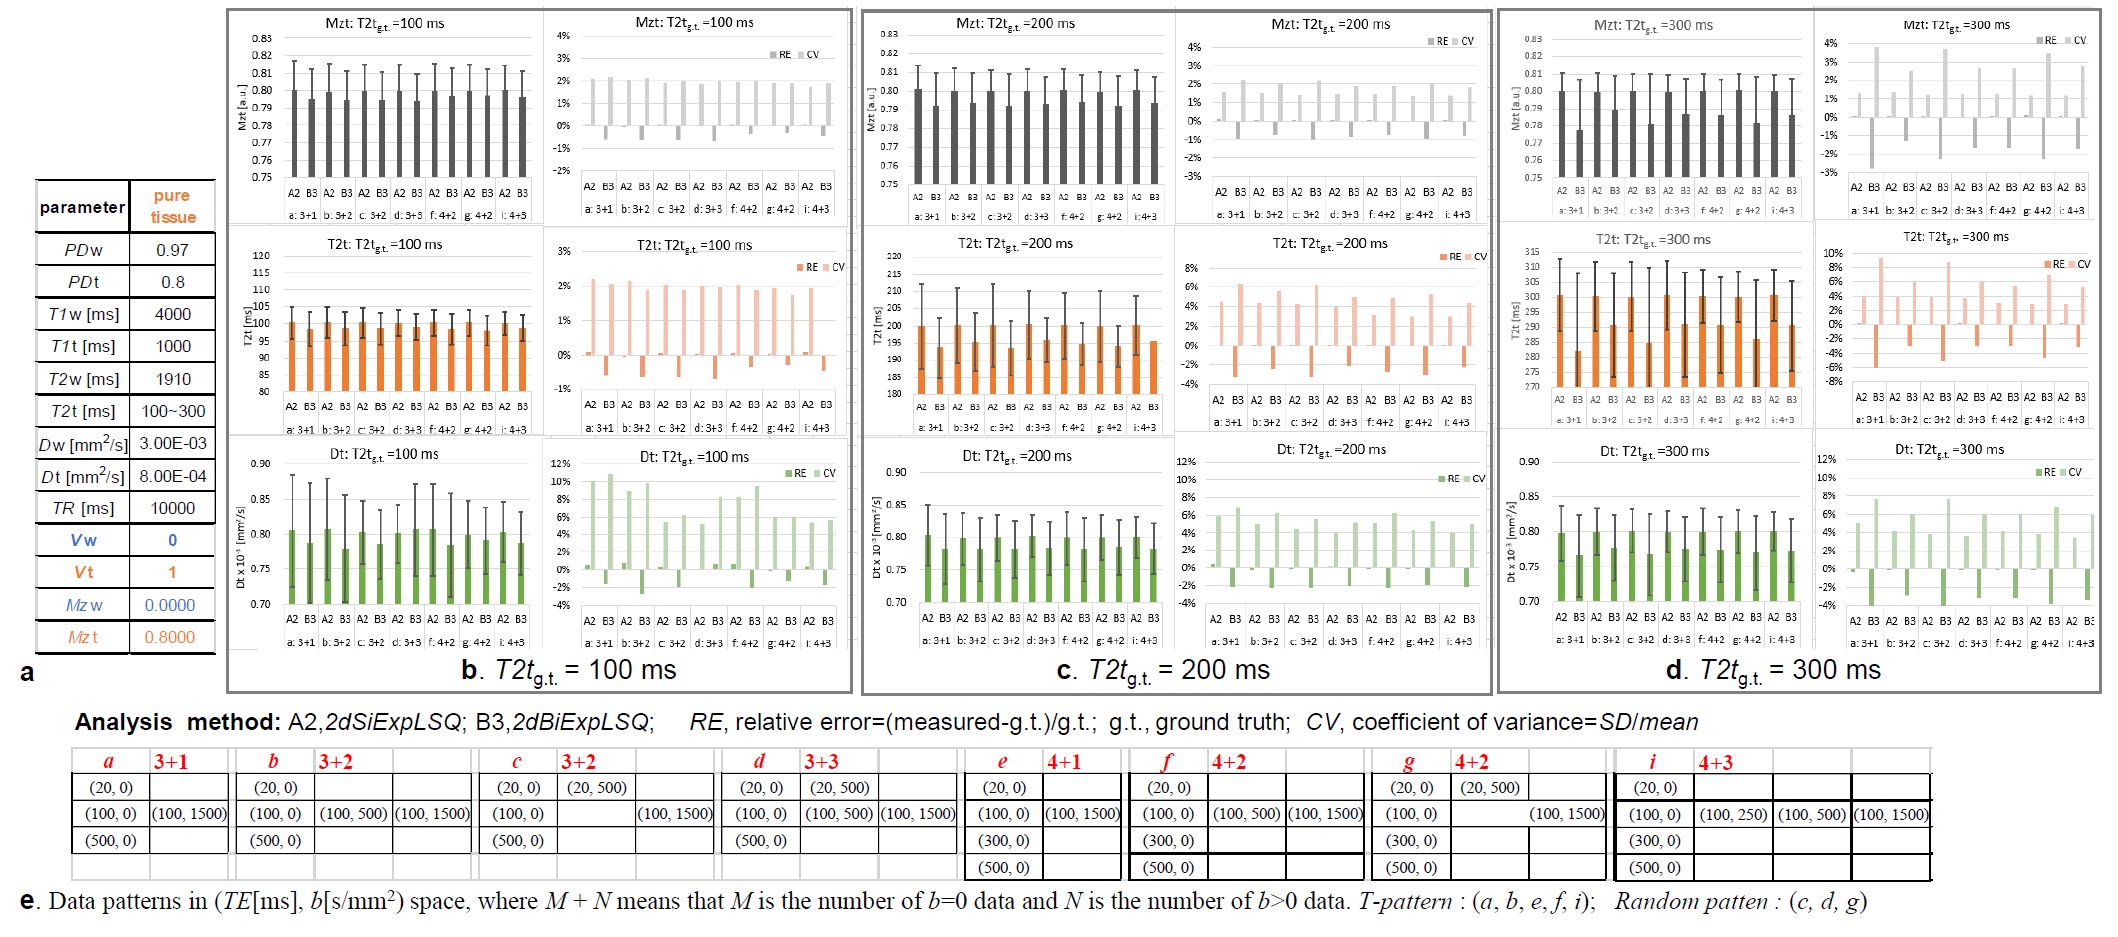
Two cases assuming a) CSF-PVE(tissue +water) (Vw =0.5), and b) pure tissue (Vw =0) were assessed, each with T2t=100, 200, and 300 ms, and maximum TE was 500 ms. Noise added simulations were performed. Gaussian noises of σ=0.01 were added to the signals then took absolute values. After the trials of each 1000 times, the mean and standard deviation (SD) of tissue parameters were obtained then assessed by a relative error, RE = (measured – g.t.)/g.t., g.t.: ground truth and coefficiemt of variance,CV=SD/mean.
MRI in vivo study
A healthy volunteer data was acquired on 3T MRI after obtaining informed consent. Following EPI-DWI images were acquired with the T-pattern, where the images of b=0 were 1 average and isotropic DWI images with 6-axis MPG were used.
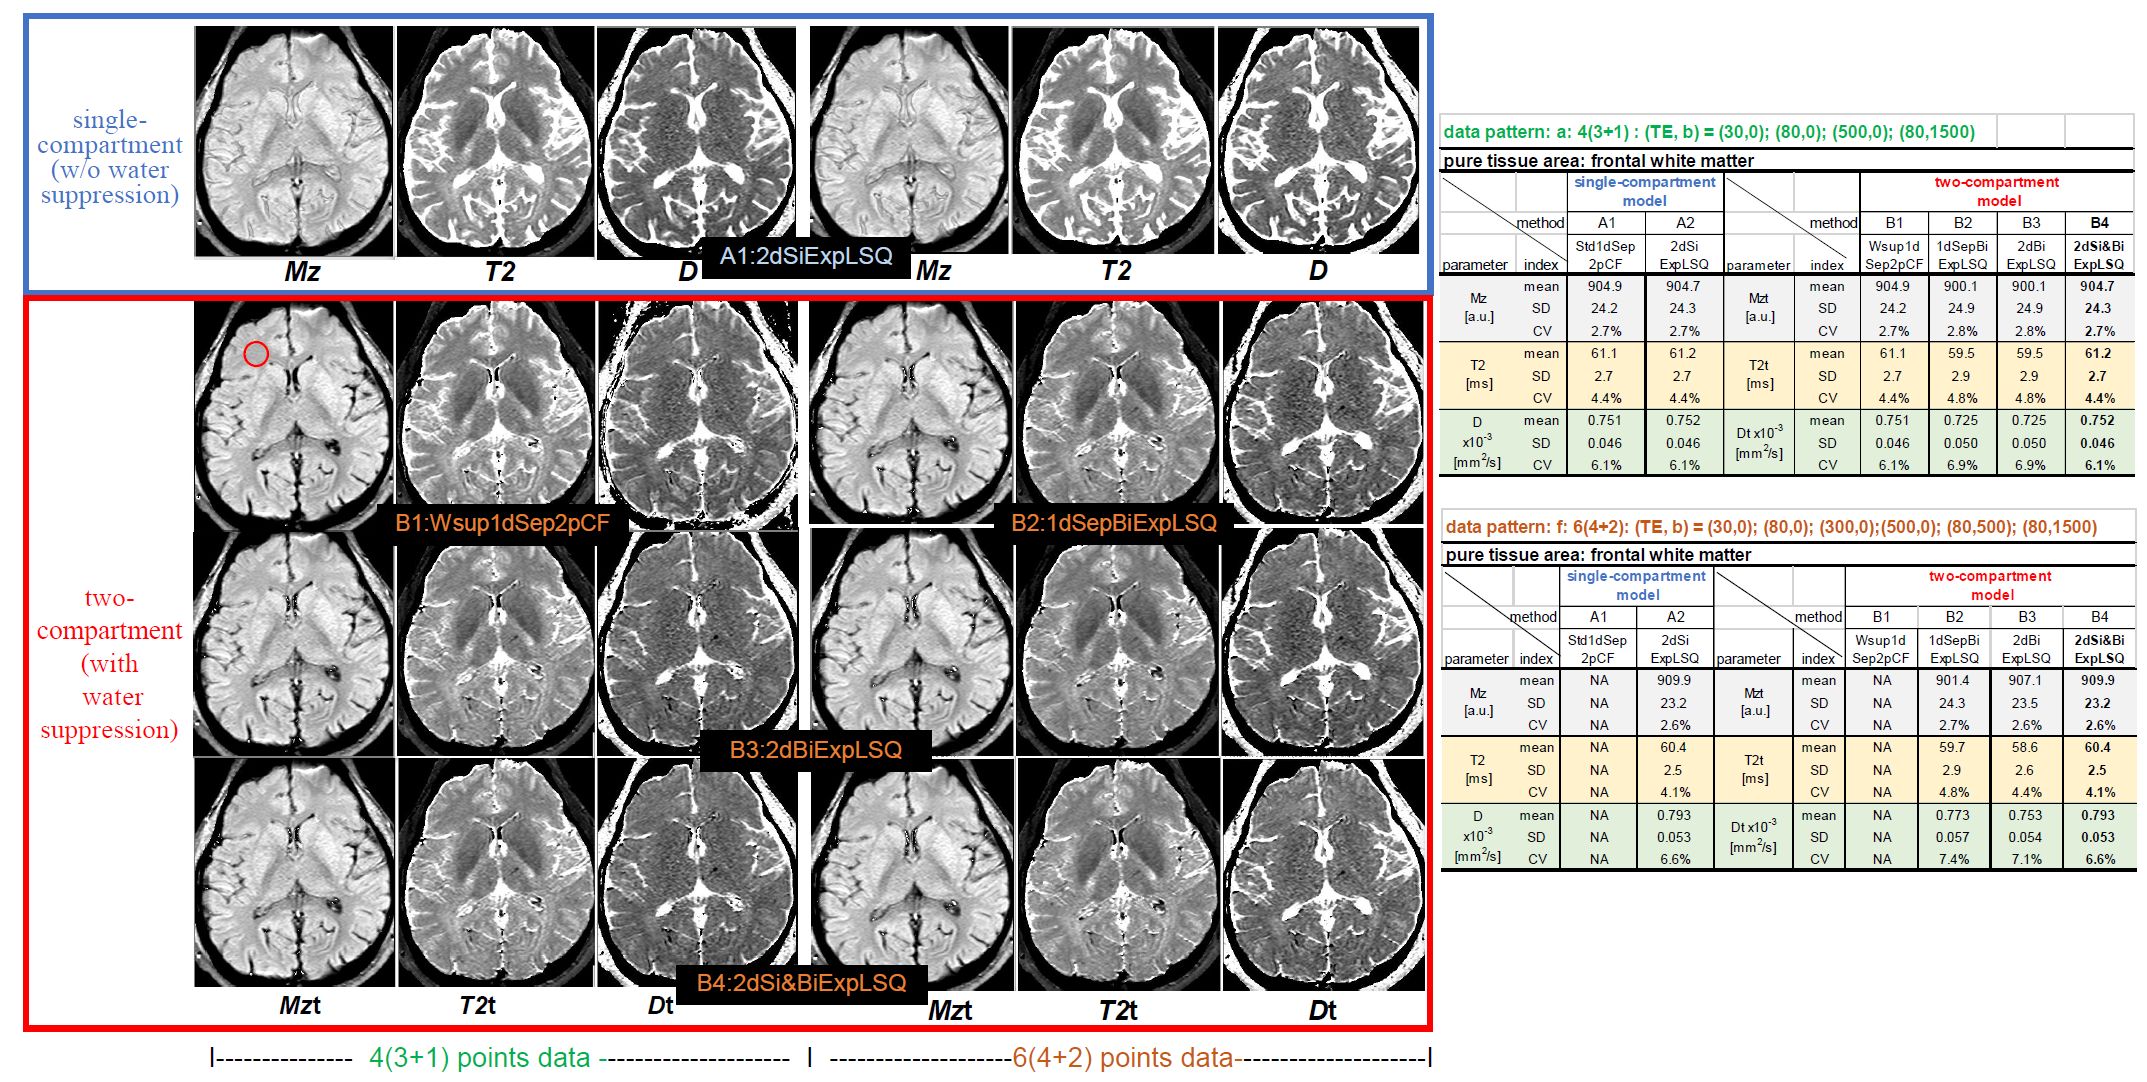
a) M+N =4(3+1) points (minimum): (TE [ms], b [s/mm2]) = (30,0); (80,0); (500,0); (80,1500) ;
b) M+N =6(4+2) points: (TE [ms], b [s/mm2]) = (30,0); (80,0); (300,0); (500,0); (80; 500); (80,1500) .
In each data, quantitative maps were calculated then those ROI values in pure tissue were assessed.
Results
Simulation studyComparing among analysis algorithms for the CSF-PVE (tissue+water) (Vw =0.5) (Fig. 2), the REs of tissue parameters in the WsupSep1d2pCF(B1) were increasing with increasing T2t. In contrast, the REs for 1dSep- and 2d- BiExpLSQ (B2, B3) were smaller but those CVs became greater in long T2t. Furthermore, the 2D-LSQ (B3) provided better results than 1D-LSQ (B2) when increasing the number of data points or T2t.
Comparing among the data patterns with 2dBiExpLSQ for CSF-PVE voxel (Vw=0.5) (Fig. 3), the accuracies became improved with increasing T2t among the same data patterns. In comparison among the T-patterns, even if M is the same, the errors of T2t were reduced with increasing N. Furthermore, the 2D random-patterns provided better results for Dt than the T-patters did.
Comparison between the 2D Single- and Bi- Exp LSQ (A2 and B3) assuming pure tissue of Vw=0 (Fig. 4), the accuracies in the Single-Exp (A2) were better than those in Bi-Exp (B3) when applied in the pure tissue.
MRI in-vivo study
Although in-vivo data were only for 2 types of T-pattern data of healthy volunteer with T2t < 100 ms, similar results as our simulations were obtained (Fig. 5).
DIscussion
Thorough this study in T2wsup-dMRI, the already proposed Wsup1dSep2pCF is practical for minimum data points with T2t <100ms. In LSQ algorithms, 2D-LSQ is better than the 1D-LSQ in the accuracies of quantitative parameters. In addition, the Single-exp LSQ is better than the Bi-exp LSQ in pure tissues. Those combined 2dSi&BiExpLSQ was practically the best especially when applying to long T2t data or the data points are greater than 4 (M+N=3+1), and furthermore, it is expecting to provide better results when applying to the random data patterns of M+N>4 considering the limitations for gradient system, imaging cost.Conclusion
The T2wsup-dMRI in actual clinical use is enhanced by applying an optimal algorithm depending on the tissue T2, the requirements for accuracy and throughput.Acknowledgements
We sincerely thank Yuki Takai, Hiroshi Kusahara, Ryo Shiroishi, and Hitoshi Kanazawa of Canon Medical Systems Corporation for supporting the data acquisition in this study.References
1. Salminen LE, Conturo TE, Bolzenius JD, et al. Reducing CSF Partial Volume Effects to Enhance Diffusion Tensor Imaging Metrics of Brain Microstructure. Technol Innov. 2016; 18:5-20.
2. Kimura T, Yamashita K, Fukatsu K. Diffuson MR Imaging with T2-based Water Suppression (T2wsup-dMRI). Magn Reson Med Sci doi:10.2463/mrms.mp.2021-0007.
3. Kimura T, Yamashita K, Fukatsu K. Synthetic MRI with T2-based Water Suppression to Reduce Hyperintense Artifacts due to CSF. Magn Reson Med Sci 2020; doi:10.2463/mrms.mp.2020-044.
Figures