3821
In Vivo T2* Mapping of Intracranial Atherosclerotic Plaque Distinguishes Symptom-Producing Plaques: a 7T MRI study1Center for Biomedical Imaging Research, School of Medicine, Tsinghua University, Beijing, China, 2Department of Radiology, Beijing Tiantan Hospital, Capital Medical University, Beijing Neurosurgical Institute, Beijing, China, 3Tiantan Neuroimaging Center of Excellence, China National Clinical Research Center for Neurological Diseases, Beijing, China
Synopsis
In vivo quantitative mapping of intracranial atherosclerotic plaque is very important for plaque characterization. Previous intracranial plaque quantitative studies were usually carried out ex vivo, while studies of in vivo intracranial plaque mapping have rarely been reported. In this study, the in vivo feasibility of quantitative T2* mapping of intracranial plaque at 7T MRI had firstly been demonstrated. Symptomatic patients showed significantly lower intraplaque T2* values than asymptomatic patients (26.33 ± 7.16 vs. 33.47 ± 8.68 ms, p = 0.048). This quantitative and noninvasive assessment may serve as one potential tool to characterize and evaluate intracranial atherosclerotic plaques.
Introduction
Intracranial atherosclerotic plaque is one of the leading causes of ischemic stroke1,2. And now evaluation of intracranial atherosclerotic plaque is usually carried out by qualitative vessel wall Magnetic Resonance Imaging (VW-MRI)3,4. Previous in vivo studies on carotid plaque showed great potential of quantitative evaluation in plaque characterization5,6. In particular, T2* mapping, which is related to intraplaque iron deposits, has been demonstrated to play a key role in carotid plaque progression7. However, limited by the intracranial artery size and MR resolution, previous intracranial plaque quantitative studies were usually carried out ex vivo8,9, and studies of in vivo intracranial atherosclerotic plaque mapping have rarely been reported. In recent years, with the development of MR physical technology, 7T MR has a huge breakthrough in imaging resolution, thus providing accessibility to observe intracranial plaque in vivo. Therefore, we aim to quantitatively measure T2* of intracranial atherosclerotic plaque in vivo using 7T MR to characterize and distinguish symptomatic and asymptomatic plaques.Methods
Subjects: This prospective study was approved by the Ethics Committee, and all patients provided written informed consent. Patients with middle cerebral artery (MCA) atherosclerotic plaques diagnosed by 3T MRI from Beijing Tiantan Hospital were recruited according to the following inclusion criteria: (1) unilateral/bilateral MCA stenosis more than 50% caused by atherosclerotic plaque; (2) ipsilateral carotid artery stenosis less than 50%; (3) two or more risk factors for atherosclerosis including hypertension, hyperlipidemia, diabetes, smoking and so on. Exclusion criteria were: (1) patients with carotid artery occlusion; (2) patients after carotid endarterectomy; (3) patients with carotid artery or intracranial artery stent; (4) patients with nonatherosclerotic vasculopathies, such as vasculitis, moyamoya disease, aneurysm, and dissection; (5) insufficient image quality caused by motion artifact. Age, gender and blood tests including glucose, thyroglobulin, cholesterol, high-density lipoprotein, low-density lipoprotein and homocysteine were also recorded.Imaging Protocol: Intracranial MR examinations of all patients were performed on a 7T MR scanner (MAGNETOM Terra, Siemens Healthcare, Erlangen, Germany) using a 32-channel head coil. A T1-weighted 3D Sampling Perfection with Application-optimized Contrast using different flip angle Evolutions (SPACE) was performed to localize the plane demonstrating the narrowest MCA lumen. Then multi-echo gradient-echo sequence was performed on this plane for T2* quantification with the following scan parameters: TR = 49 ms, 6 echoes with TE = 4.7, 14.0, 19.1, 24.2, 29.3 ms, FA = 15o, FOV = 200*200 mm2, slice thickness = 2 mm, number of slice = 1, in-plane resolution = 0.15*0.15 mm2. Saturation bands were used to improve delineation of the vessel wall. T2* map was exponentially fitted by T2*-weighted images from 6 TEs. Outer wall and lumen of intracranial plaque was manually drawn on T2*-weighted images from the first echo using CASCADE (UW, Seattle, Washington, USA)10, and the region between outer wall and lumen was regarded as plaque regions of interest (ROI). Mean T2* value within the plaque ROI was recorded.
Clinical Data Assessment: Based on diffusion-weighted imaging, clinical manifestations and neurological examinations, symptomatic patients were defined as patients who had ischemic stroke or transient ischemic attack in the distribution of the stenotic MCA within four weeks before MR examinations; while asymptomatic patients were considered if there was no history of cerebrovascular events or if the ischemic event occurred in a vascular territory outside the affected MCA11,12.
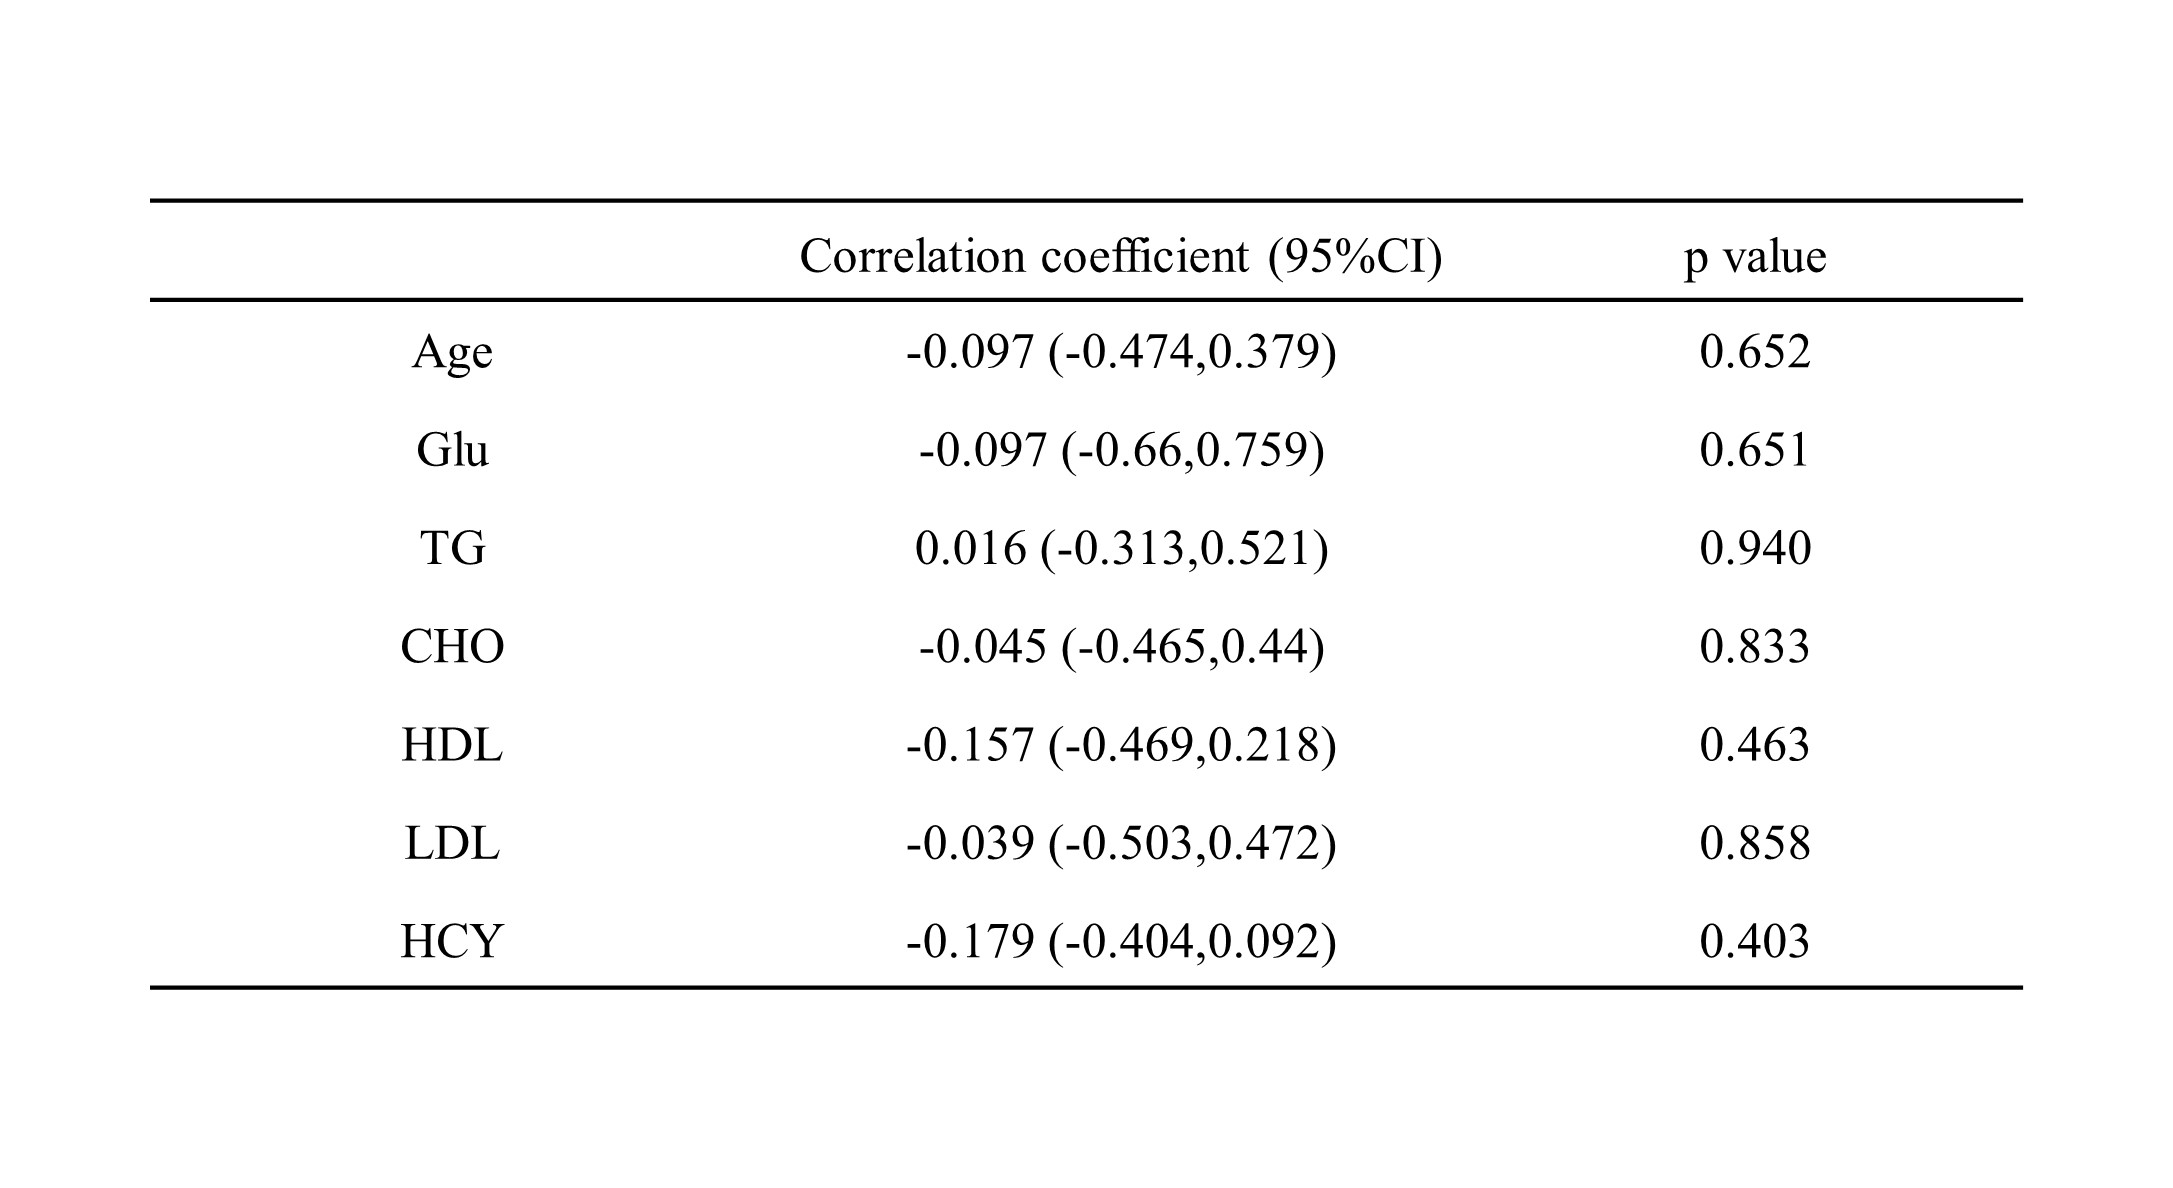
Statistical Analysis: Categorical variables are expressed as n (%) and continuous variables as mean ± SD. Two-tailed independent Student’s t test or Mann-Whitney U test was performed to compare each continuous variable between symptomatic and asymptomatic patients. Pearson correlation coefficients were calculated between T2* and the clinical characteristics. p<0.05 was considered as statistically significant and all analyses were performed using R (UoA, Auckland, New Zealand).
Results
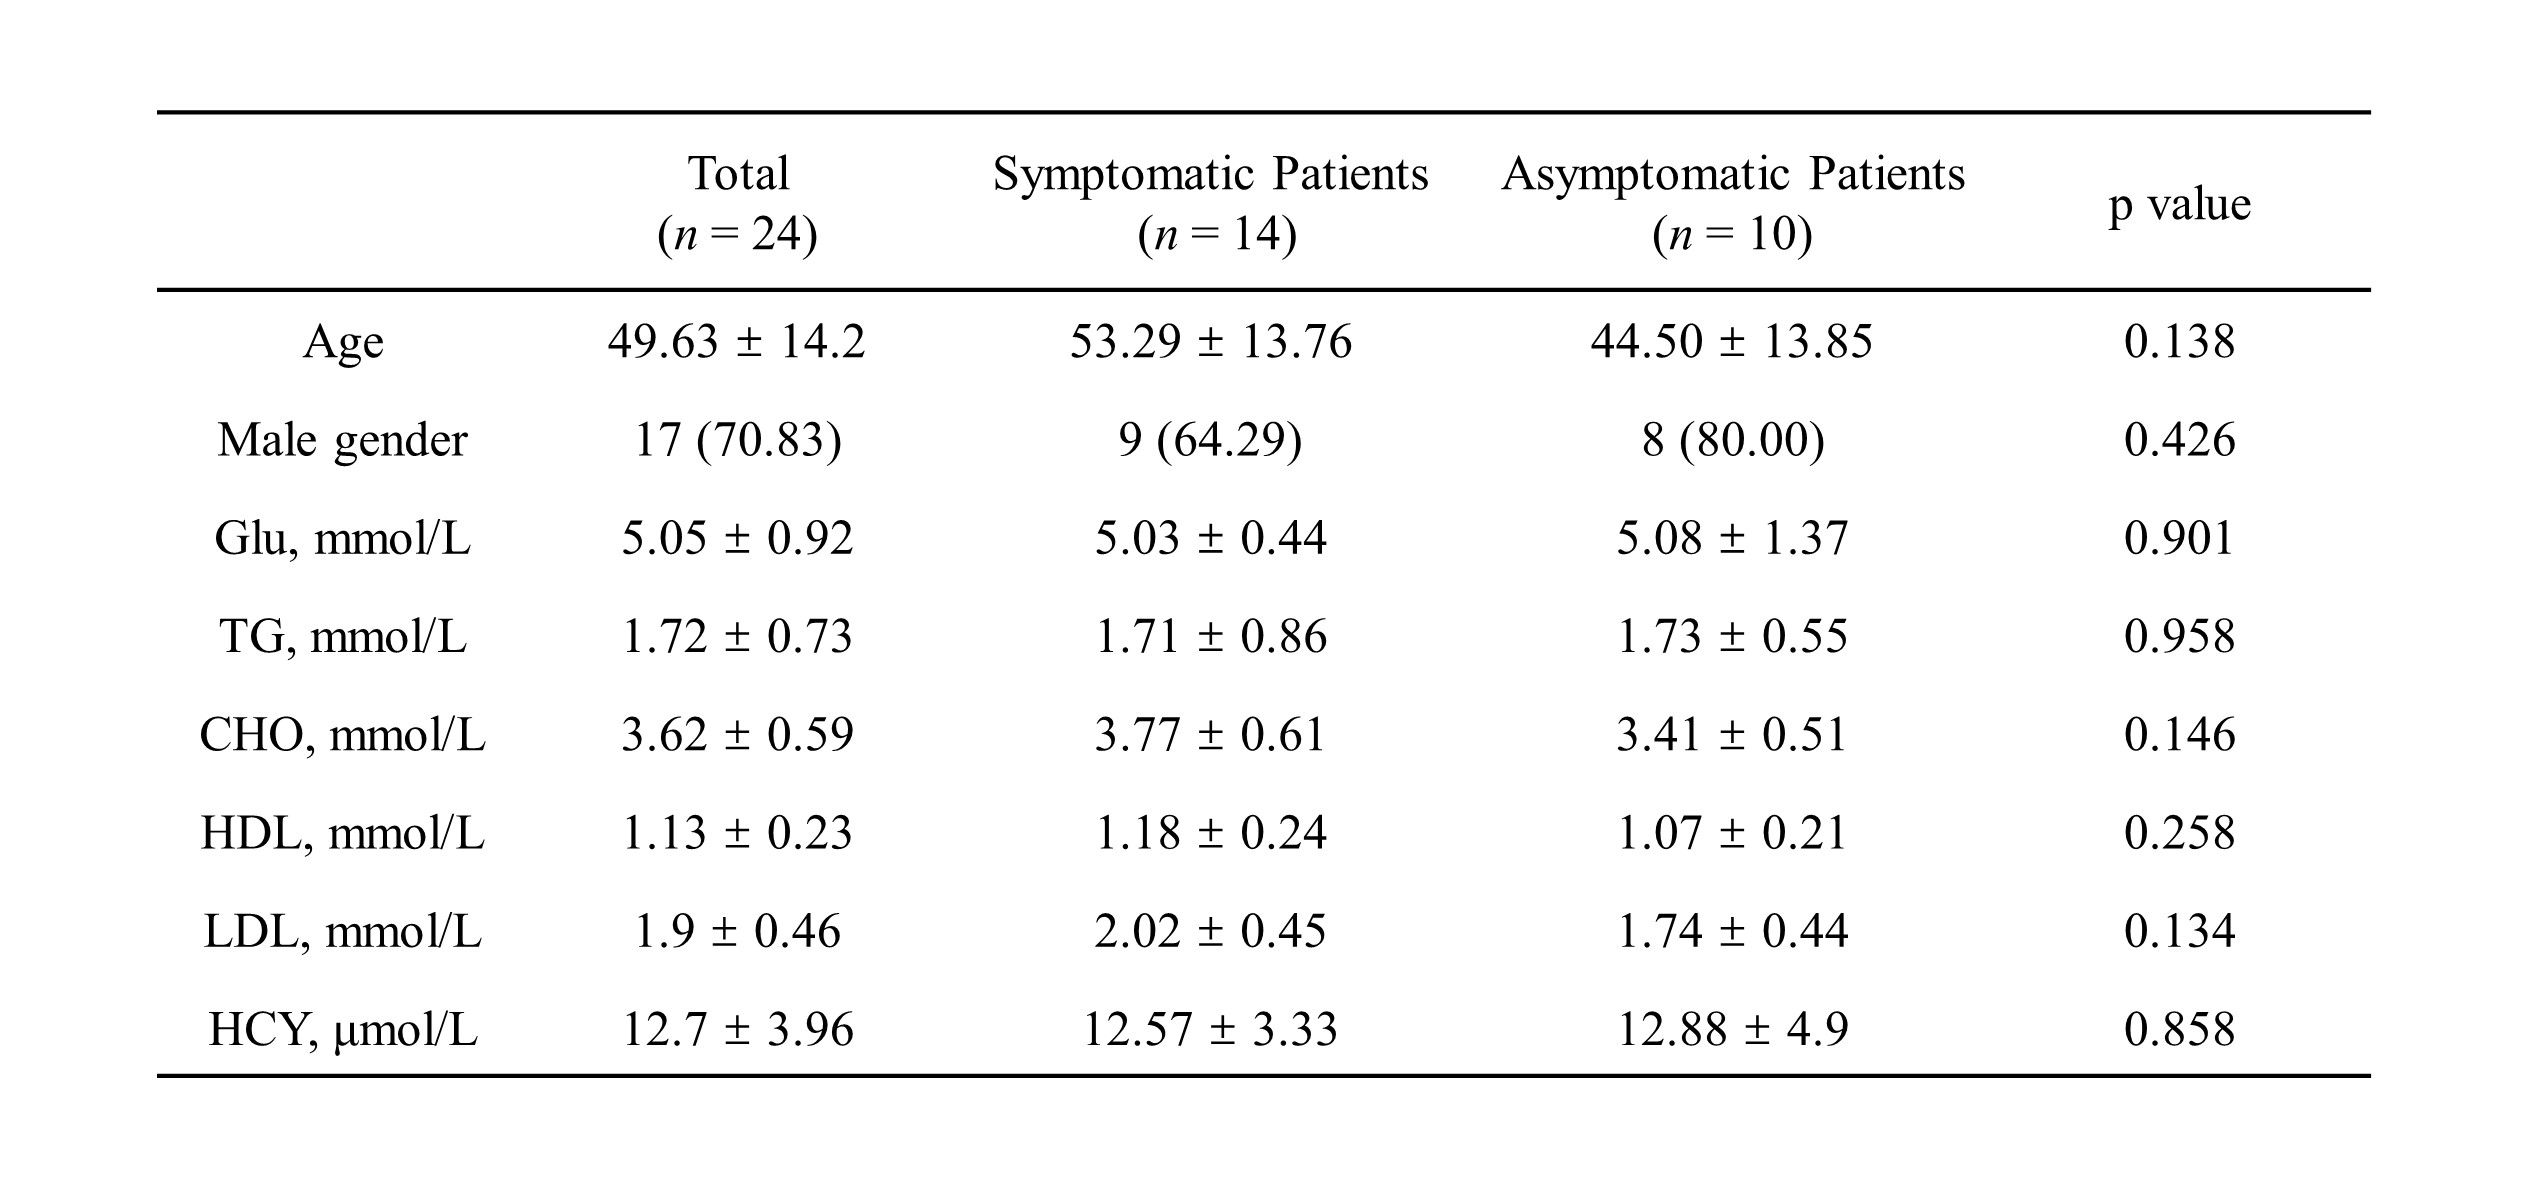
Between June 2021 and November 2021, 24 patients were recruited in this study, including 14 symptomatic patients and 10 asymptomatic patients. No significant difference was found in age, gender and blood tests between symptomatic and asymptomatic patients (Table 1). T2*-weighted images and T2* map of one symptomatic patient (36-year-old woman) are shown in Figure 1. Symptomatic patients showed significantly lower intraplaque T2* value than asymptomatic patients (26.33 ± 7.16 vs. 33.47 ± 8.68 ms, p=0.048) (Figure 2). No significant correlation was found between T2* and clinical variables in all subjects (Table 2).Discussion and Conclusion
To the best of our knowledge, our study firstly reported in vivo T2* mapping of intracranial atherosclerotic plaque at 7T MR. This quantitative and noninvasive measurement can significantly distinguish symptomatic patients from asymptomatic patients, providing a new tool for identifying symptom-producing plaques. This result may relate to the dynamic change of iron in the microenvironment of atherosclerotic plaques7. More patients with MCA atherosclerotic plaques are expected to be recruited and followed up. And then the potential diagnostic value of in vivo T2* mapping in evaluating the intracranial plaque progression and medical treatment response can be validated.Acknowledgements
None.References
1. Yu YN, Liu MW, Villablanca JP, et al. Middle Cerebral Artery Plaque Hyperintensity on T2-Weighted Vessel Wall Imaging Is Associated with Ischemic Stroke. AJNR Am J Neuroradiol. 2019 Nov;40(11):1886-1892.
2. Wang Y, Zhao X, Liu L, et al. Prevalence and outcomes of symptomatic intracranial large artery stenoses and occlusions in China: the Chinese Intracranial Atherosclerosis (CICAS) Study. Stroke. 2014 Mar;45(3):663-9.
3. Mandell DM, Mossa-Basha M, Qiao Y, et al. Intracranial Vessel Wall MRI: Principles and Expert Consensus Recommendations of the American Society of Neuroradiology. AJNR Am J Neuroradiol. 2017 Feb;38(2):218-229.
4. Lee HN, Ryu CW, Yun SJ. Vessel-Wall Magnetic Resonance Imaging of Intracranial Atherosclerotic Plaque and Ischemic Stroke: A Systematic Review and Meta-Analysis. Front Neurol. 2018 Dec 3; 9:1032.
5. Qi H, Sun J, Qiao H, Chen S, Zhou Z, Pan X, Wang Y, Zhao X, Li R, Yuan C, Chen H. Carotid Intraplaque Hemorrhage Imaging with Quantitative Vessel Wall T1 Mapping: Technical Development and Initial Experience. Radiology. 2018 Apr;287(1):276-284.
6. Chai JT, Biasiolli L, Li L, Alkhalil M, et al. Quantification of Lipid-Rich Core in Carotid Atherosclerosis Using Magnetic Resonance T2 Mapping: Relation to Clinical Presentation. JACC Cardiovasc Imaging. 2017 Jul;10(7):747-756.
7. Raman SV, Winner MW, Tran T, et al. In vivo atherosclerotic plaque characterization using magnetic susceptibility distinguishes symptom-producing plaques. JACC Cardiovasc Imaging. 2008 Jan;1(1):49-57.
8. Jiang Y, Zhu C, Peng W, et al. Ex-vivo imaging and plaque type classification of intracranial atherosclerotic plaque using high resolution MRI. Atherosclerosis. 2016 Jun; 249:10-6.
9. Azuma M, Maekawa K, Yamashita A, et al. Characterization of Carotid Plaque Components by Quantitative Susceptibility Mapping. AJNR Am J Neuroradiol. 2020 Feb;41(2):310-317.
10. Kerwin W, Xu D, Liu F, et al. Magnetic resonance imaging of carotid atherosclerosis: plaque analysis. Topics in Magnetic Resonance Imaging, 2007, 18(5): 371-378.
11. Chung JW, Bang OY, Lee MJ, et al. Echoing Plaque Activity of the Coronary and Intracranial Arteries in Patients with Stroke. Stroke. 2016 Jun;47(6):1527-33.
12. Gupta A, Baradaran H, Mtui EE, et al. Detection of Symptomatic Carotid Plaque Using Source Data from MR and CT Angiography: A Correlative Study. Cerebrovasc Dis. 2015;39(3-4):151-61.
Figures