3817
The role of histogram analysis in MAGiC sequence in the differential diagnosis of early-stage endometrial adenocarcinoma and normal endometrium1National Cancer Center/National Clinical Research Center for Cancer/Cancer Hospital, Chinese Academy of Medical Sciences and Peking Union Medical College, Beijing, China, 2GE Healthcare, MR Research, Beijing, China
Synopsis
To discuss the histogram parameters diagnostic value of Magnetic Resonance Image Compilation (MAGiC) sequence for differentiation of early-stage endometrial carcinoma (EC) from normal endometrium of health control (HC).
Introduction
Magnetic Resonance Image Compilation (MAGiC) is a new synthetic MR scanning technique, it could quantitively measure the tissues' inherent characteristics including longitudinal relaxation time (T1), transverse relaxation time (T2), and proton density (PD). Besides, histogram analysis of image has already been successfully used for distinguishing histological grade and clinical staging in EC 1,2. The purpose of our study was to compare the difference of three mappings (PD, T1, and T2) associated with histogram analysis between EC and endometrium of HC.Methods
Prospectively collected 44 early-stage EC patients and 33 healthy volunteers who underwent MAGiC sequence. Delineate all slices of lesions (for early-stage EC) and endometrium (for HC) to determine volume of interest (VOI) and obtain the histogram parameters of PD mapping, T1 mapping, and T2 mapping. Calculate the ICC of intra- and inter-observer agreement of each histogram parameter. Use Mann-Whitney U to compare the significance of the histogram features and Spearman’s correlation analysis to exclude the parameters with | r | > 0.8. The optimal model was established by logistic regression analysis. The receiver operating characteristic (ROC) curve was used to analyze the diagnostic performance of those models and compared by Delong’s test. Using SPSS Statistics 23.0 (IBM, Armonk, NY), MedCalc 13.0.4.0 (MedCalc, Mariakerke, Belgium), and R software 3.6.0 (R Foundation for Statistical Computing, Vienna, Austria) to conduct statistical analysis.Results
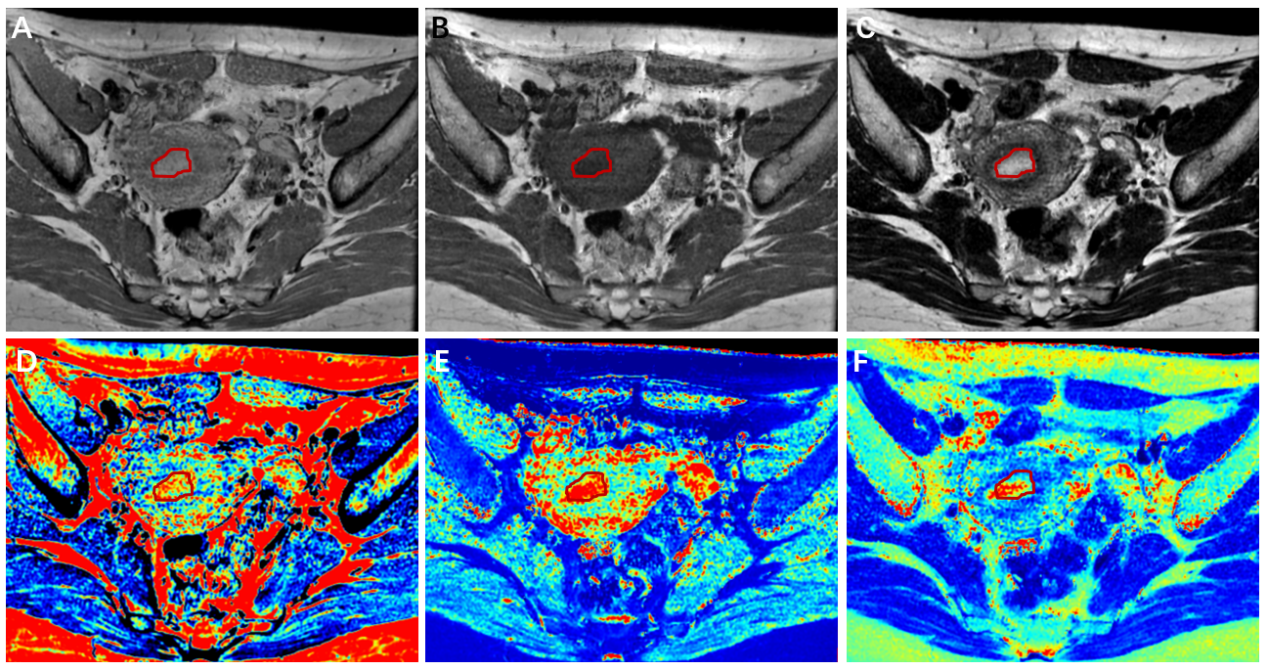
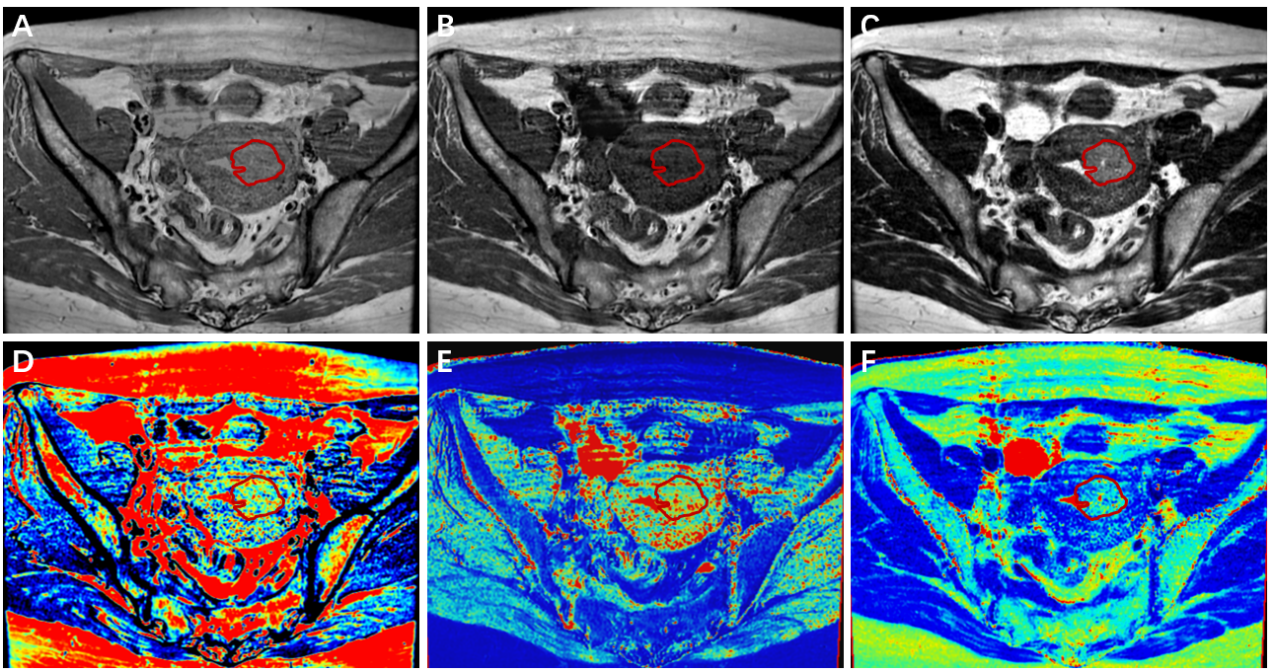
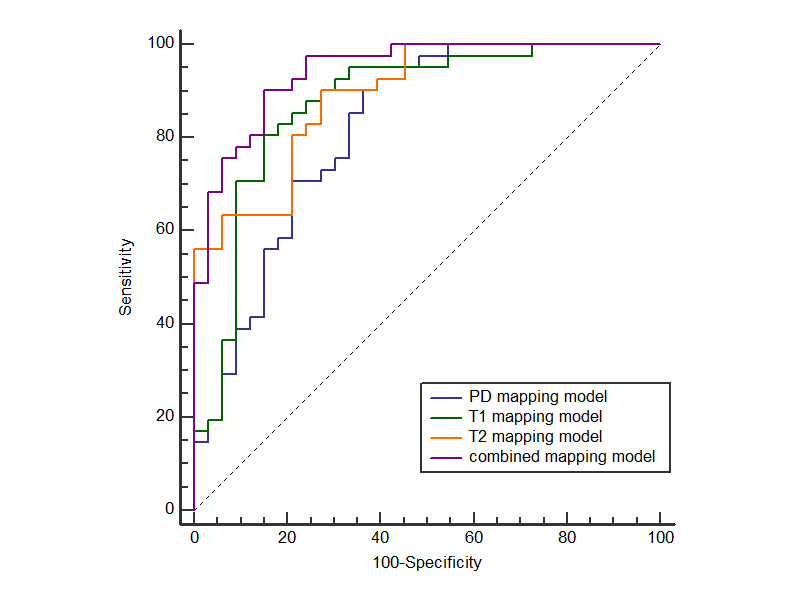
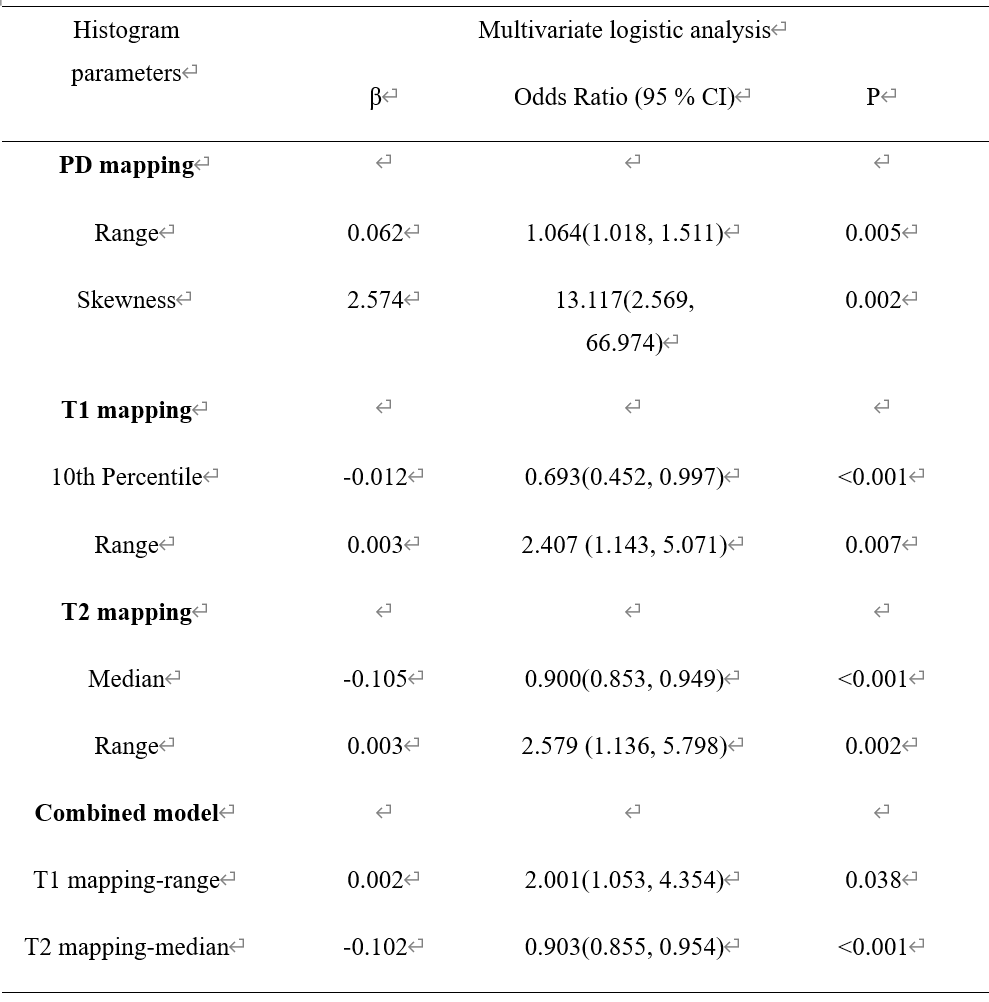
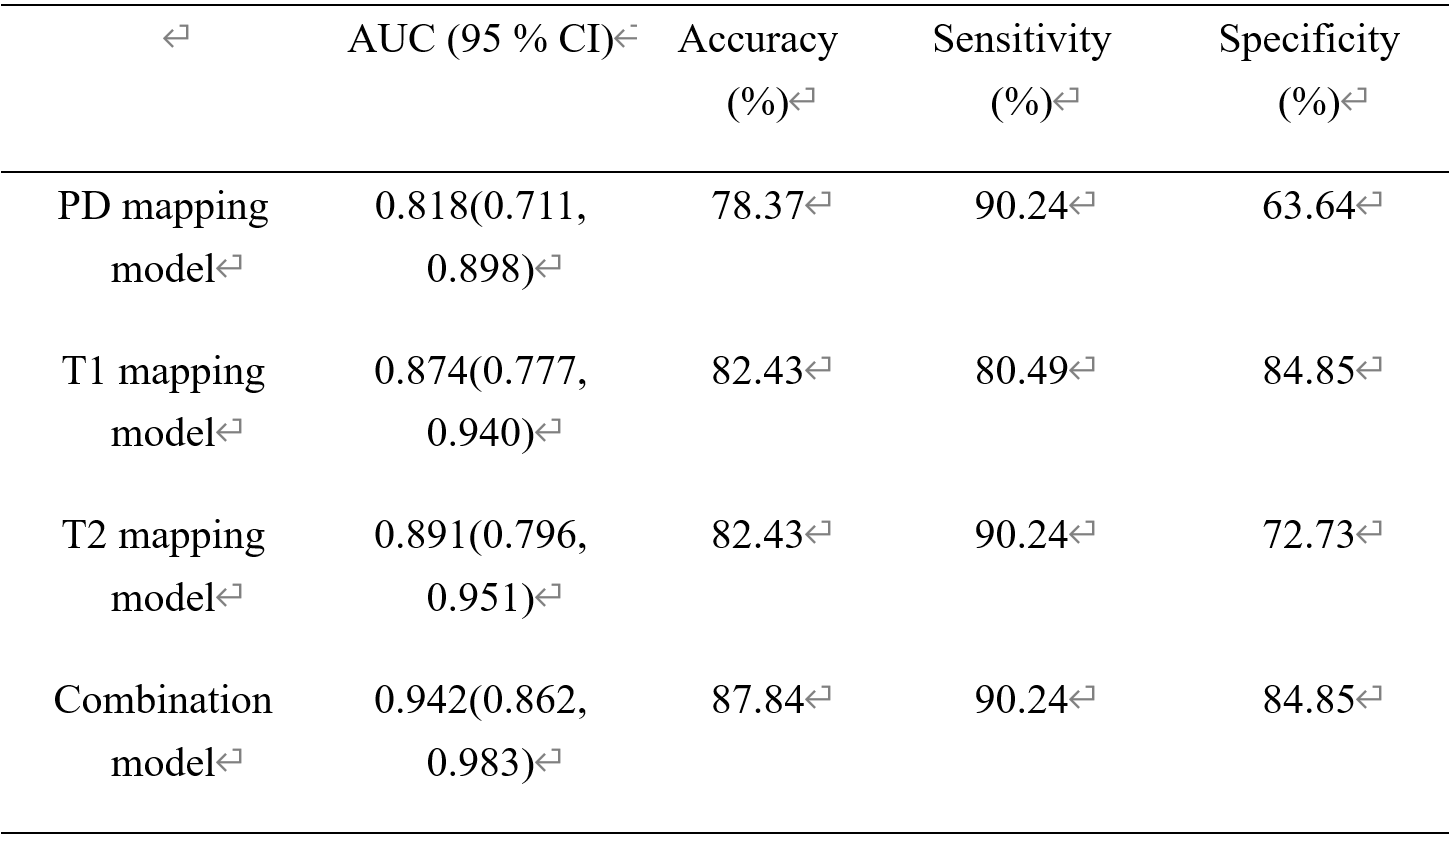
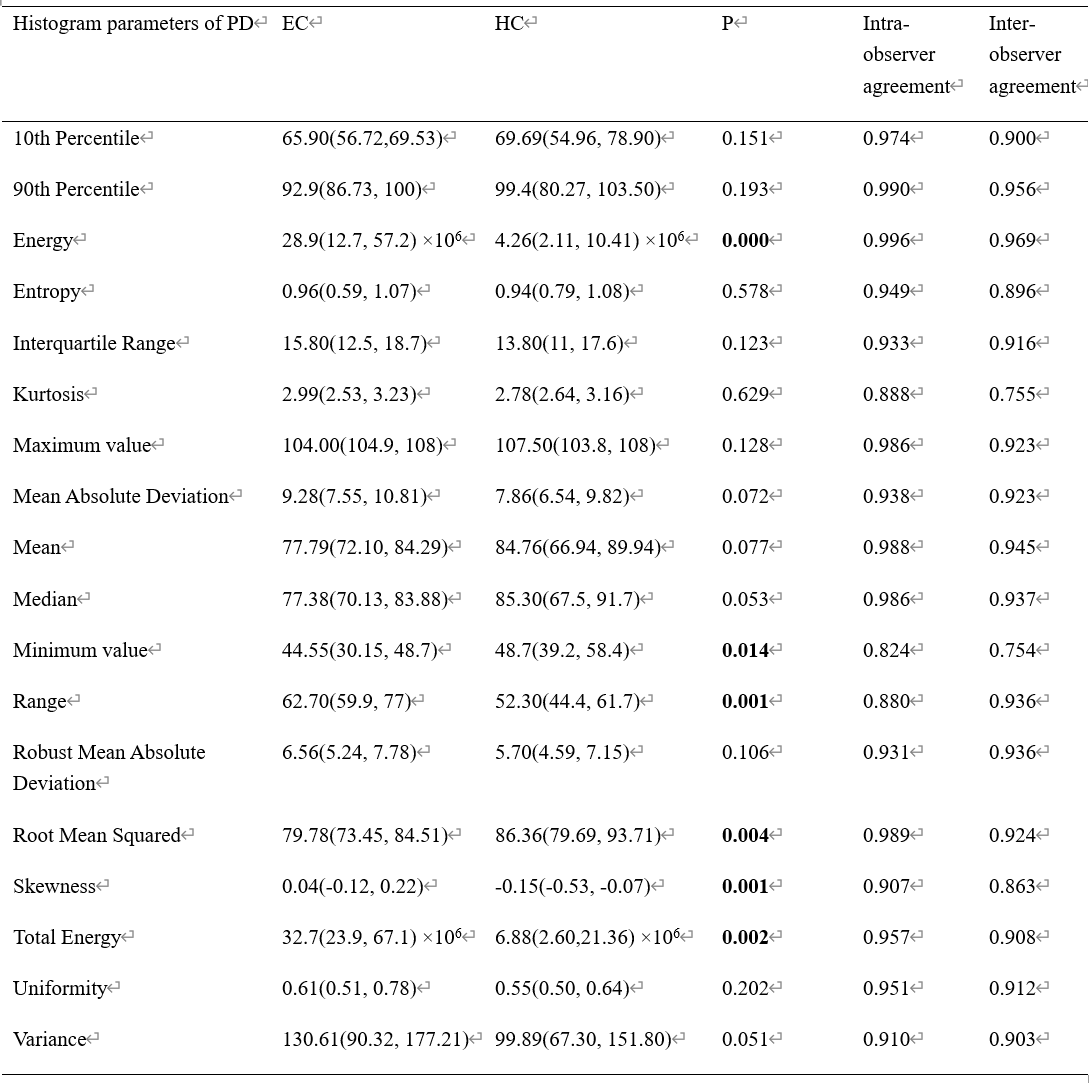
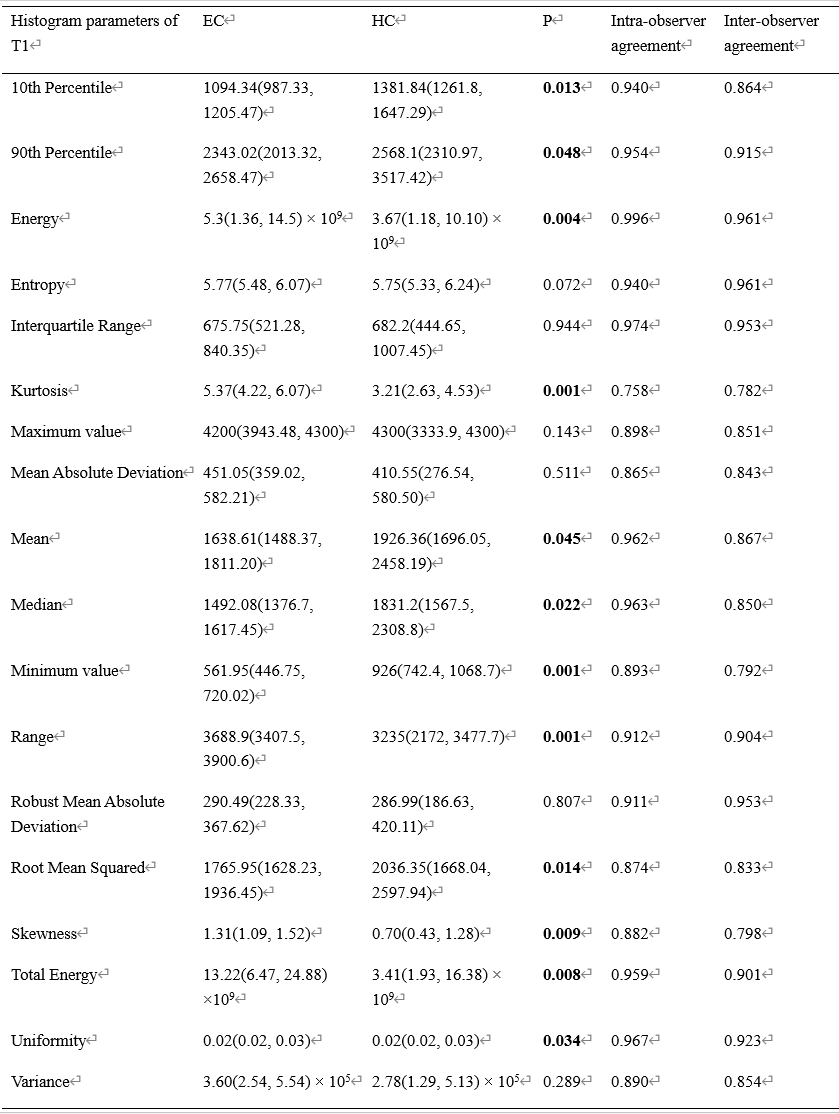
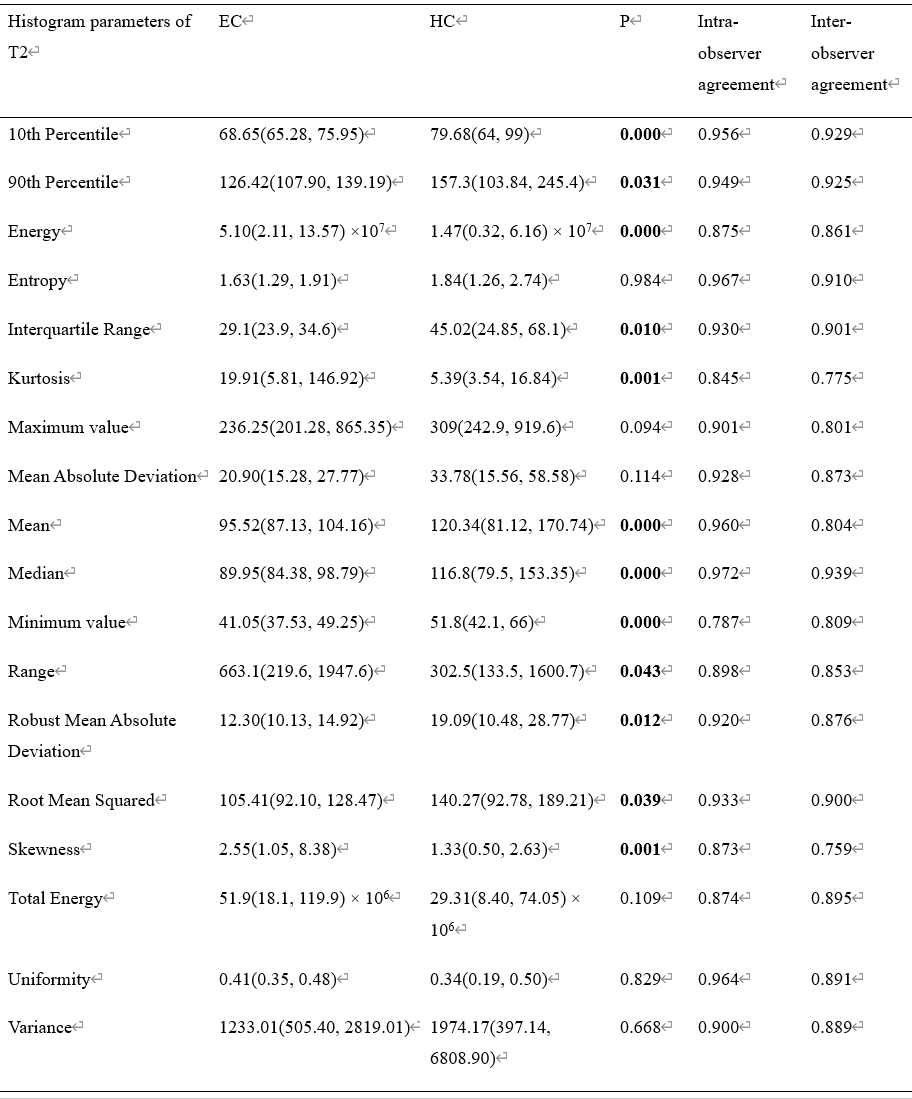
Histogram analysis of all the three mappings showed good intra- and inter-observer agreement (Supplement Table 1-3). Compared with normal endometrium of HC (Fig.1), EC (Fig.2) tends to have lower T1 and T2 value, and higher heterogeneity of three mappings. The parameters and comparisons were shown in Supplement Table 1-3. Through Spearman’s correlation test and multivariate logistic regression analysis, the Range and Skewness of PD mapping, 10th Percentile and Range of T1 mapping, Median and, Range of T2 mapping were selected for models while using single mapping (Table 1). For differentiation of early-stage EC from HC, the diagnostic efficiency was the highest by using T2 among models of single mapping (Fig.3, Table 2), with sensitivity, specificity, and accuracy of 90.24%, 72.73%, and 82.43%, respectively (area under the curve [AUC] = 0.891). When combined all the three mappings, the AUC was improved to 0.942, with sensitivity, specificity, and accuracy of 90.24%, 84.85%, and 87.84%, respectively (Fig.3).Discussion
The internal components of the tumor present an unstable state, accompanied by the birth and death of cells, resulting in heterogeneity 3. The histogram analysis can illustrate the quantitative parameters of other characteristics beyond the Mean value to provide additional information. In addition to the effects of the main magnetic field strength, T1 and T2 values are also related to many intrinsic factors, such as water and fat contents, structural changes of tissue, cell integrity, and so on 4. In our study, we established three single models and the T2 mapping model presented the better diagnostic performance. And the combined model consisted of T1 mapping-Range and T2 mapping-Median showed a better diagnostic performance than other single mapping models.Conculsion
Our study indicates that histogram analysis of MAGiC is useful for discriminating early-stage EC from normal endometrium by directly reflecting intrinsic characteristics of tumor quantitatively, while the combined model with three mappings could improve the diagnostic efficacy.Acknowledgements
noReferences
1. Woo S, Cho JY, Kim SY, et al. Histogram analysis of apparent diffusion coefficient map of diffusion-weighted MRI in endometrial cancer: a preliminary correlation study with histological grade. Acta Radiol. 2014;55(10):1270-7.
2. Ghosh A, Singh T, Singla V, et al. DTI histogram parameters correlate with the extent of myoinvasion and tumor type in endometrial carcinoma: a preliminary analysis. Acta Radiol. 2020;61(5):675-684.
3. Thapa D, Wang P, Wu G, et al. A histogram analysis of diffusion and perfusion features of cervical cancer based on intravoxel incoherent motion magnetic resonance imaging. Magn Reson Imaging. 2019;55:103-111.
4. Persson A, Baeckmann J, Berge J, et al. Temperature-corrected postmortem 3-T MR quantification of histopathological early acute and chronic myocardial infarction: a feasibility study. Int J Legal Med. 2018;132(2):541-549.
Figures