3815
A machine learning method to identify grade Ⅱ/Ⅲ glioma based on perfusion parameters derived from DCE-MRI and DSC-MRI1Medical Image Center, Nanfang Hospital, Southern Medical University, Guangzhou, China, 2Philips Healthcare, Guangzhou, China
Synopsis
As grade Ⅱ and Ⅲ gliomas are
difficult to distinguish in preoperative, this study attempted to find the best
perfusion parameters for identifying grade Ⅱ/Ⅲ glioma by machine learning model. The machine
learning model showed robust performance when using the
parameters of volume transfer coefficient (Ktrans) and mean transit time (MTT) derived
from the dynamic contrast-enhanced (DCE)
and dynamic
susceptibility contrast (DSC) imaging, which indicated that
the combination of DCE and DSC perfusion techniques is expected to further
improve the differential diagnosis of grade Ⅱ and Ⅲ gliomas.
Background
The annual incidence of glioma is around six cases per 100000 individuals worldwide. The accurate grading of glioma is critical to the formulation of surgical plans and prognostic evaluation1. Conventional MRI has been shown to be the effectively noninvasive technique in grading glioma. However, gliomas of grade Ⅱ and Ⅲ often have overlapping enhancements on preoperative conventional MRI, which makes it difficult to distinguish. The vascular permeability and blood perfusion of grade Ⅱ and Ⅲ gliomas are heterogeneous due to the destruction of blood-brain barrier (BBB). Therefore, quantitative and reliable imaging methods are needed. The parameters of dynamic susceptibility contrast (DSC) will be underestimation due to the leakage of the contrast agent which should be corrected by using a pre-loading dose, so a single perfusion technique is not comprehensive2. In recent years, the combined application of dynamic contrast-enhanced (DCE) and DSC has become more and more extensive in clinical practice. DCE not only performed leakage correction to DSC, but the combined application can also provide blood perfusion parameters and permeability parameters at the same time3. Therefore, the purpose of this study was to develop a machine learning method to identify grade Ⅱ/Ⅲ glioma with perfusion parameters derived from DCE and DSC.Materials and Methods
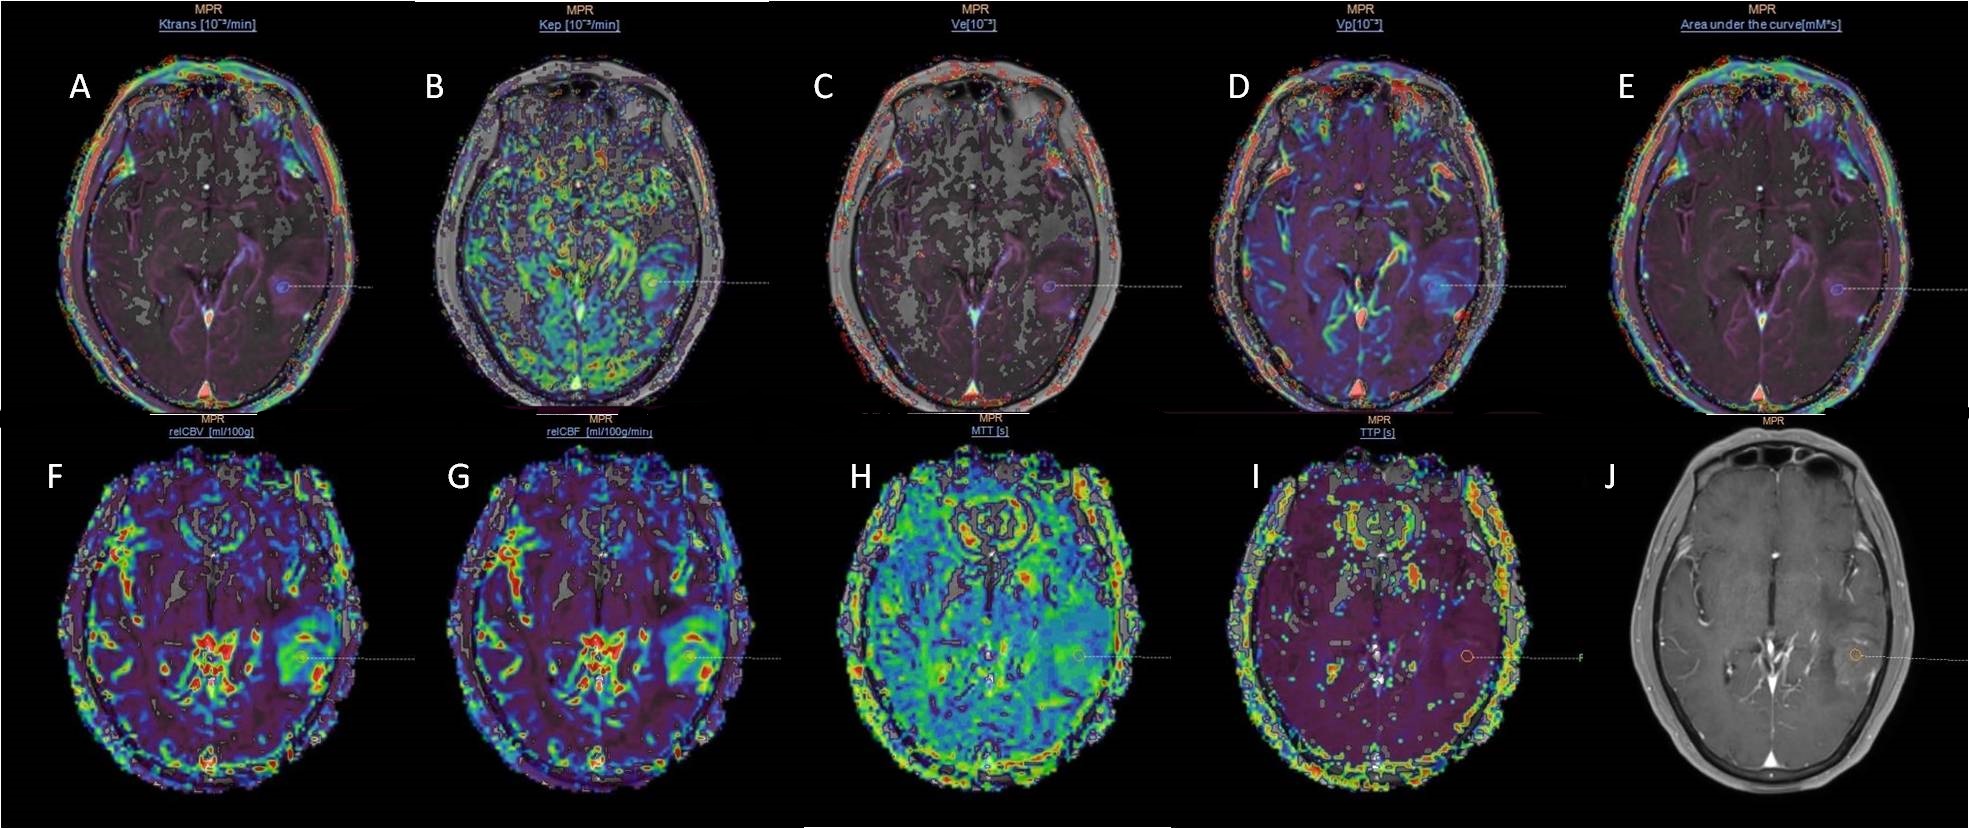
Sixty-eight patients with grade Ⅱ gliomas (43.9±9.9 years, 49 males and 19 females) and thirty with grade Ⅲ (41.2±13.1 years, 20 males and 10 females) underwent structural images, following DCE and DSC perfusion with a 3.0T clinical scanner (Achieva TX; Philips Healthcare, Best, theNetherlands). DCE-MRI was performed by T1-weighted turbo field-echo sequence (TR/TE = 3.5 ms/1.7 ms, FA = 8° , FOV = 224 × 224 mm2). DSC-MRI was performed with an axial gradient-echo T2*-weighted echo-planar sequence (TR/TE = 1845 ms/40 ms, FA = 75° , FOV = 224 × 224 mm2). The administration of 0.1 mmol/kg body weight of gadobutrol (Gadovist, Bayer Healthcare, Berlin, Germany) at a rate of 2 mL/s for DCE and 4 ml/s for DSC in the third phase, immediately followed by a 20 mL continuous saline flush at the same injection rate. Three ROIs with an area of 20-30mm2 in the abnormal area of the perfusion image both DCE and DSC with arterial input function selected in middle cerebral artery were drawn by using the Philips IntelliSpace Portal (ISP) workstations (Figure 1). For DSC, it was also necessary to draw an ROI on the normal white matter on the opposite side to form a relative value. The parameters of blood plasma (Vp), volume transfer constant (Ktrans), the volume of extracellular extravascular space (Ve), rate constant (Kep), and initial area under the concentration curve (IAUC) from DCE and relative cerebral blood flow (rCBF), relative cerebral blood volume (rCBV), mean transit time (MTT), time to peak (TPP) from DSC were calculated. Then imported the mean value of these 9 parameters into the FeAture Explorer (FAE, a tool for developing models) for further analysis4. The dataset was randomly split into a training dataset and an independent test dataset with a weight ratio of approximately 7:3. We balanced the training dataset by Synthetic Minority Oversampling TEchnique (SMOTE) and normalized the dataset by mean normalization. Pearson correlation coefficient was used to reduce the number of parameters and random forest were used as the classifier. Moreover, 5-fold cross validation was applied on the training data set. The performance of the classification model was evaluated using the area under the receiver operating characteristic (ROC) curve (AUC).Results
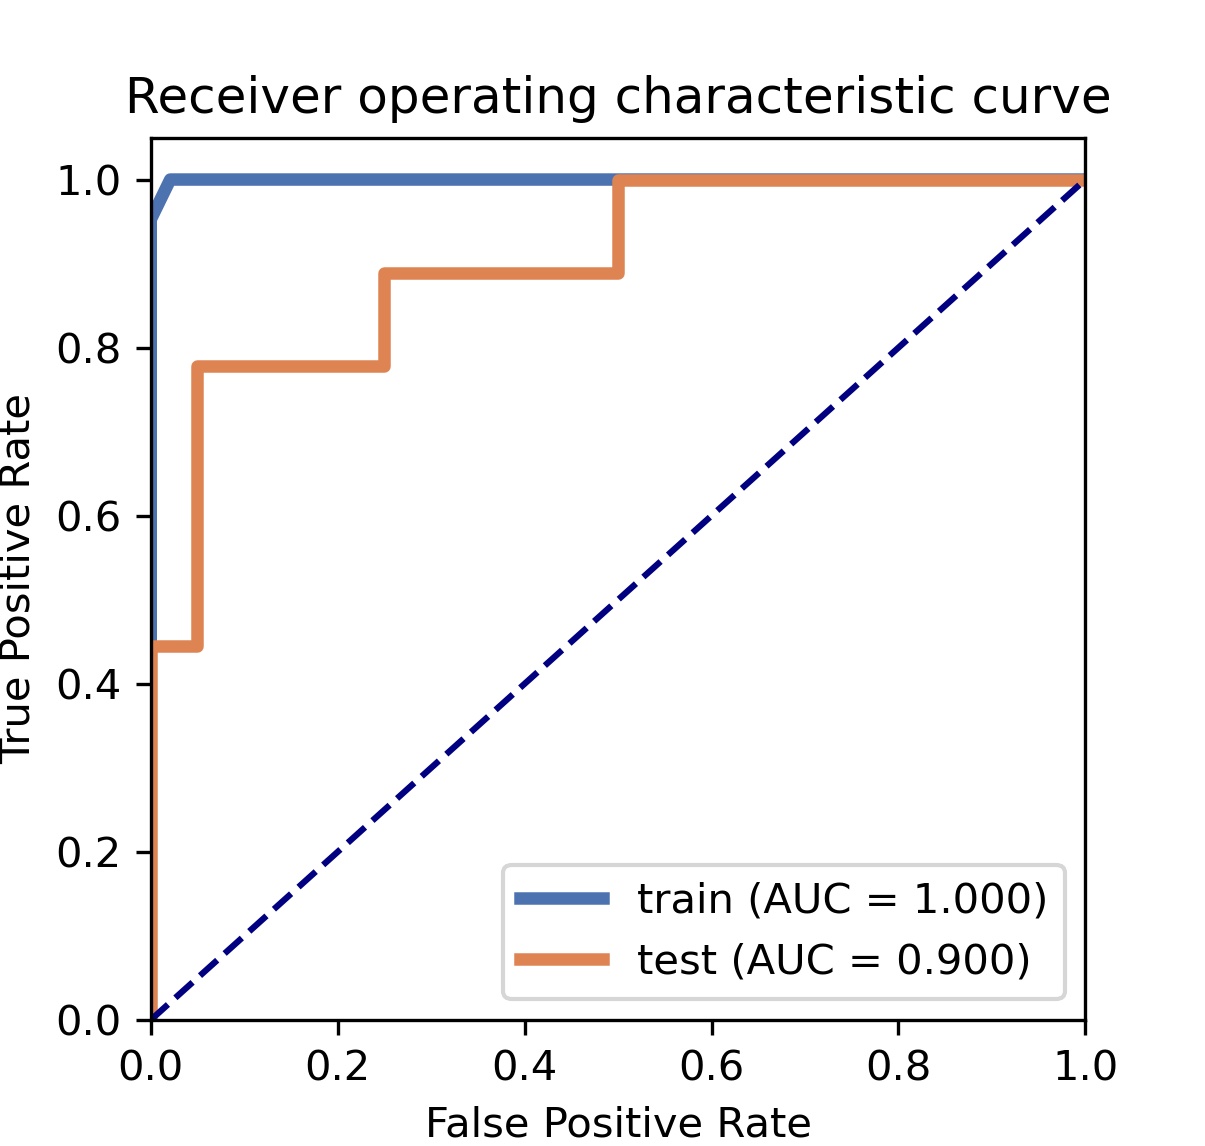
It was found that the machine learning model based on 2 features could get the highest AUC which was Ktrans derived from DCE and MTT derived from DSC. Compared to grade Ⅱ glioma, grade Ⅲ group showed increased in Ktrans and MTT. The machine learning model showed robust performance with an AUC of 1.00 (95% CI: 0.99 to 1.00), 0.90 (95% CI: 0.75 to 1.00) in the training cohort and the testing cohort, respectively (Figure 2). The accuracy, sensitivity, specificity, positive predictive value (PPV), and negative predictive value (NPV) in the testing cohort were 0.90, 0.78, 0.95, 0.88, 0.90, respectively.Conclusion
The parameters of DCE and DSC were an effective classification feature for the machine learning model to identify grade Ⅱ/Ⅲ glioma, which may suggest that the proposed method is a promising approach for improving the clinical differential diagnosis of grade Ⅱ/Ⅲ glioma.Acknowledgements
No acknowledgement found.References
1. Weller M, van den Bent M, Tonn JC, et al. European Association for Neuro-Oncology (EANO) guideline on the diagnosis and treatment of adult astrocytic and oligodendroglial gliomas. LANCET ONCOL 2017;18(6):e315-e329
2. Boxerman JL, Quarles CC, Hu LS, et al. Consensus recommendations for a dynamic susceptibility contrast MRI protocol for use in high-grade gliomas. NEURO-ONCOLOGY 2020;22(9):1262-1275
3. Welker K, Boxerman J, Kalnin A, et al. ASFNR Recommendations for Clinical Performance of MR Dynamic Susceptibility Contrast Perfusion Imaging of the Brain. AM J NEURORADIOL 2015;36(6):E41-E51
4. Song Y, Zhang J, Zhang Y, et al. FeAture Explorer (FAE): A tool for developing and comparing radiomics models. PLOS ONE 2020;15(8):e237587
Figures