3814
Histogram analysis of T1 Mapping and Diffusion-Weighted Imaging in the Prediction of Grades, Subtypes and Proliferation Status of Meningiomas1Fujian Medical University Union Hospital, Fuzhou, China, 2GE Healthcare, Beijing, China
Synopsis
In daily clinical practice, preoperative grading of meningioma is particularly important for selecting the best treatment strategy. Our hypothesis is that a combination of T1 mapping and diffusion weighted imaging (DWI) based on histogram analysis would be useful for differentiating between low-grade and high-grade meningiomas. Our study, for the first time, provides evidence that T1 mapping may be an imaging biomarker for differentiating grades and predicting the proliferation potential of meningiomas. The combination of T1 mapping and DWI showed the highest diagnostic performances in grading meningiomas.
Introduction
The evaluation of meningioma grades and subtypes before surgery is quite important for the choice of treatment strategy. T1 mapping is a novel technique that could change and virtualize the original longitudinal magnetization 1. While DWI reflects the restriction degree of the random diffusion of water molecules 2. Therefore, the aim of this study was to determine the utility of T1 mapping and DWI histogram analysis, which is an objective and reproducible method based on the tissue volume, in the prediction of grades and subtypes in meningiomas. In addition, we analyzed the association between histogram parameters with Ki-67 labeling index.Materials and methods
This prospective study comprised 69 meningioma patients who underwent preoperative magnetic resonance imaging (MRI) (including T1 mapping and DWI) at our institution from August 2020 to August 2021. DWI images in the axial plane was performed using a multi-slice, spin-echo planar imaging (EPI) pulse sequence. T1 mapping images were acquired in the axial plane before the injection of contrast agent using a multiple inversion recovery fast spin echo (IR-FSE) sequence. The histogram metrics, including mean, median, maximum, minimum, 10th percentiles, 90th percentiles, kurtosis, skewness, and variance, of T1 and apparent diffusion coefficient (ADC) values were extracted from the solid components of the whole tumor. Mann-Whitney U test was used for comparison between low- and high-grade tumors. Receiver operating characteristic (ROC) curves and multiple logistic regression were performed to identify the differential diagnosis value. Kruskal-Wallis test was used to further classify meningioma subtypes, and multiple comparisons correction were controlled by Least-significant difference (LSD) method. Spearman’s rank correlation coefficients were calculated to analyze the correlations between histogram parameters and Ki-67 expression.Results
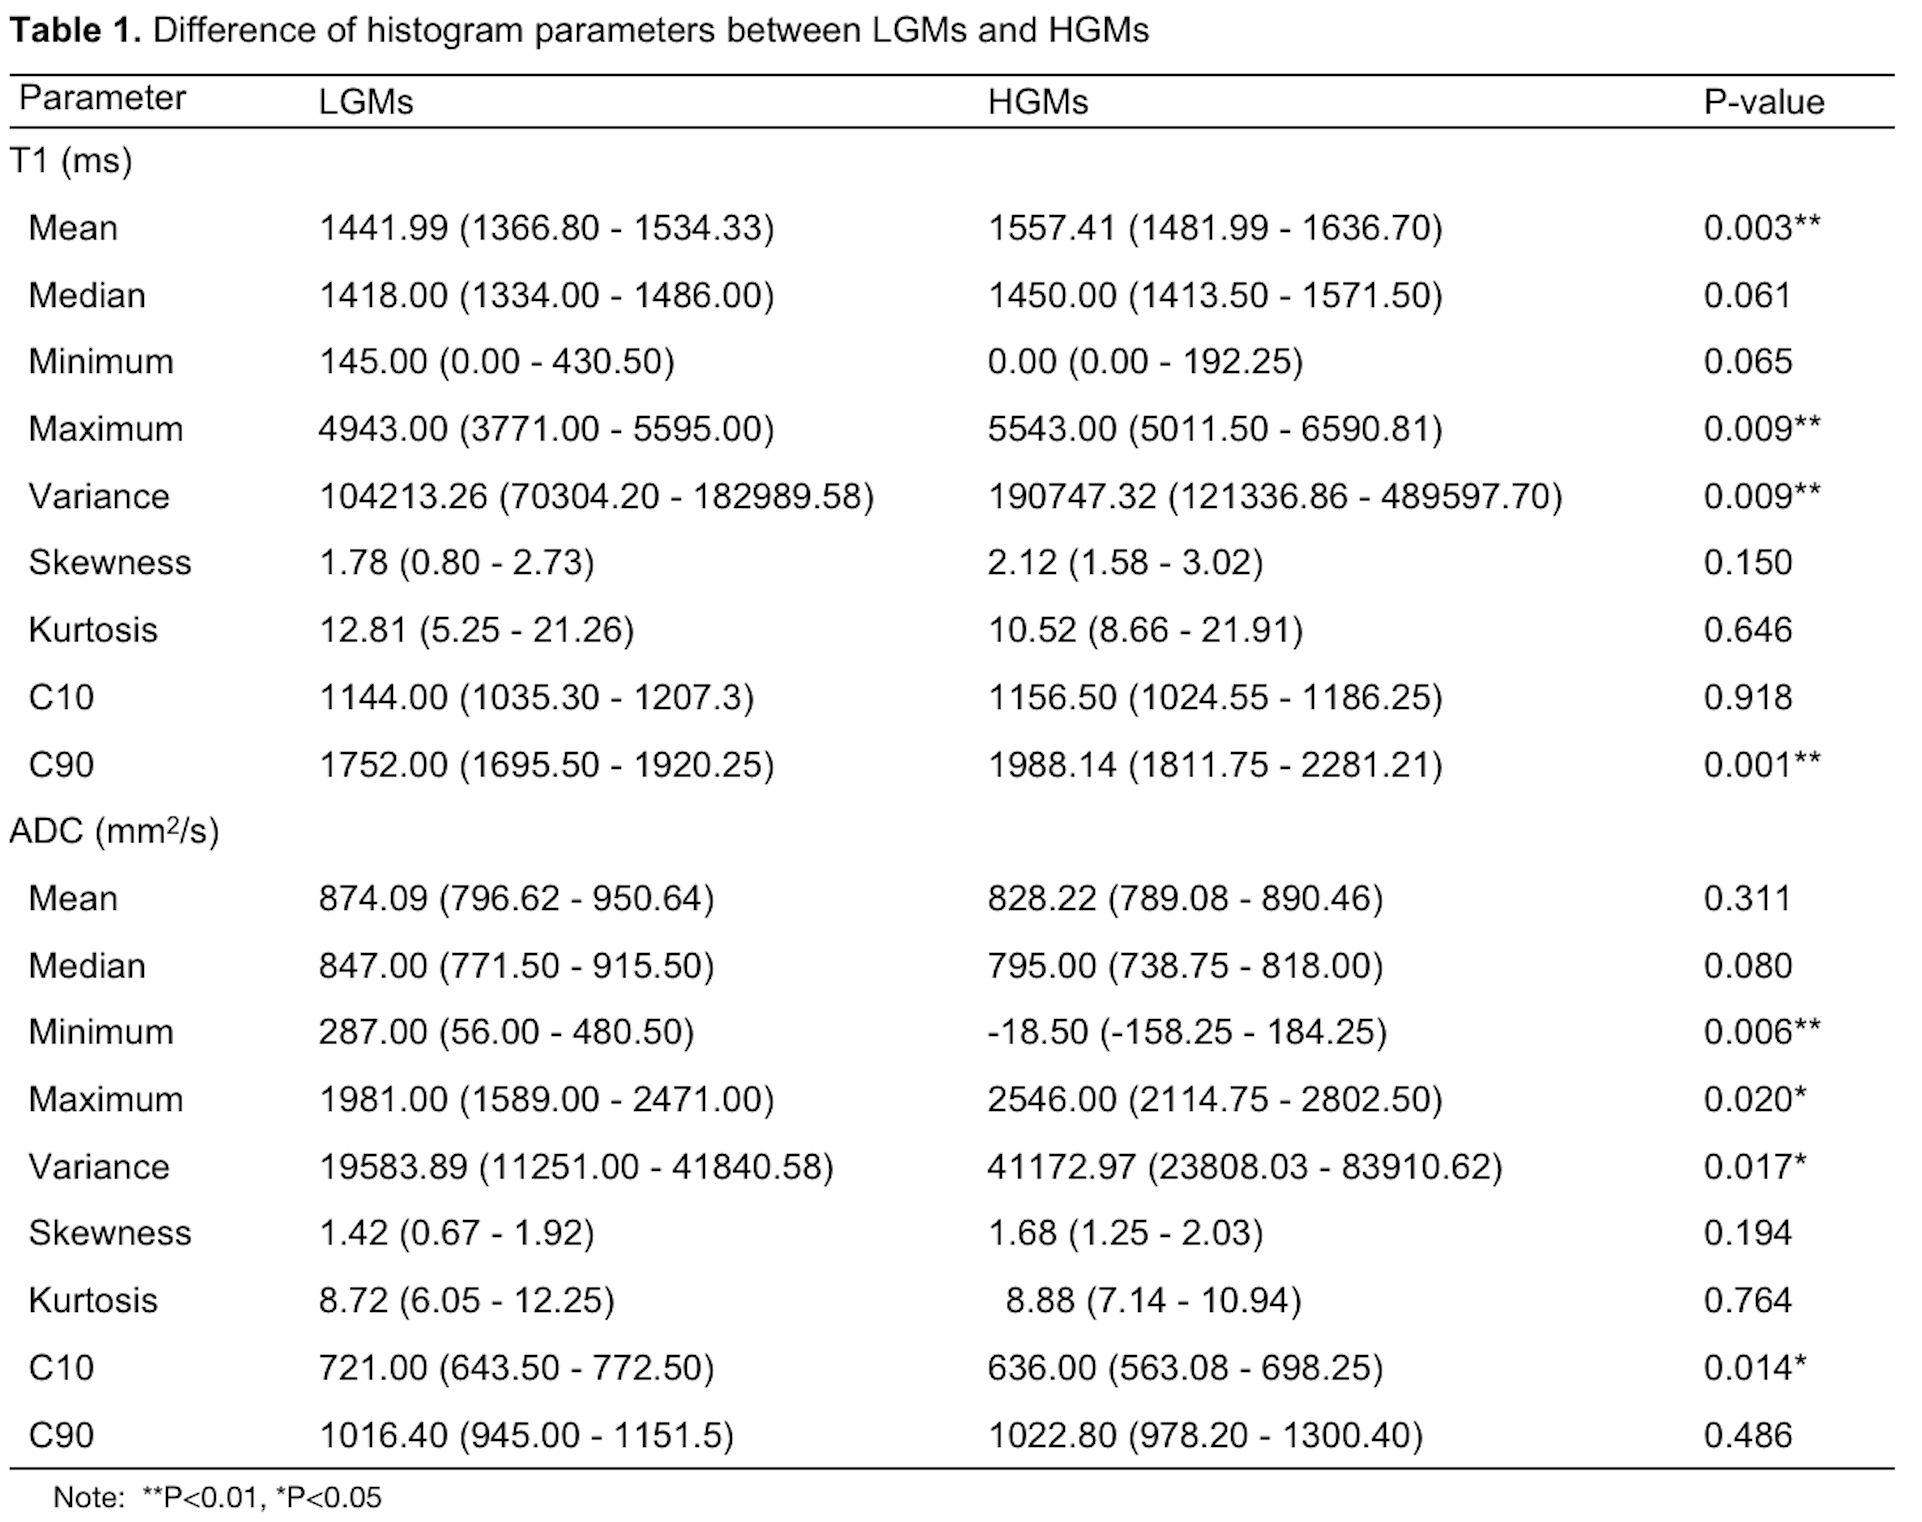
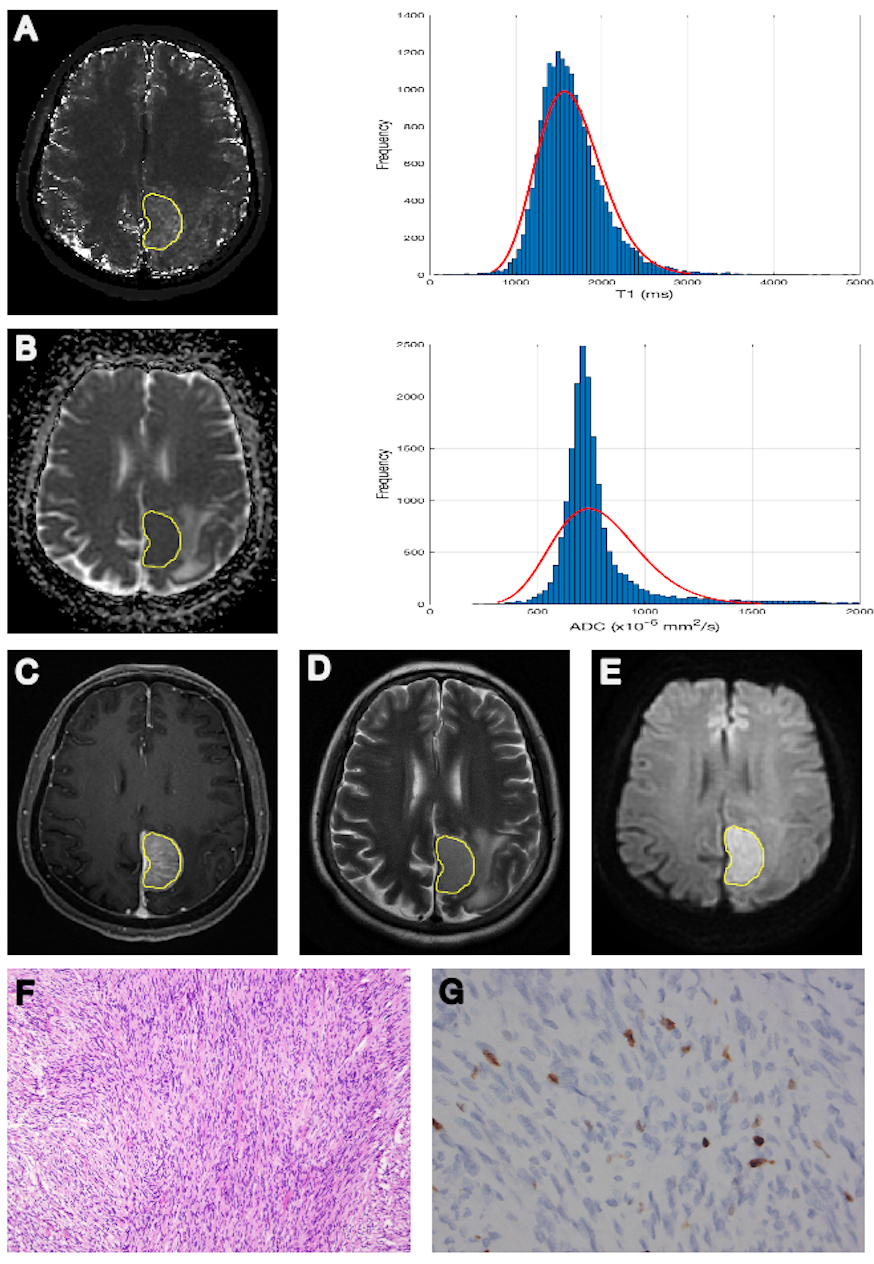
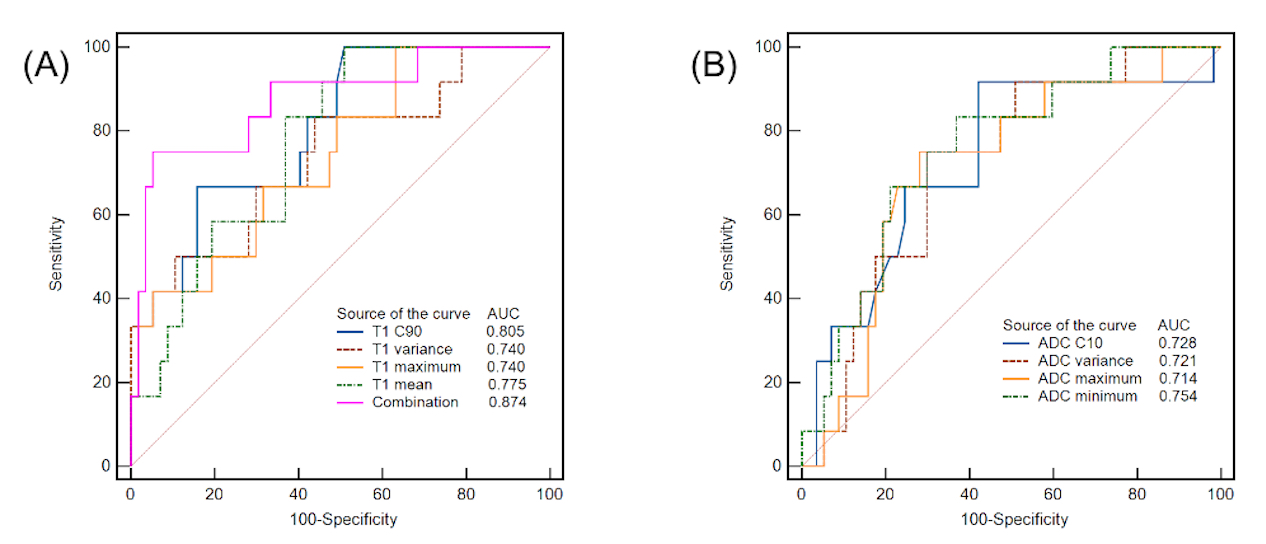
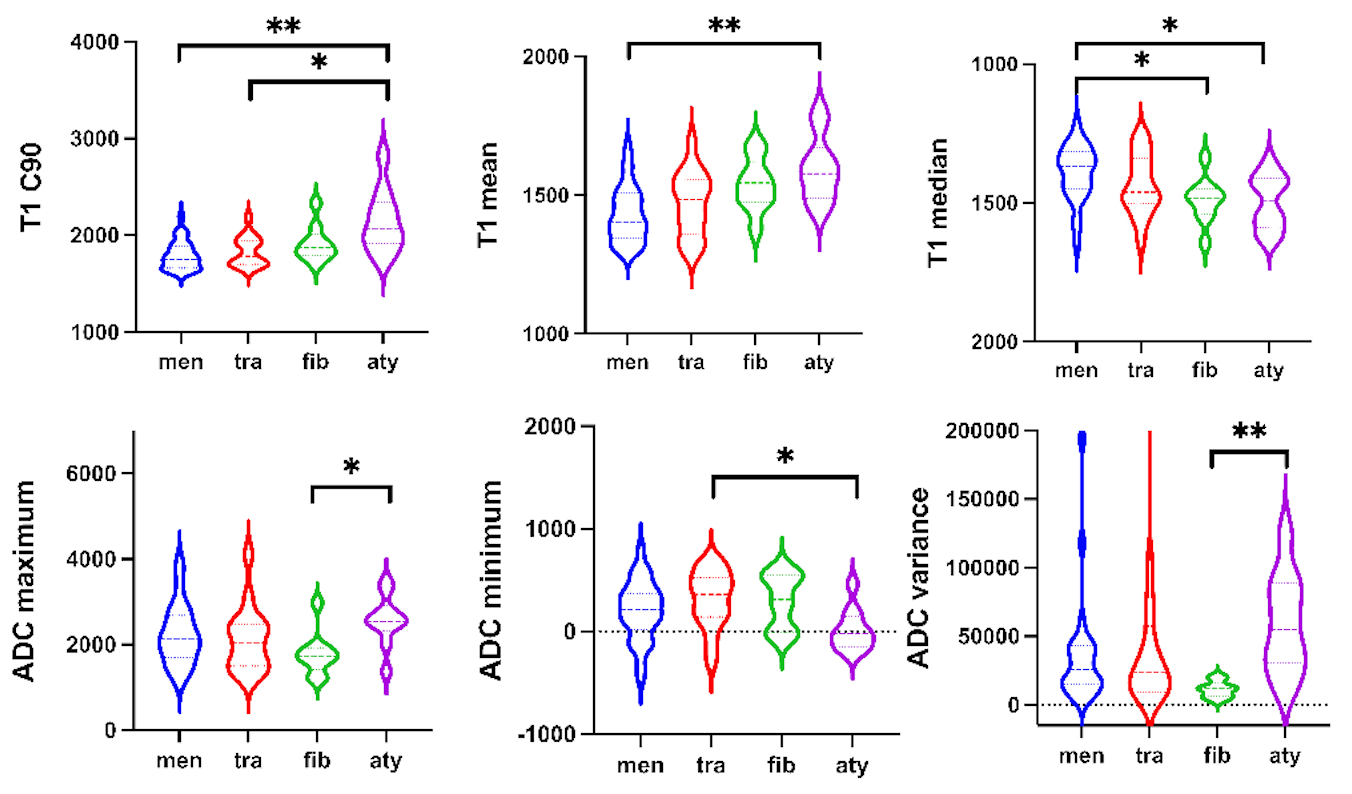
HGMs showed significantly higher mean, median, maximum, 90th percentile (C90), and variance of T1 (all p < 0.001-0.006; AUC = 0.740-0.805), minimum, and 10th percentile (C10) of ADC (p < 0.001-0.008; AUC = 0.714-0.754), compared to LGMs (Table 1). Result from one representative participant was shown in Figure 1. Figure 2 showed ROC analysis results. The diagnostic efficiency of T1 combined with ADC for meningioma classification was significantly improved. The maximum AUC of C90 of T1 (T1 C90) combined with minimum of ADC (ADC minimum), sensitivity and specificity were 0.874, 0.750, 0.947, respectively. The histogram parameters differentiated 4/6 pairs of subtype pairs (Figure 3). Significant positive correlation was identified between Ki-67 and histogram parameters of T1 (C90, mean, median) and ADC (variance).Discussion
Compared to LGMs, HGMs had significantly different mean, maximum, variance, C90 of T1. Malignant meningiomas were characterized by active mitosis, increased proliferation and ratio of nucleus/cytoplasm histopathologically, which are associated with aggressive behavior 3-5. The degradation of extracellular matrix (ECM) derived from T1 mapping is a critical step of tumor invasion 6,7. In this sense, the differences of specific T1 mapping values between LGMs and HGMs is reasonable. Furthermore, T1 value can be considered as a complex variable, reflecting tissue properties besides the ECM 8,9. Therefore, quantitative T1 values are also influenced by nucleolar differences between LGMs and HGMs. The abundance of ECM proteins such as collagen was shown to correlate well with native T1 values 10. Moreover, meningioma subtypes have different T1 values, which may be due to their histology of brain tumors. The T1 value was influenced by many factors, the higher T1 values accompany with higher water content and rarer collagen fibers. Compared with meningothelial meningiomas, fibrous meningiomas are rich in collagen fibers, and atypical meningioma cells are closely arranged. Therefore, T1 median could distinguish three meningioma subtypes.We also found that the maximum and variance of ADC values of LGMs were significantly lower than those of HGMs, which may indicate that ADC maximum reflects uneven distribution of proliferation cells and micronecrosis in high-grade meningiomas 11,12. Besides, the minimum and C10 of ADC values of solid regions in LGMs were significantly higher than those in HGMs. One possible reason was that increased mitosis, enlarged nuclei, and reduction of extracellular space led to water diffusion restriction of HGMs, resulting in a reduced ADC value 5,13.
In addition, another valuable finding was that the diagnostic efficiency of the combination of T1 mapping and DWI was better than that of anyone alone, indicating that combining index could be used as an effective imaging biomarker in predicting histological grades of meningiomas.
We further investigated the association between T1 and ADC parameters with Ki-67 proliferation marker. We found that T1 (mean, C90) and ADC (maximum, variance) was positively correlated with Ki-67 index, while kurtosis of ADC has a significantly negative correlation with Ki-67 index, indicating that a more heterogeneous microenvironment could be evaluated by histogram parameters to predict proliferation activity of meningiomas 14.
Conclusion
T1 and ADC histogram parameters may represent an in vivo imaging biomarker in the prediction of grades, subtypes and cellular proliferation status of meningiomas, providing incremental diagnostic value beyond qualitative MRI features. The combination of T1 C90 and ADC minimum showed the highest diagnostic performances in grading meningiomas.More research on T1 mapping for brain tumors is needed in the future.Acknowledgements
No acknowledgement found.References
1. E. Aherne, K. Chow, and J. Carr, Cardiac T1 mapping: Techniques and applications. J Magn Reson Imaging 51 (2020) 1336-1356.
2. A.M. El-Ali, V. Agarwal, A. Thomas, R.L. Hamilton, and C.G. Filippi, Clinical metric for differentiating intracranial hemangiopericytomas from meningiomas using diffusion weighted MRI. Clin Imaging 54 (2019) 1-5.
3. J.A. Takahashi, T. Ueba, N. Hashimoto, Y. Nakashima, and N. Katsuki, The combination of mitotic and Ki-67 indices as a useful method for predicting short-term recurrence of meningiomas. Surg Neurol 61 (2004) 149-55; discussion 155-6.
4. J. Ayerbe, R.D. Lobato, J. de la Cruz, R. Alday, J.J. Rivas, P.A. Gomez, and A. Cabrera, Risk factors predicting recurrence in patients operated on for intracranial meningioma. A multivariate analysis. Acta Neurochir (Wien) 141 (1999) 921-32.
5. V.A. Nagar, J.R. Ye, W.H. Ng, Y.H. Chan, F. Hui, C.K. Lee, and C.C. Lim, Diffusion-weighted MR imaging: diagnosing atypical or malignant meningiomas and detecting tumor dedifferentiation. AJNR Am J Neuroradiol 29 (2008) 1147-52.
6. A.F. Okuducu, U. Zils, S.A. Michaelis, S. Michaelides, and A. von Deimling, Ets-1 is up-regulated together with its target gene products matrix metalloproteinase-2 and matrix metalloproteinase-9 in atypical and anaplastic meningiomas. Histopathology 48 (2006) 836-45.
7. S.K. Piechnik, and M. Jerosch-Herold, Myocardial T1 mapping and extracellular volume quantification: an overview of technical and biological confounders. Int J Cardiovasc Imaging 34 (2018) 3-14.
8. R.J. Everett, C.G. Stirrat, S.I. Semple, D.E. Newby, M.R. Dweck, and S. Mirsadraee, Assessment of myocardial fibrosis with T1 mapping MRI. Clin Radiol 71 (2016) 768-78.
9. R. Ma, Y. Geng, L. Gan, Z. Peng, J. Cheng, J. Guo, and J. Qian, Quantitative T1 mapping MRI for the assessment of extraocular muscle fibrosis in thyroid-associated ophthalmopathy. Endocrine (2021).
10. L.C. Adams, B. Ralla, P. Jurmeister, K.K. Bressem, U.L. Fahlenkamp, B. Hamm, J. Busch, and M.R. Makowski, Native T1 Mapping as an In Vivo Biomarker for the Identification of Higher-Grade Renal Cell Carcinoma: Correlation With Histopathological Findings. Invest Radiol 54 (2019) 118-128.
11. Y.W. Park, S. Kim, S.S. Ahn, K. Han, S.G. Kang, J.H. Chang, S.H. Kim, S.K. Lee, and S.H. Park, Magnetic resonance imaging-based 3-dimensional fractal dimension and lacunarity analyses may predict the meningioma grade. Eur Radiol 30 (2020) 4615-4622.
12. C. Hsu, C. Pai, H. Kao, C. Hsueh, W. Hsu, and C. Lo, Do aggressive imaging features correlate with advanced histopathological grade in meningiomas? Journal of clinical neuroscience : official journal of the Neurosurgical Society of Australasia 17 (2010) 584-7.
13. S. Lu, S. Kim, N. Kim, H. Kim, C. Choi, and Y. Lim, Histogram analysis of apparent diffusion coefficient maps for differentiating primary CNS lymphomas from tumefactive demyelinating lesions. AJR. American journal of roentgenology 204 (2015) 827-34.
14. A. Del Gobbo, A. Pellegrinelli, G. Gaudioso, M. Castellani, F. Zito Marino, R. Franco, A. Palleschi, M. Nosotti, S. Bosari, V. Vaira, and S. Ferrero, Analysis of NSCLC tumour heterogeneity, proliferative and 18F-FDG PET indices reveals Ki67 prognostic role in adenocarcinomas. Histopathology 68 (2016) 746-51.
Figures