3813
Pancreatic extracellular volume fraction using T1 mapping in patients with liver cirrhosis
Qinhe Zhang1, Nan Wan1, Xue Ren1, Peng Sun2, Xu Dai3, Liangjie Lin4, Zhigang Wu5, Jiazheng Wang4, and Ailian Liu1
1The first affiliated hospital of Dalian Medical University, Dalian, China, 2Philips health, Wu han, China, 3Philips health, Shenyang, China, 4Philips health, Beijing, China, 5Philips health, Shen zhen, China
1The first affiliated hospital of Dalian Medical University, Dalian, China, 2Philips health, Wu han, China, 3Philips health, Shenyang, China, 4Philips health, Beijing, China, 5Philips health, Shen zhen, China
Synopsis
Extracellular volume (ECV) fraction might represent a useful parameter for the noninvasive quantification of pancreatic fibrosis, and the proton density fat fraction (FF) of pancreas can be obtained by mDxion Quant. Here, we hypothesized that pancreatic ECV and FF, for evaluation of pancreatic fibrosis and fat content, can be used to assess patients with liver cirrhosis. Results indicated that pancreatic ECV at 60 mins after contrast agent administration showed a statistical difference between liver cirrhosis patients and controls. A significant correlation was observed between pancreatic FF and ECV at 5 mins after administration.
Introduction
Liver cirrhosis can lead to distortion and obstruction of the vascular structure in liver, accompanied by changes in a variety of pathophysiological factors, resulting in portal hypertension and high dynamic circulation, and affecting the functions of brain, spinal cord, lungs, and kidneys etc. However, there is currently a lack of relevant research on the changes in pancreatic function and status in patients with liver cirrhosis. Recently, MR T1 mapping has been used to evaluate tissue fibrosis of the cardiovascular system and pancreas1. Extracellular volume (ECV) fraction, calculated with T1 values measured before and after administration of an extracellular contrast agent, measures the extracellular space and represents the percentage of noncellular tissue volume2. It is a physiologically intuitive unit of measurement independent of field strength, and might therefore be more suitable for follow-up investigations, compared with T1 mapping. Thus, ECV might represent a useful parameter for the noninvasive quantification of pancreatic fibrosis. In addition, the proton density fat fraction (FF) of pancreas can be obtained by the mDxion Quant technique3. We hypothesized that pancreatic ECV and FF can reflect pancreatic fibrosis and fat content, respectively, and thus be used to assess patients with liver cirrhosis. The pancreatic ECV and FF in patients with liver cirrhosis were measured in this study with comparison to those for control subjects.Materials and Methods
23 cases were retrospectively analyzed, including 11 cases of hepatic cirrhosis (7 male, 55.36±11.47 years) and 12 control subjects (8 male, 56.83±9.09 years). Patients were instructed to fast for at least 5 h prior to MR examination. MR scans were performed using a 3-T MR system (Ingenia CX; Philips Healthcare, Best, the Netherlands) equipped with a 32-channel digital coil. Scan parameters for 3D mDIXON-Quant included: FOV=375 mm, TR/TE=6.0/1.05 ms, voxel size =2.3×1.8 mm2, slice thk/gap =5.0/-2.5 mm. Scan parameters for T1 mapping included: FOV= 300×400×50 mm, TR/TE= 2/1 ms, voxel size= 1.6×1.6 mm2, slice thk =10.0 mm. Pancreatic fat fraction (FF) was calculated on the fat fraction map acquired by mDXION Quant. A total of 0.1 mmol Gd-DOB-DTPA/kg body weight was administered to all the enrolled patients. Contrast agent injection was performed at a rate of 2 mL/s, followed by a 30-mL saline flush at the same rate. Two sets of pancreatic ECVs were calculated by using T1 maps acquired before and post (approximately at 5 and 60 minutes, respectively) the administration of contrast agent, using the following equation: Pancreatic ECV = (1/T1 pancreas post-contrast–1/T1 pancreas pre-contrast)/(1/T1 aorta post-contrast–1/T1 aorta pre-contrast)×(1–hematocrit) using MATLAB. 2D regions of interest (ROIs) were placed at the head, body and tail regions of pancreas on the fat fraction maps and ECV maps for quantitative measurements (Figure 1). The mean value of three ROIs was used as the value of the whole pancreas. ROIs area were approximately 25-100 mm2. All ROIs were placed within the interested tissue by avoiding blood vessels, pancreatic duct and abdominal adipose tissue as much as possible.Results
Table 1 showed the clinical characters, pancreatic FF and ECV measurements for subjects with and without liver cirrhosis. Pancreatic ECV of 60 mins after administration showed a statistical difference between the two groups (liver cirrhosis vs. control: 53.87±15.04 vs. 33.33±12.36, P=0.006). Pancreatic FF was associated with pancreatic ECV of 5 min after administration (r=0.435, P=0.038) (Figure 2).Discussion and conclusion
The pancreatic ECV of 60 mins after administration measured in this study showed a statistical difference between liver cirrhosis patients and control subjects. ECV imaging dichotomizes the tissues into intra- and extracellular space and reports the extracellular fraction. We believe that pancreatic ECV reflects the degree of pancreatic fibrosis, similar to the myocardium and liver. However, the causes of pancreatic fibrosis in patients with liver cirrhosis and the mechanism of its correlation with pancreatic fat deposition need further study. Results also showed a significant positive correlation between pancreatic FF and ECV of 5 mins after administration, which indicate the increase of FF may contribute to an increase in ECV in pancreas.Acknowledgements
N/AReferences
1. Tirkes T, Lin C, Fogel E L, et al. T1 mapping for diagnosis of mild chronic pancreatitis. Journal of Magnetic Resonance Imaging, 2017, 45(4): 1171-1176.2. Noda Y, Goshima S, Tsuji Y, et al. Pancreatic extracellular volume fraction using T1 mapping in patients with impaired glucose intolerance. Abdominal Radiology, 2020, 45(2): 449-456.3. Oguz S H, İdilman I, Helvaci N, et al. Tissue fat quantification by magnetic resonance imaging: proton density fat fraction in polycystic ovary syndrome. Reproductive BioMedicine Online, 2020, 41(2): 329-334.Figures
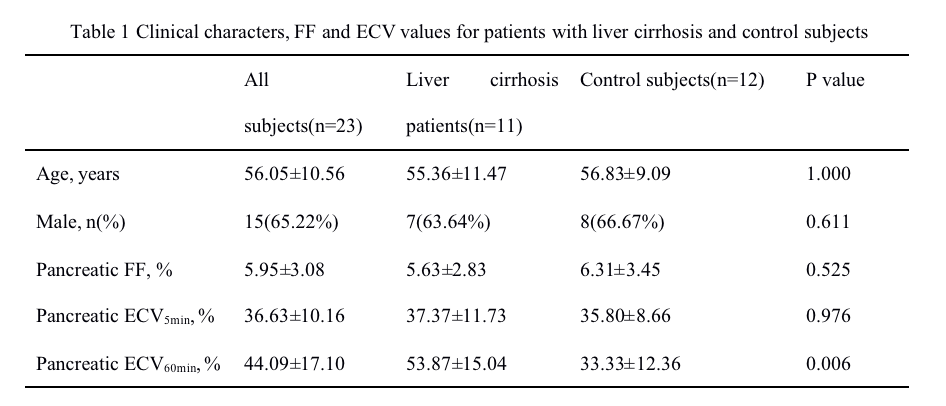
Table 1 Clinical characters, FF and ECV values for patients with liver cirrhosis and control subjects
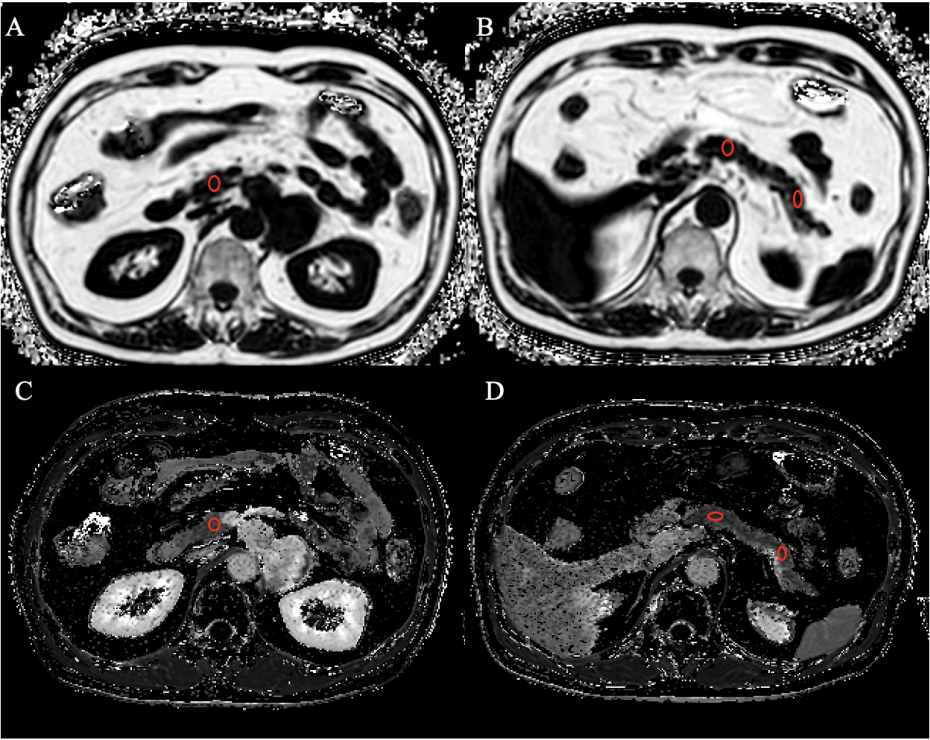
Figure 1. 2D regions of interest (ROIs) were placed (by two radiologists) at the head, body and tail regions of pancreas on the fat fraction maps (A and B) and ECV maps (C and D) for quantitative measurements. The mean value of three ROIs was used as the value of the whole pancreas. ROIs area were approximately 25-100 mm2.
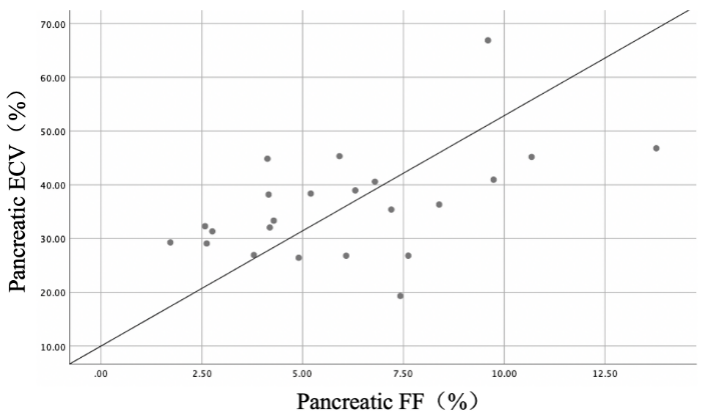
Figure 2. Pancreatic FF was associated with pancreatic ECV of 5 min after administration (r=0.435, P=0.038).
DOI: https://doi.org/10.58530/2022/3813