3811
Brain T1ρ quantification at the first 5T whole-body MR system: a pilot study1Paul C. Lauterbur Research Center for Biomedical Imaging,Shenzhen Institute of Advanced Technology, Chinese Academy of Sciences, Shenzhen, China, 2National Innovation Center for Advanced Medical Devices, Shenzhen, China, 3United Imaging Healthcare, Shanghai, China, 4Research Center for Medical AI,Shenzhen Institute of Advanced Technology, Chinese Academy of Sciences, Shenzhen, China
Synopsis
MR quantitative T1ρ mapping has gained increasing attention due to its capability in studying low-frequency motional processes and chemical exchange in biological tissues. At ultra-high fields, the chemical exchange and proton diffusion in biological tissues should be more prominent. In this study, for the first time, we aim to test the feasibility of T1ρ mapping of brain at 5T and evaluate the T1ρ values estimated from datasets using both 3T and 5T scanners.
INTRODUCTION
T1ρ quantification has been successfully applied in detecting low-frequency motional processes and chemical exchange in biological tissues [1]. Recent studies have shown that the ultra-high magnetic field is helpful to detect the exchange from certain molecules such as glutamine and glucose [2, 3]. However, T1ρ quantification of humans at ultra-high magnetic fields has been rarely reported. This year, the first 5T whole-body MR system (uMR Jupiter, United Imaging Healthcare, Shanghai, China) was delivered. We implemented the T1ρ mapping sequence at this system, using a spin-lock preparation pulse followed by a gradient recalled echo (GRE) readout. The sequence was applied to the human brain. In this study, we report the T1ρ quantification of the human brain at 5T for the first time and compare the results with 3T.METHODS
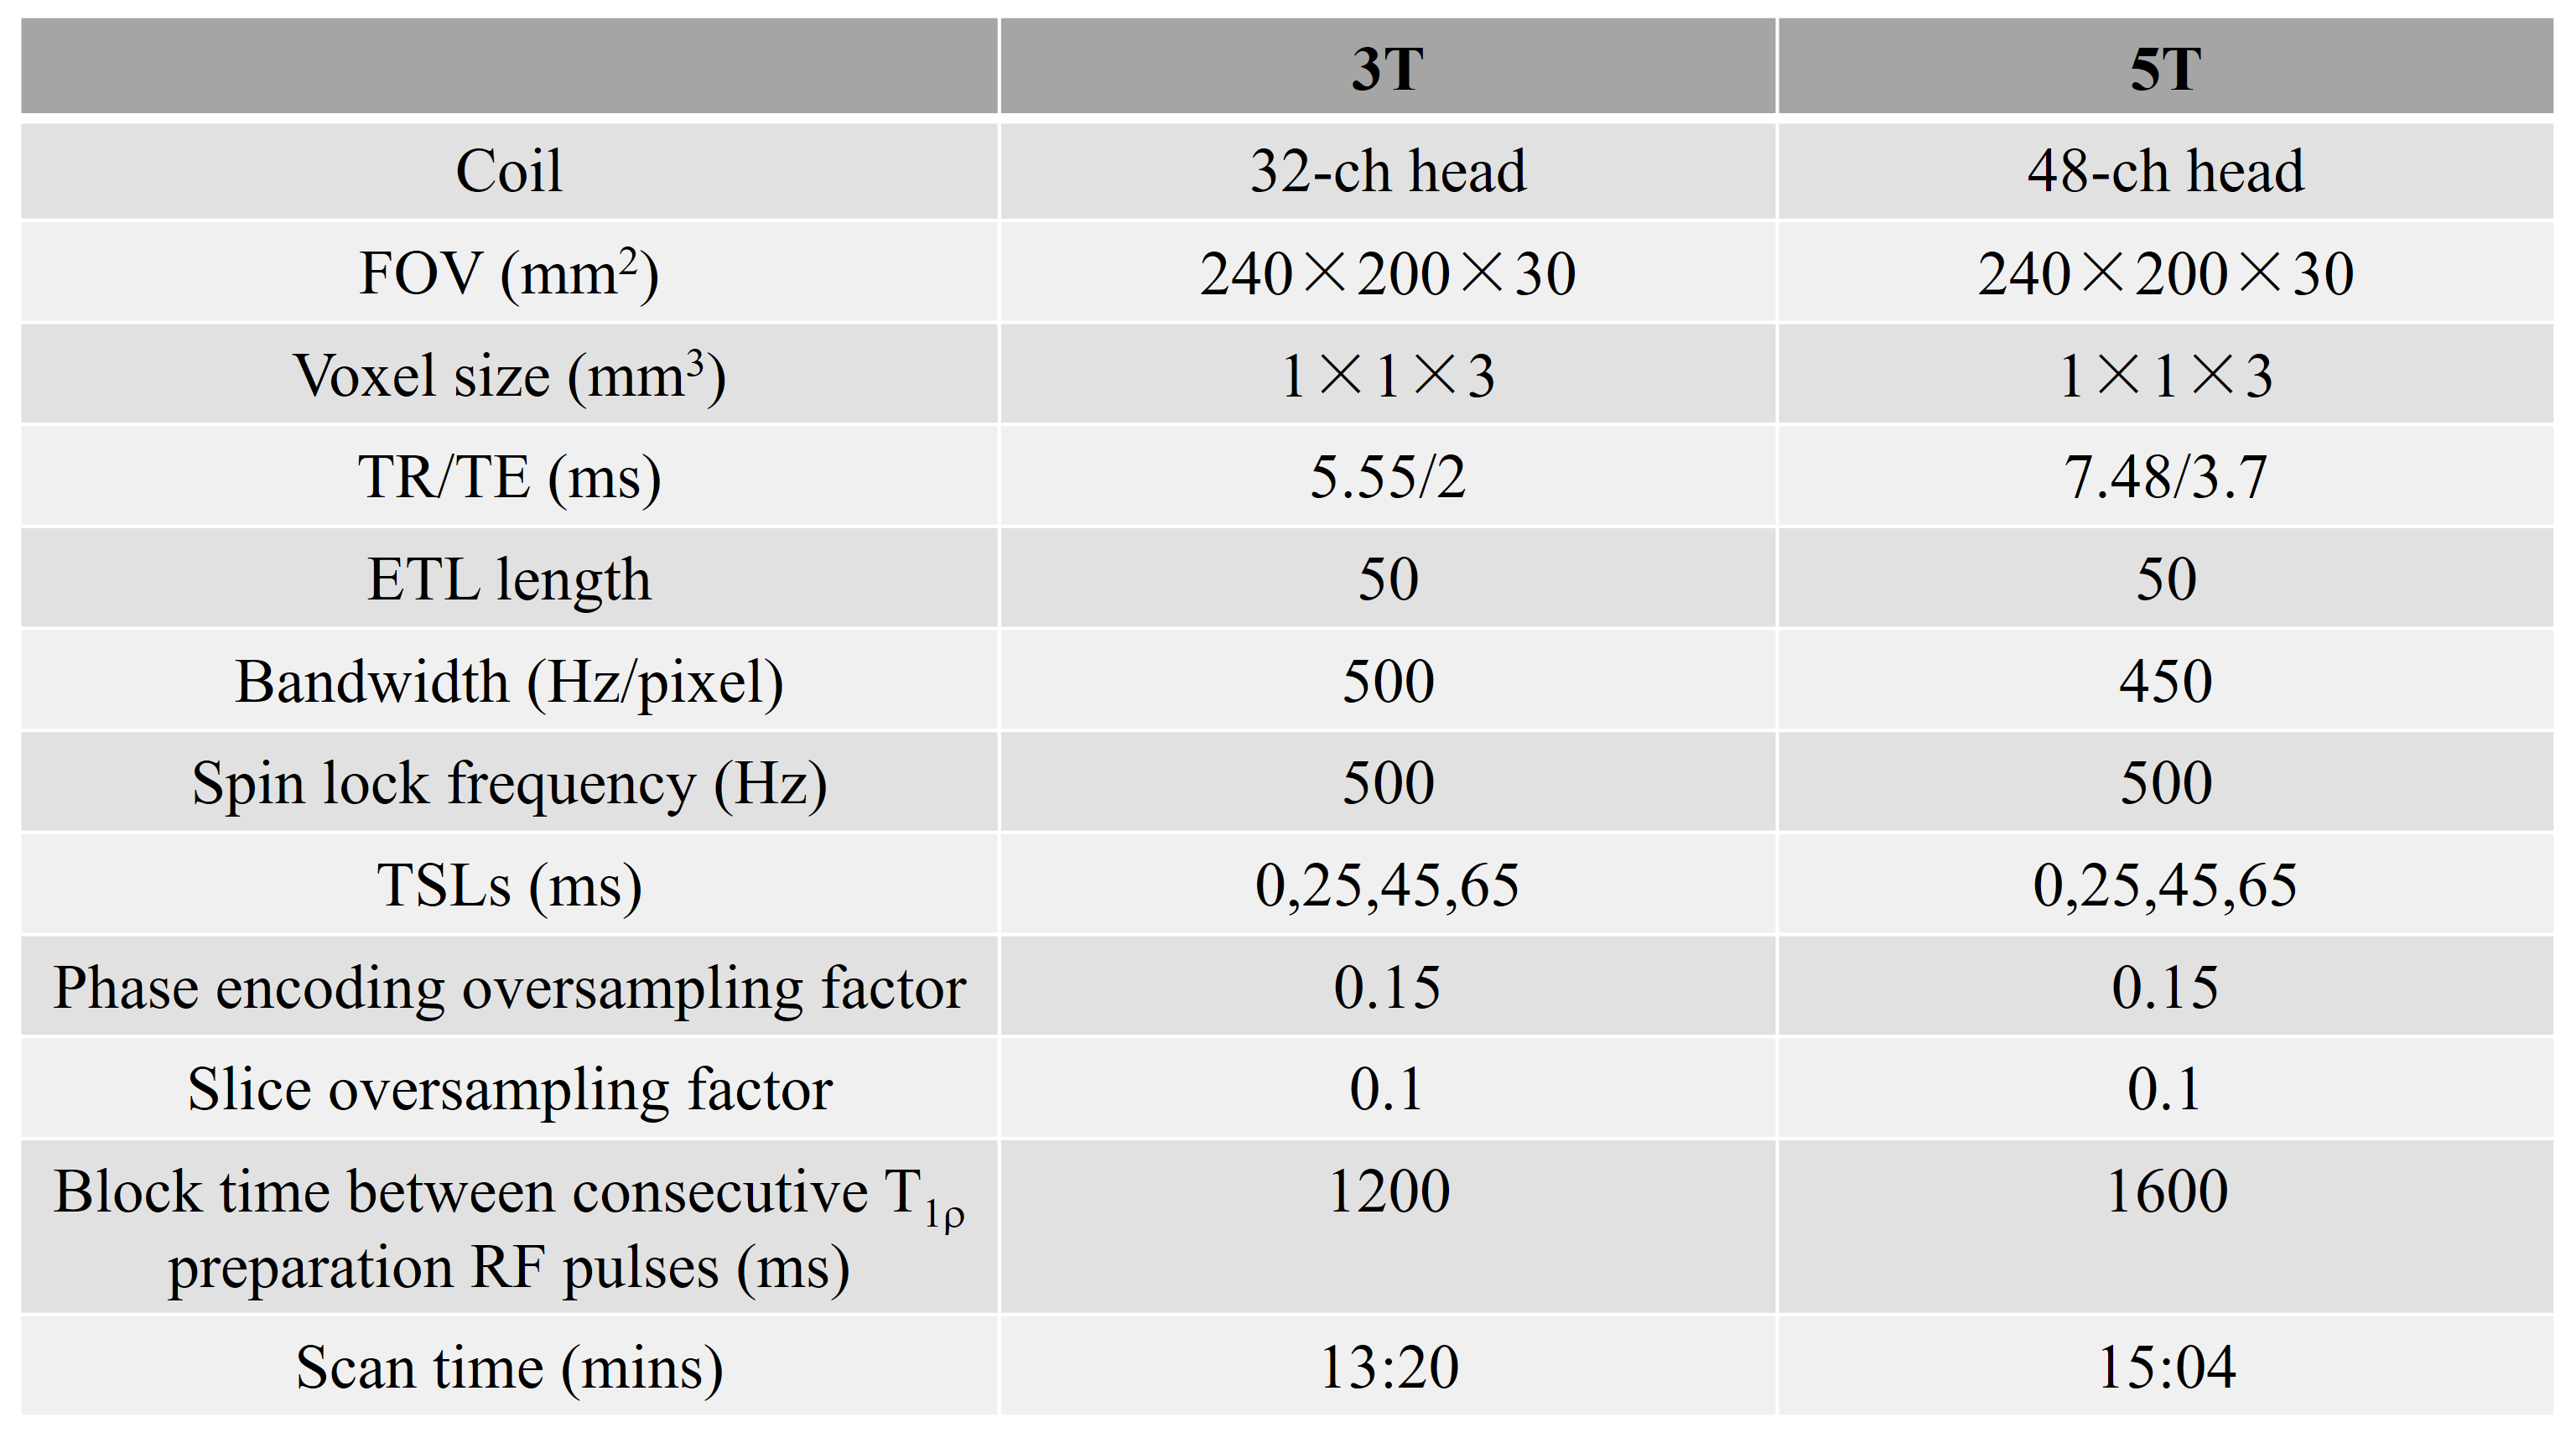
An adiabatically prepared constant-amplitude on-resonant spin-lock approach was used for T1ρ preparation to compensate for the B0 and B1 inhomogeneities [4] and was embedded to a 3D GRE sequence on both 3T and 5T MR scanners (uMR 890/3T, uMR Jupiter/5T, United Imaging Healthcare, Shanghai, China). Table 1 illustrates the imaging parameters for both 3T and 5T experiments. Five healthy volunteers (age 30±5) were recruited (IRB proved). The T1ρ measurements were estimated using the monoexponential model [5, 6]: $$M=M_0exp{(-TSL_n/T_{1\rho})_{n=1,2,...,N}} $$where M is the image intensity obtained at varying spin lock times (TSLs), M0 is the baseline image intensity without the application of the spin-lock pulse. N is the total number of TSLs.The T1ρ values in three manually drawn ROIs for each volunteer were calculated at 5T and compared with that calculated at 3T using the Wilcoxon signed-rank test. Statistical significance was set as P < 0.05.
RESULTS and DISCUSSION
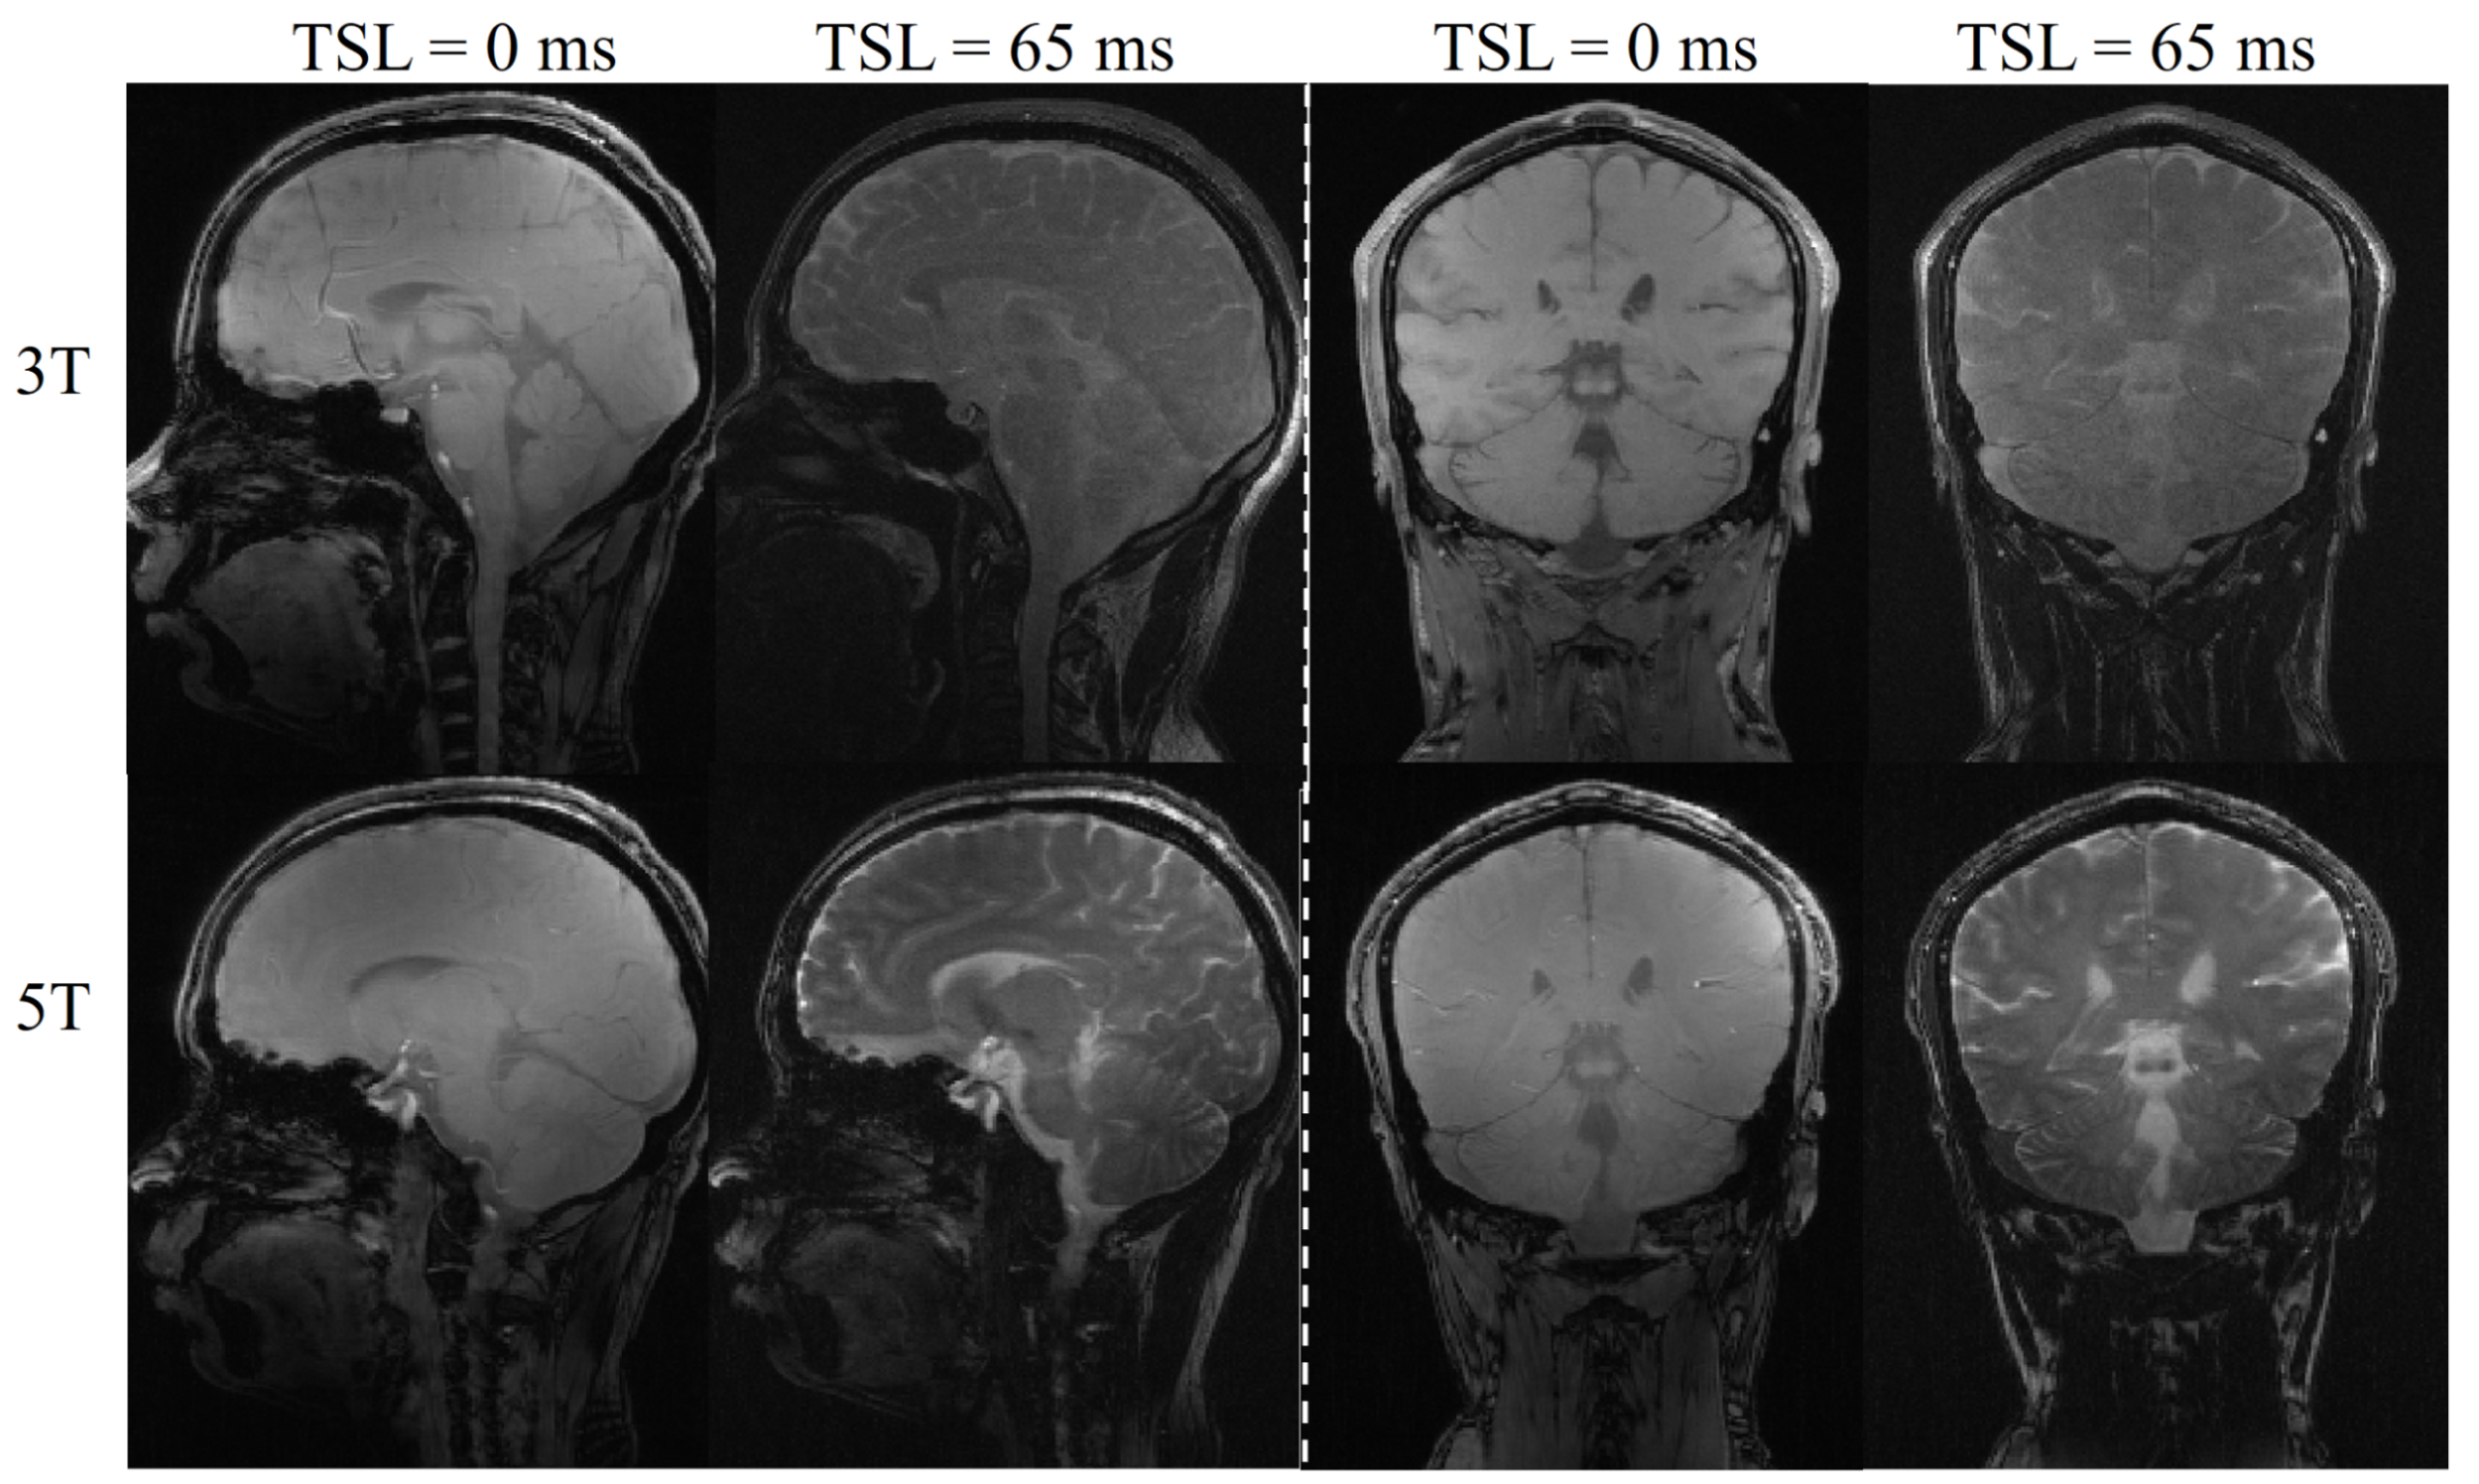
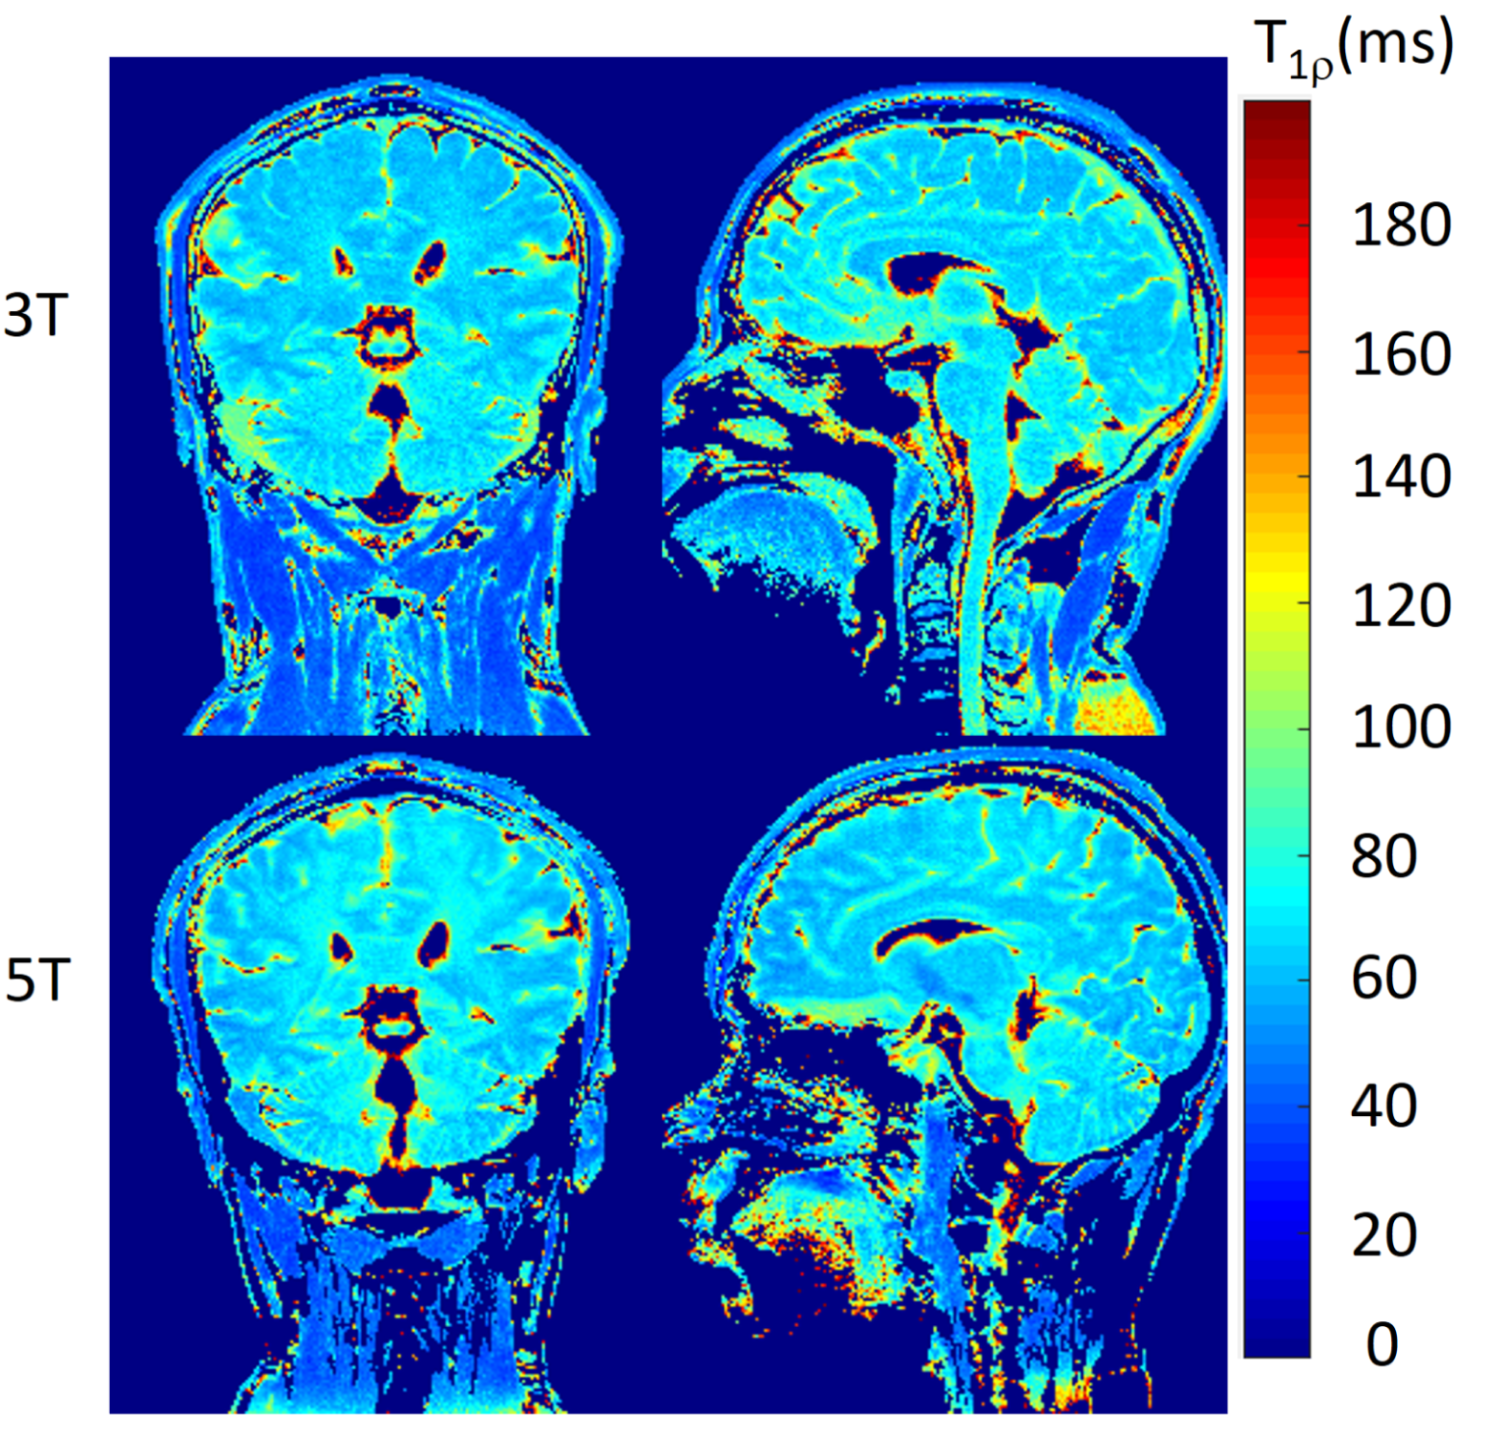
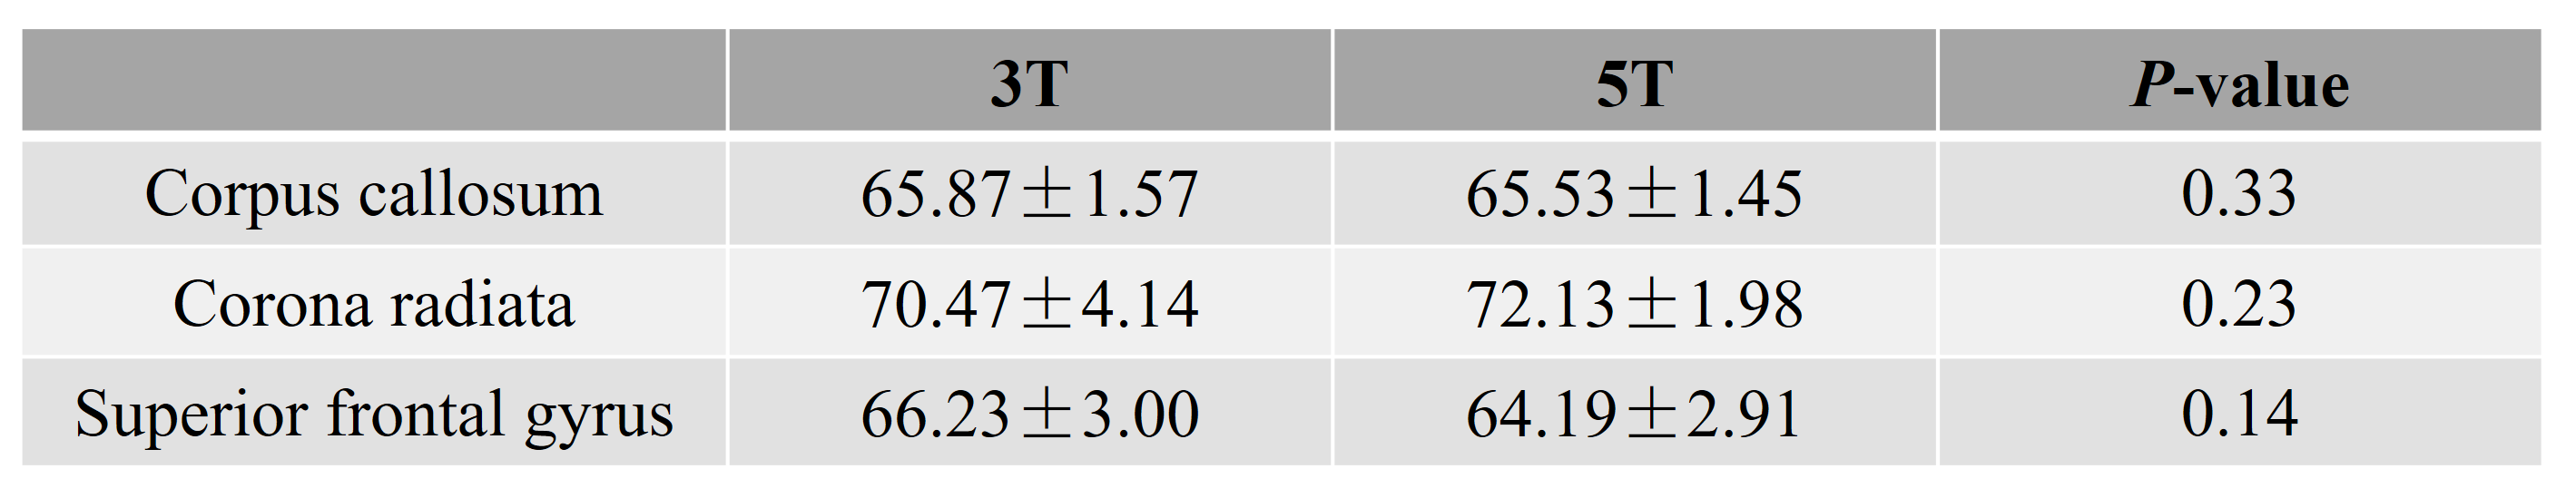
Figure 1 shows the T1ρ-weighted images at different TSLs from one volunteer collected at 3T and 5T scanners, respectively. The corresponding T1ρ maps are shown in Figure 2. Visible noise can be seen in T1ρ-weighted images at 3T, especially for the images with a relatively high TSL (e.g., TSL = 65ms). Hereby, the corresponding T1ρ maps of 3T are also noisier compared with the maps at 5T. This observation is consistent with the expectation that images acquired at 5T have higher SNR than 3T. Table 2 shows the mean T1ρ values of gray matter and white matter in selected ROIs at 3T and 5T. For the data presented in the current study, no significant difference is observed between T1ρ values at 3T and 5T for all the selected ROIs (all P > 0.05). T1ρ values are in the same range as previous literature, in which the obtained T1ρ values are in the order of 40 ms ~ 100 ms for gray matter and white matter at 7T and 9.4T [4, 7].CONCLUSION
The SNRs of T1ρ-weighted images and T1ρ maps were improved at 5T, which benefits the analysis and dispersion-related studies. The T1ρ values at 5T show no significant difference with those obtained at 3T.Acknowledgements
This work is supported in part by the National Natural Science Foundation of China under grant nos. 61771463,81971611, National Key R&D Program of China nos. 2020YFA0712202, 2017YFC0108802.References
1. Wang YX, Zhang Q, Li X, Chen W, Ahuja A, Yuan J. T1ρ magnetic resonance: basic physics principles and applications in knee and intervertebral disc imaging. Quant Imaging Med Surg 2015;5(6):858-885.
2. Jin T, Iordanova B, Hitchens TK, Modo M, Wang P, Mehrens H, Kim SG. Chemical exchange-sensitive spin-lock (CESL) MRI of glucose and analogs in brain tumors. Magn Reson Med 2018;80(2):488-495.
3. Paech D, Schuenke P, Koehler C, Windschuh J, Mundiyanapurath S, Bickelhaupt S, Bonekamp D, Baumer P, Bachert P, Ladd ME, Bendszus M, Wick W, Unterberg A, Schlemmer HP, Zaiss M, Radbruch A. T1ρ-weighted Dynamic Glucose-enhanced MR Imaging in the Human Brain. Radiology 2017;285(3):914-922.
4. Herz K, Gandhi C, Schuppert M, Deshmane A, Scheffler K, Zaiss M. CEST imaging at 9.4 T using adjusted adiabatic spin-lock pulses for on- and off-resonant T1ρ-dominated Z-spectrum acquisition. Magn Reson Med 2019;81(1):275-290.
5. Zhu Y, Liu Y, Ying L, Peng X, Wang YJ, Yuan J, Liu X, Liang D. SCOPE: signal compensation for low-rank plus sparse matrix decomposition for fast parameter mapping. Phys Med Biol 2018;63(18):185009.
6. Zhu Y, Liu Y, Ying L, Qiu Z, Liu Q, Jia S, Wang H, Peng X, Liu X, Zheng H, Liang D. A 4-minute solution for submillimeter whole-brain T1ρ quantification. Magn Reson Med 2021;85(6):3299-3307.
7. Schuenke P, Koehler C, Korzowski A, Windschuh J, Bachert P, Ladd ME, Mundiyanapurath S, Paech D, Bickelhaupt S, Bonekamp D, Schlemmer HP, Radbruch A, Zaiss M. Adiabatically prepared spin-lock approach for T1ρ-based dynamic glucose enhanced MRI at ultrahigh fields. Magn Reson Med 2017;78(1):215-225.
Figures