3804
Axon radii estimation from dMRI data acquired from a non-fancy MRI scanner
Debdut Mandal1, Lipeng Ning2, and Yogesh Rathi2
1Electronics and Electrical Communication Engineering, Indian Institute of Technology Kharagpur, Kharagpur, India, 2Harvard Medical School, Boston, MA, United States
1Electronics and Electrical Communication Engineering, Indian Institute of Technology Kharagpur, Kharagpur, India, 2Harvard Medical School, Boston, MA, United States
Synopsis
Noninvasive measurement of axon radii has always been challenging using in vivo diffusion MRI (dMRI) data. Although dMRI allows estimation of the effective radius, a very high gradient strength scanner is required to acquire the data. In our proposed method, we overcome this limitation by using analytical methods to accurately predict the signal at high b-values from reasonably lower b-value data that can be obtained from a Prisma-like scanner. Our findings, both in synthetic data and in vivo dMRI data, show that estimating axon radii reliably is possible using dMRI data with a certain SNR level.
Introduction
Axon radii play a crucial role in brain function. Histological results suggest axon radii to be from 0.1μm to 5μm1,2. To measure axon radii in-vivo, diffusion weighted MRI (dMRI) is typically used. The estimated radii using dMRI data ranges from 3μm to 13μm3,4,5. One major requirement for all these methods is that the dMRI data acquisition has to be at very high b-values (b>6000 $$$s/mm^2$$$), which requires a very high gradient strength scanner available only at a few locations in the world. We address this challenge and develop a novel method to estimate axon radii from relatively lower b-value data (b <= 5000 $$$s/mm^2$$$) acquired from any scanner with gradient strength of 80 mT/m (e.g. Prisma) which are more widely available.Method
dMRI signal contains contributions from both intra- and extra-axonal space, especially at lower b-values. However, at very high b-values (b>6000 $$$s/mm^2$$$), the signal contribution comes only from intra-axonal space6, enabling reliable estimation of the axon radii. However, dMRI data with only lower b-values (<= 5000) can be obtained on modern clinical scanners. Consequently, we propose a novel method to use the information from lower b-values and predict the signal at high b-values which can then be used to estimate the axon radii.- Signal prediction using SR: To predict the dMRI signal at different higher b-values (from lower b-values), we use the spherical ridgelets (SR) framework7 with a gradient direction specific biexponential term to model signal attenuation with increasing b-values8. While the SR term ensures consistency of the signal in the spherical domain, the biexponential term ($$$f_{\alpha,\beta,w}(b) = w.exp(-b\alpha) + (1-w).exp(-b\beta) $$$) ensures consistency of the signal decay. Since the SR framework is analytical, once the SR coefficients and biexponential parameters are estimated from data at lower b-values, we can extrapolate the signal to any desired higher b-value (and any gradient direction). The SR coefficients as well as the parameters of the biexponential function are estimated using an ADMM algorithm as described in [8].
- Radii Estimation: After estimating signals at higher b values (>6000), we powder average them over diffusion encoding orientations to factor out orientation dispersion, and calculate the radii using the formula: $$$r_{MR} = (\frac{48}{7}\delta(\Delta-\delta/3)D_0 D_a^\perp)^{\frac{1}{4}}$$$. The coefficient $$$\beta$$$ is given by $$$\beta = \sqrt{\frac{\pi}{4}}\cdot f/(D_a^{\parallel})^{\frac{1}{2}} $$$, where $$$f$$$ is the $$$T_2$$$-weighted axonal water fraction and $$$D_a^\perp$$$, $$$D_a^{\parallel}$$$,$$$D_0$$$ are radial intra axonal diffusivity, parallel intra axonal diffusivity and intrinsic diffusivity of axoplasm6.
Results
To evaluate the proposed algorithm, we simulated diffusion signal using the MISST toolbox9, for a PGSE pulse sequence at 256 gradient directions, with (i) δ/Δ = 15.1/59.2 ms, b values of {1000, 2000, 3000, 5000, 10000, 12000, 18756} $$$s/mm^2$$$ (b at 5000 corresponds to gradient strength (G) of 80mT/m), and (ii) δ/Δ = 12.9/21.8 ms with the same b values (b=18756 corresponds to $$$G_{max}$$$ of 300mT/m), for cylinder with radii ranging from 0.4 to 5 µm and intracellular volume fraction (ficvf) between 0.4 to 0.75. We also added random gaussian noise (up to $$$\sigma_{noise,max} = 0.08$$$) to the synthetic data to mimic in-vivo data SNR. For b=5000, $$$\sigma = 0.06$$$ corresponds to an average SNR of 3.35, whereas a $$$\sigma=0.02$$$ to SNR=10.06. Using the SR framework we estimated the SR coefficients (and those of the biexponential model) using data with b-values of 1000, 3000, 5000 (case 1) and 1000, 2000, 3000 (case2) separately. The signal at higher b-values (> 5000) was then predicted for calculating axon radii. Fig. 1 shows the estimated axon radii for different configurations (ficvf values) and for case 1 (with high gradient strength). Notice that despite high noise, reliable estimation of axon radii is obtained. Fig 2 shows results for settings that can be typically obtained using a Prisma scanner. Reliable estimates for axon radii are obtained above the resolution limit (radii > 2.5 μm) for a Prisma scanner10, despite high noise levels. Fig. 3 shows results for case 2 when b <= 3000 is used. As can be seen, very high SNR is needed to obtain a proper estimate for the axon radii. Fig 4 shows results from in-vivo data dataset from 3 HCP subjects4 with acquisition parameters as in the simulated data with δ/Δ = 12.9/21.8 ms (data only up to b=5000 is used). The estimated radii in all three subjects are in the known range in the corpus callosum as shown in [6]. A few voxels show very low radii, which could potentially be due to partial volume, biology and/or increased noise in the data. Finally, Fig. 5 shows results on in-vivo data obtained from a Prisma scanner (spatial resolution 2.5mm isotropic, δ/Δ = 15.1/59.2 ms, b= 1000, 3000 and 5000 $$$s/mm^2$$$, $$$G_{max} = 80mT/m$$$), demonstrating the potential use of the proposed technique for robust estimation of axon diameter with data obtained from a more widely available Prisma scanner.Acknowledgements
No acknowledgement found.References
- Aboitiz F, Scheibel AB, Fisher RS, Zaidel E. 1992. Fiber composition of the human corpus callosum. Brain Research 598:143–153.
- Caminiti R, Ghaziri H, Galuske R, Hof PR, Innocenti GM. 2009. Evolution amplified processing with temporally dispersed slow neuronal connectivity in primates. PNAS 106:19551–19556.
- Alexander DC, Hubbard PL, Hall MG, Moore EA, Ptito M, Parker GJM, Dyrby TB. 2010. Orientationally invariant indices of axon diameter and density from diffusion MRI. NeuroImage 52:1374–1389.
- McNab JA, Edlow BL, Witzel T, Huang SY, Bhat H, Heberlein K, Feiweier T, Liu K, Keil B, Cohen-Adad J, Tisdall MD, Folkerth RD, Kinney HC, Wald LL. 2013. The human connectome project and beyond: initial applications of 300mT/m gradients. NeuroImage 80:234–245.
- Drobnjak I, Zhang H, Ianus¸ A, Kaden E, Alexander DC. 2016. PGSE, OGSE, and sensitivity to axon diameter in diffusion MRI: insight from a simulation study. Magnetic Resonance in Medicine 75:688–700.
- Veraart J, Nunes D, Rudrapatna U, Fieremans E, Jones DK, Novikov DS, et al. Noninvasive quantification of axon radii using diffusion MRI. Elife. 2020;9: e49855
- Michailovich O, Rathi Y, Dolui S. Spatially regularized compressed sensing for high angular resolution diffusion imaging. IEEE Trans Med Imaging. 2011;30: 1100–1115.
- Rathi Y, Michailovich O, Laun F, Setsompop K, Grant PE, Westin C-F. Multi-shell diffusion signal recovery from sparse measurements. Med Image Anal. 2014;18: 1143–1156.
- Drobnjak I, Siow B, Alexander DC. 2010. Optimizing gradient waveforms for microstructure sensitivity in diffusion-weighted MR. Journal of Magnetic Resonance 206:41–51.
- Nilsson M, Lasič S, Drobnjak I, Topgaard D, Westin C-F. Resolution limit of cylinder diameter estimation by diffusion MRI: The impact of gradient waveform and orientation dispersion. NMR Biomed. 2017;30.
Figures
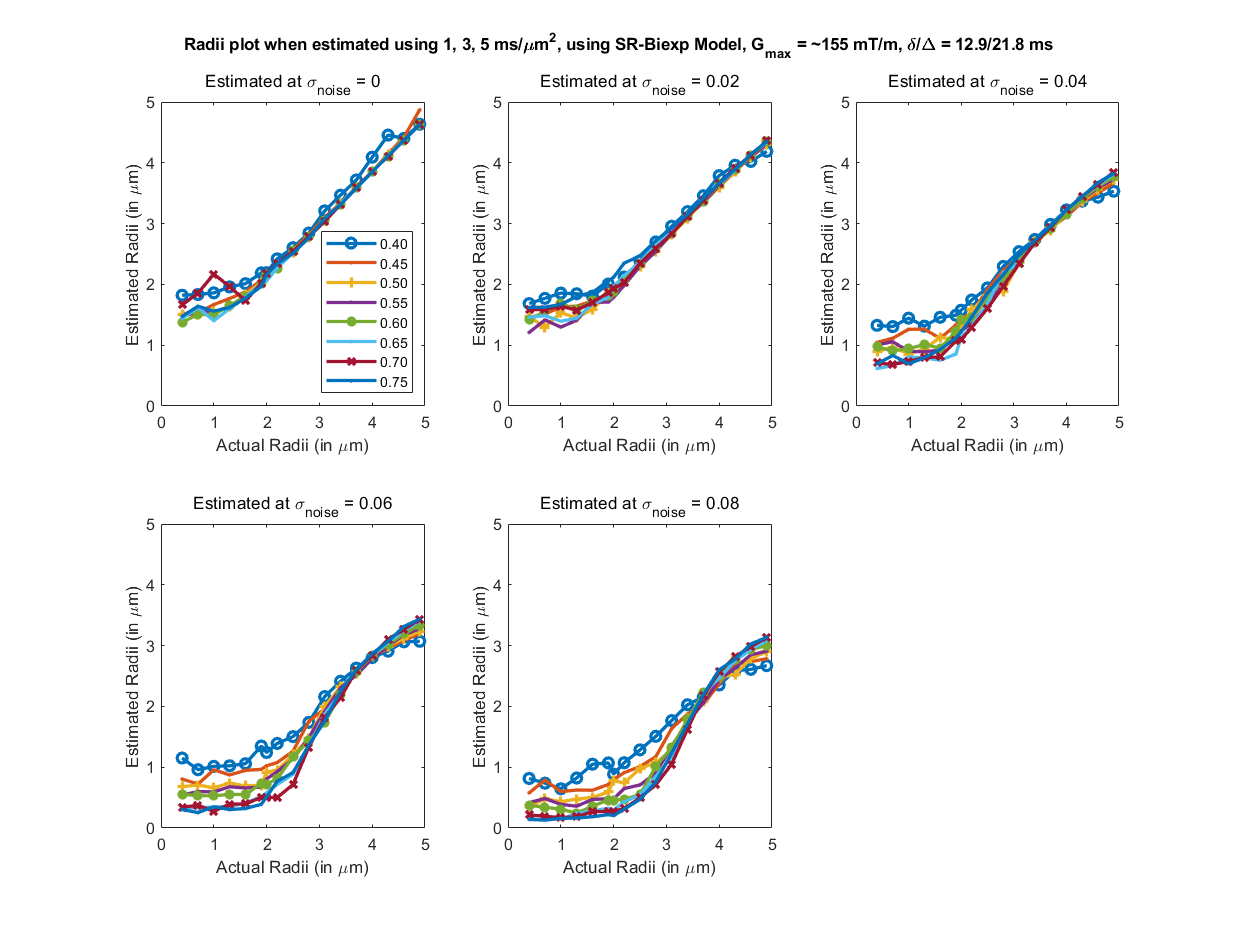
Fig 1. Estimated axon radii for different intra-cellular volume fraction (ficvf) (color lines) and 5 different noise levels, with acquisition parameters listed above (b=1,3,5 $$$ms/μm^2$$$). Highly accurate estimation of the axon radii for this configuration can be obtained for this setting.
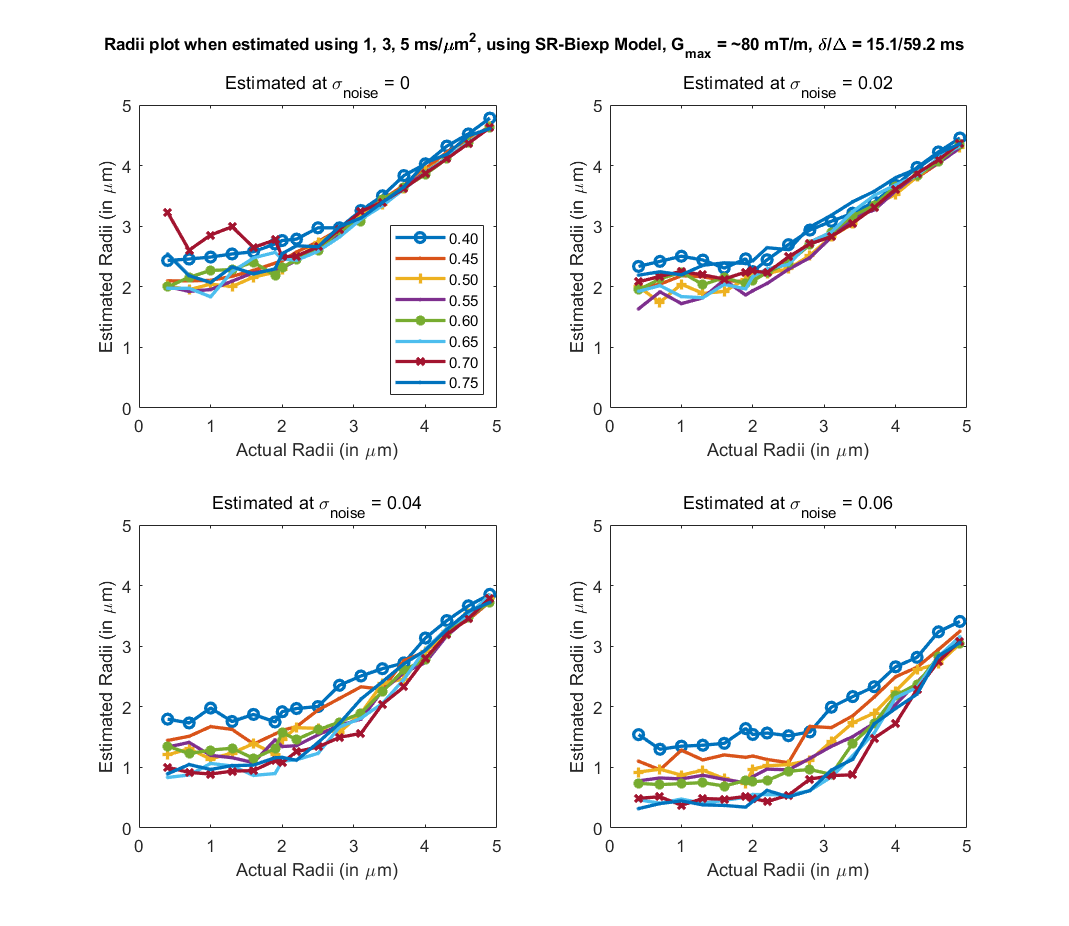
Fig 2. Estimated axon radii for different intra-cellular volume fraction (ficvf) (color lines) and 4 different noise levels, with acquisition parameters that can be used on a Prisma scanner (b=1,3,5 $$$ms/μm^2$$$). Good estimate of the axon radii can be made for a realistic noise level of sigma = 0.04.
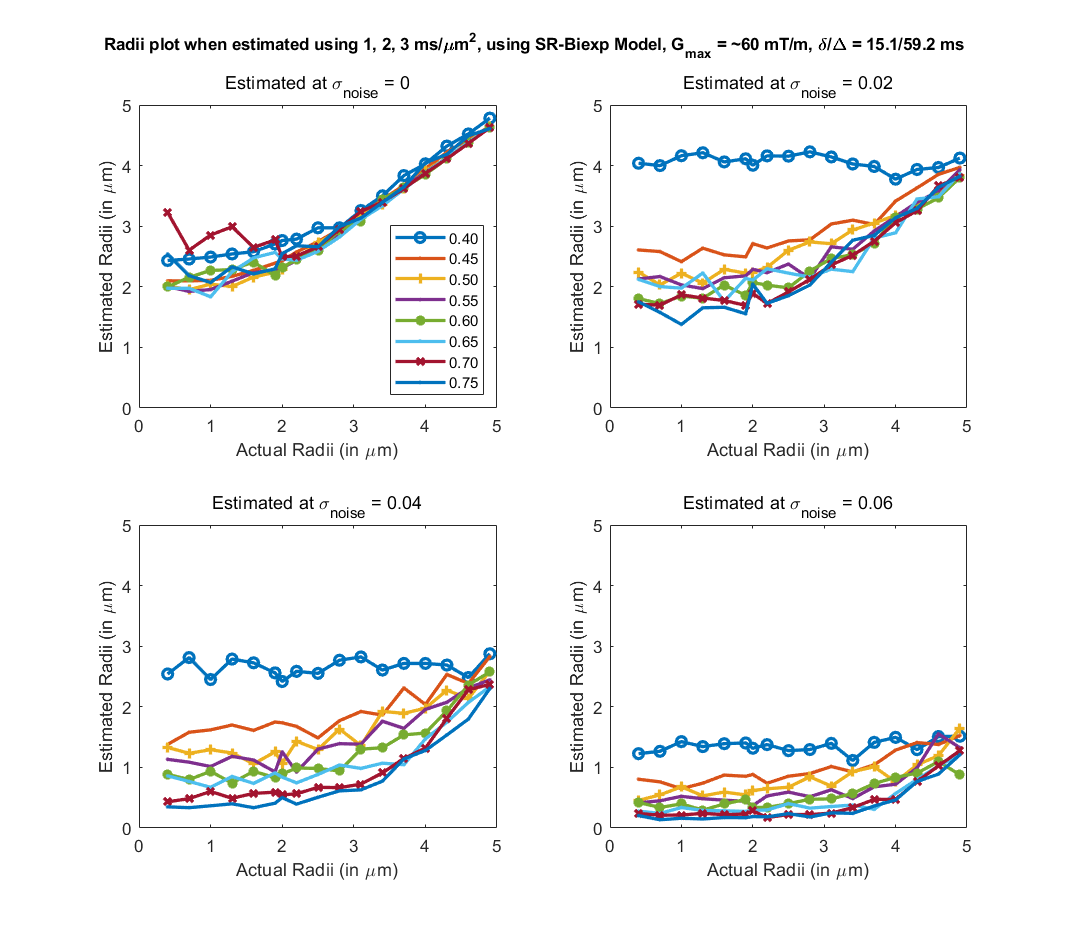
Fig 3. Estimated axon radii for different intra-cellular volume fraction (ficvf) (color lines) and 4 different noise levels, with acquisition parameters listed above (b=1,2,3 $$$ms/um^2$$$). Reasonable estimates for axon radii for this configuration can only be obtained at very high SNR.
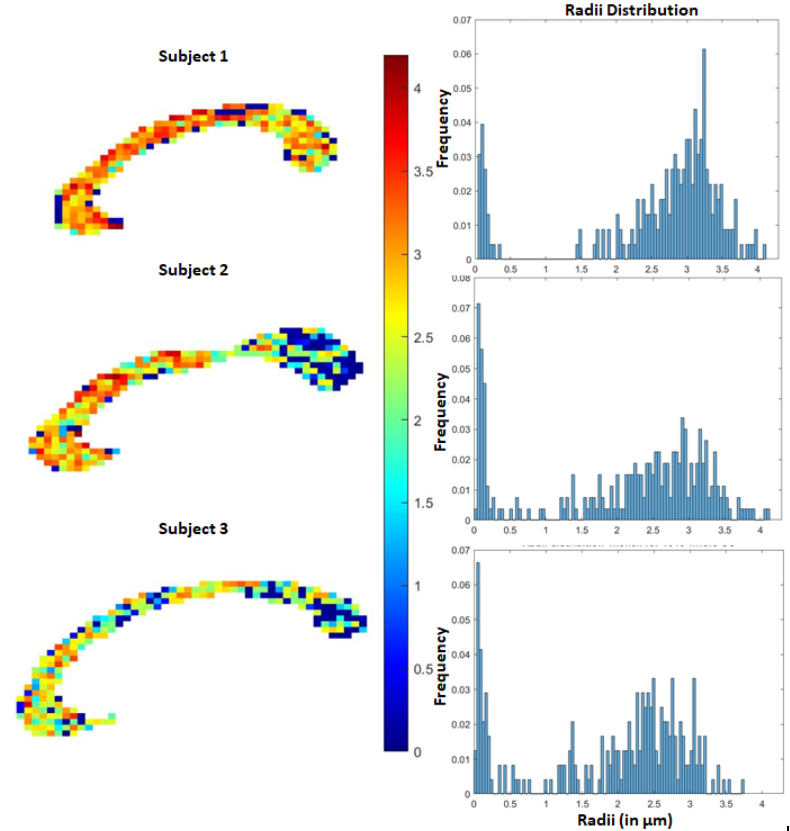
Fig 4. In-vivo estimation of the axon radii in the corpus callosum using the proposed SR method. Estimations (histogram) are very similar to that reported in [6] where data from very high b-values was acquired from a connectome scanner. Our method on the hand uses data only up to b=5000 $$$s/mm^2$$$.
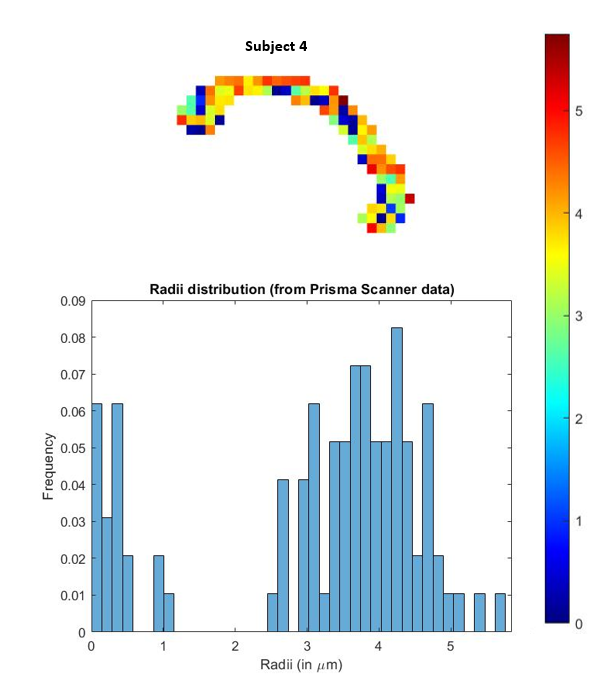
Fig 5. In-vivo estimation of the axon radii in the corpus callosum using the proposed SR method with data acquired from a Siemens Prisma scanner. Estimations (histogram) are very similar to that reported in [6] where data from very high b-values was acquired from a connectome scanner. Our method on the hand uses data only up to b=5000 $$$s/mm^2$$$.
DOI: https://doi.org/10.58530/2022/3804