3803
Subtyping Parkinson’s disease by linking non-motor characteristics and brain functional connectome
Yao Zeng1, Chenfei Ye2, Junyan Sun3, Ting Ma1, and Tao Wu3
1Department of Electronic and Information Engineering, Harbin Institute of Technology at Shenzhen, Shenzhen, China, 2Peng Cheng Laboratory, Shenzhen, China, 3National Clinical Research Center for Geriatric Disorders, Xuanwu Hospital Capital Medical University, Beijing, China
1Department of Electronic and Information Engineering, Harbin Institute of Technology at Shenzhen, Shenzhen, China, 2Peng Cheng Laboratory, Shenzhen, China, 3National Clinical Research Center for Geriatric Disorders, Xuanwu Hospital Capital Medical University, Beijing, China
Synopsis
Since the heterogeneity of non-motor disorders in Parkinson's patients, subtyping research will facilitate the development of clinical diagnosis and treatment. We applied the sparse canonical correlation analysis method on clinical scales and resting-state brain fMRI data, to extract the typical variables for subtyping. In this data-driven study, we found that four PD subtypes with varying cognitive and psychological phenotypes demonstrate unique patterns of brain functional connectivity, which may underly the mechanism of PD heterogeneous non-motor symptoms.
Introduction
Late-stage PD patients have a great risk of physical and psychological problems such as cognitive impairment, anxiety, and depression1. Non-motor symptoms (NMS) usually appear earlier than motor deficits and seriously affect the patients’ quality of life2, which highlights the importance of NMS in both diagnosis and management. Subtyping research is common in discovering biological targets associated with specific symptoms. However, while how to stratify PD motor symptoms has been largely studied3, 4, there is a lack of research on the complex and diverse non-motor classification5. The functional connectome has great potential to dig out underlying subtypes, with disruption in functional connectivity varying considerably on disease severity and phenotypes6. In this study, we focused on stratifying PD subtypes with varying cognitive and psychological phenotypes by using the multivariate correlation between symptoms and brain functional connectivity.Methods
Here, we retrospectively selected 54 Parkinson's patients (PDs) and 50 healthy controls (HCs) from Xuanwu Hospital, Beijing, China. Each patient’s information consisted of two parts: clinical assessments and MRI data. The performance of PD in non-motor characteristics was quantified by six clinical assessments scores, from Unified Parkinson’s Disease Scale I (UPDRS1), Hamilton Depression Scale (HAMD), Montreal Cognitive Assessment (MoCA), Pittsburgh Sleep Quality Index (PSQI), and Autonomic Symptom (AS). All the subjects underwent Siemens Skyra 3T MR scans with MPRAGE sequences (TR/TE =2530/2.98, Fov = 224 x 256 mm2 , slice thickness = 1 mm, slice number = 192, flip angle = 7°,voxel size = 1x1x1mm3 ) and bold-EPI sequences (TR/TE = 2000/30, flip angle = 90°, slice thickness = 3mm,voxel size = 3.44×3.44×3.6mm3, image size = 64×64×35, timepoints = 176).The preprocessing of the MRI data was completed by the fMRI Data Processing Toolbox (http://rfmri.org/dpabi)7. Each anatomical image was divided into 90 regions by the AAL template, then registered to the functional image for fMRI segmentation. The individual functional connectivity (FC) was obtained by calculating the Pearson correlation coefficient of any two regions’ signal strength, which was represented by a 90×90 matrix. Hierarchical clustering was implemented in the average FC matrix of the HC population, to dig out brain intrinsic networks.
The characteristics in NMS of 54 Parkinson's patients were combined to form a 54×6 matrix (54 PD patients and 6 clinical assessment scores), and the brain connections were combined to form a 54×4005 matrix (number of pairwise FC). Sparse canonical correlation analysis (sCCA)8 was used to calculate sparse canonical variates, which linked NMS and FC. We determined the subtyping dimensions by two steps: 1. comparing the covariance explained to find the variates that contained large original clinical information, 2. performing permutation test to find the variates that significantly reflected the correlation between two data sets. Then, 54 PDs were divided into different subtypes. ANOVA and Post-hoc analysis were performed across the groups in assessments, while the two-sample t-test with False Discovery Rate (FDR) was carried between each subtype and HCs in FC matrixes.
Results
Seven intrinsic connectivity networks, including the somatosensory network (SMT), dorsal medial default mode network (DDM), frontoparietal network (FPT), temporal default mode network (TDM), auditory network (AUD), visual network (VIS), and subcortical network (SBC) were obtained. The canonical variate I and III were finally chosen as the two dimensions for subtyping, which related to depression and cognition, respectively (see Figure1). Figure2 showed the subtypes’ non-motor features, while Figure3 displayed the specific disconnections in each subtype compared with HCs. The subtypes had statistically significant differences in the first five clinical scales (p < 0.05), but not in the Autonomic Symptom (AS) scores (p=0.862). The score fluctuation on AS was not closely connected with the changes in FC. And statistically significant changes in FC patterns were found in the first three subtypes (PFDR<0.05), with the fourth subtype showing a trend toward significance (Puncorrected<0.05). Table 2 summarized the salient features of the subtypes in NMS and the corresponding functional networks impairments. Depression stood out in the subtypes I and II, with decreased connectivity between the DDM, FPT, TDM, VIS, and SBC. Both subtypes II and IV showed cognitive dysfunction and disconnections between the FPT, DDM, and SBC.Discussion
By using sCCA to link the dimensions of NMS and FC, we observed the FC-related signatures for varying non-motor impairments of PDs. The weakened connection from VIS and SBC to other brain networks was common, illustrating that the affected subcortical nucleus seriously hindered the brain functional activities of PD. Though there was generally decreased FC among all subtypes, varying non-motor clinical phenotypes across groups correspond to specific functional network reorganization. The FC features related to cognition and depression both had decreased connection between the FPT, DDM, and SBC. Specifically, cognition was characterized by abnormal connectivity within DDM, in contrast to depression with decreased connectivity within TDM. The results supported the possibility that FPT and default mode network may be the neurobiological mechanism underlying vulnerability to psychological and psychiatric symptoms. In this study, by the multivariate analysis method (sCCA), we obtained the cognition and depression-related abnormal FC patterns, locating symptom-specific biological targets to promote the development of diagnosis and treatment.Acknowledgements
This study is supported by grants from the Basic Research Foundation of Shenzhen Science and Technology Stable Support Program (GXWD20201230155427003-20200822115709001).References
1. Stoker TB, Barker RA. Recent developments in the treatment of Parkinson's Disease. F1000Res. 2020;9.2. Pfeiffer RF. Non-motor symptoms in Parkinson's disease. Parkinsonism Relat Disord. 2016;22 Suppl 1:S119-22.
3. Connolly BS, Lang AE. Pharmacological treatment of Parkinson's disease: a review. JAMA. 2014;311(16):1670-83.
4. Eisinger RS, Hess CW, Martinez-Ramirez D, Almeida L, Foote KD, Okun MS, et al. Motor subtype changes in early Parkinson's disease. Parkinsonism Relat Disord. 2017;43:67-72.
5. Liu X, Le W. Profiling Non-motor Symptoms in Monogenic Parkinson's Disease. Front Aging Neurosci. 2020;12:591183.
6. Tinaz S. Functional Connectome in Parkinson's Disease and Parkinsonism. Curr Neurol Neurosci Rep. 2021;21(6):24.
7. Yan CG, Wang XD, Zuo XN, Zang YF. DPABI: Data Processing & Analysis for (Resting-State) Brain Imaging. Neuroinformatics. 2016;14(3):339-51.
8. Xia CH, Ma Z, Ciric R, Gu S, Betzel RF, Kaczkurkin AN, et al. Linked dimensions of psychopathology and connectivity in functional brain networks. Nat Commun. 2018;9(1):3003.
Figures
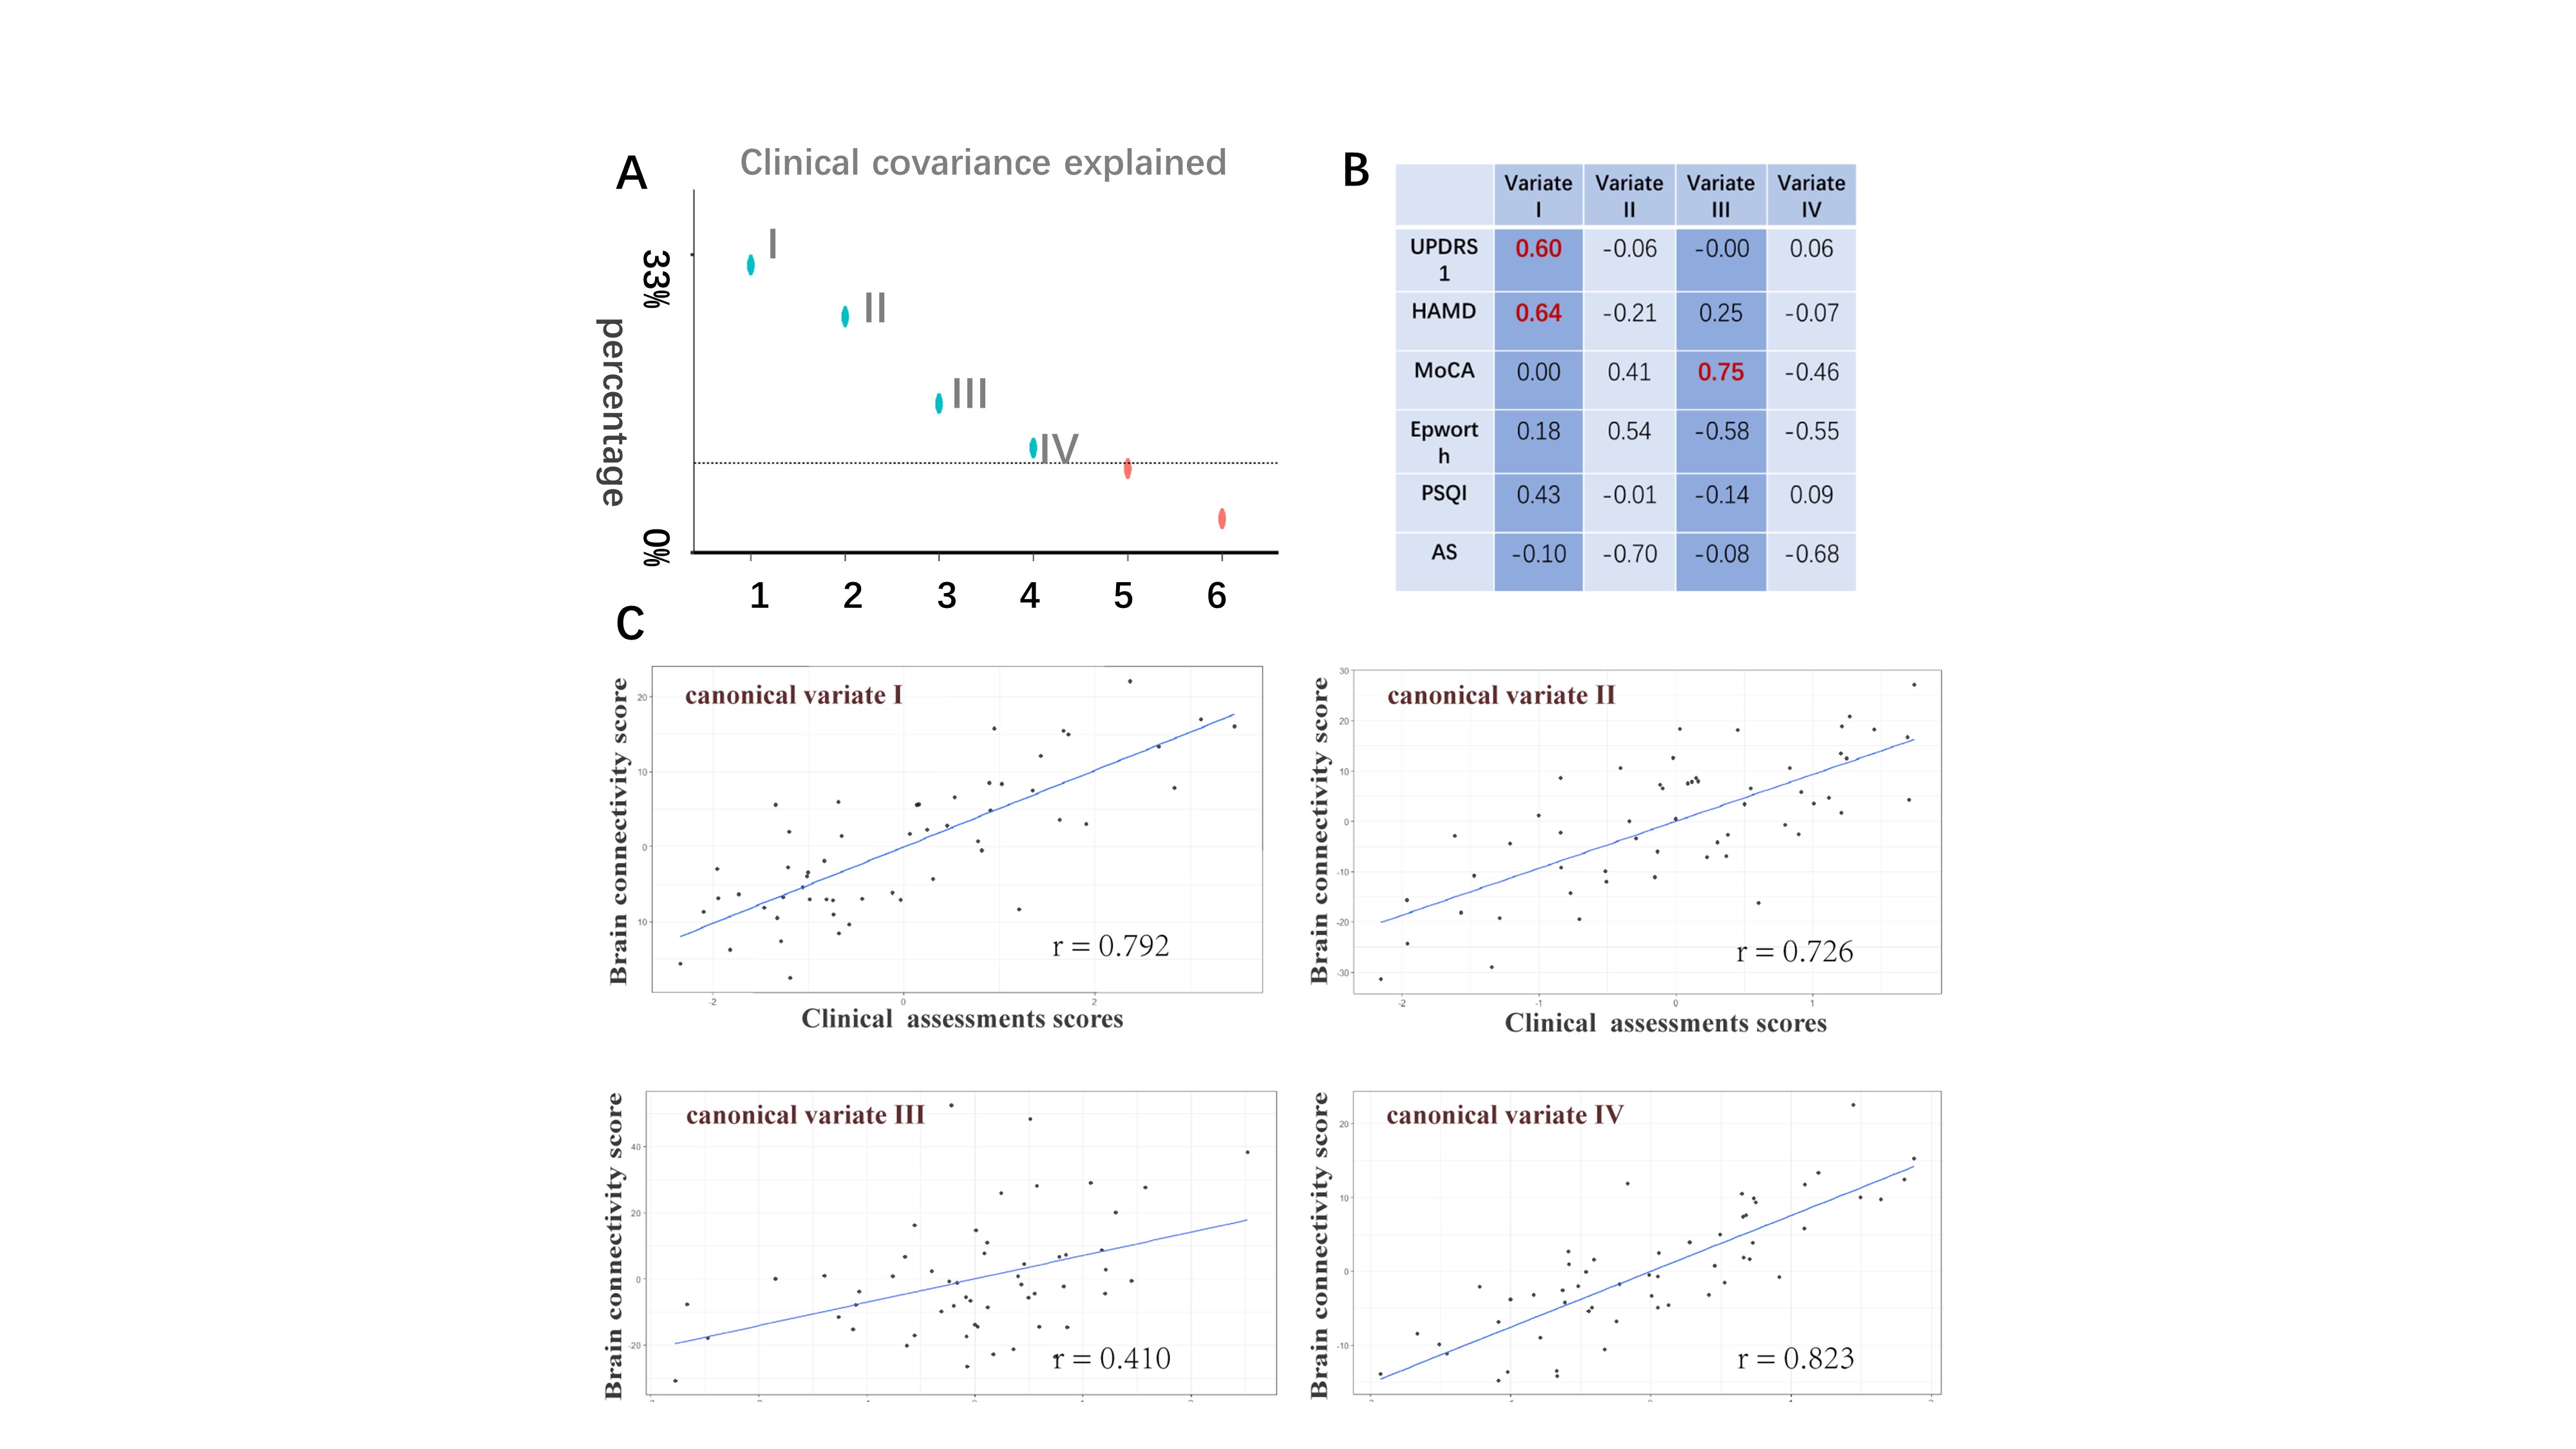
Figure1 The canonical variates obtained by sCCA, linking the non-motor characteristics and brain functional connectivity. A The scree plot of covariance explained. Dashed line marks the average covariance explained. B Loads of different assessments on the first four canonical variates. C The correlation between clinical assessments scores and brain connectivity scores under the first four variates (with statistical significance p < 0.05 by permutation test).
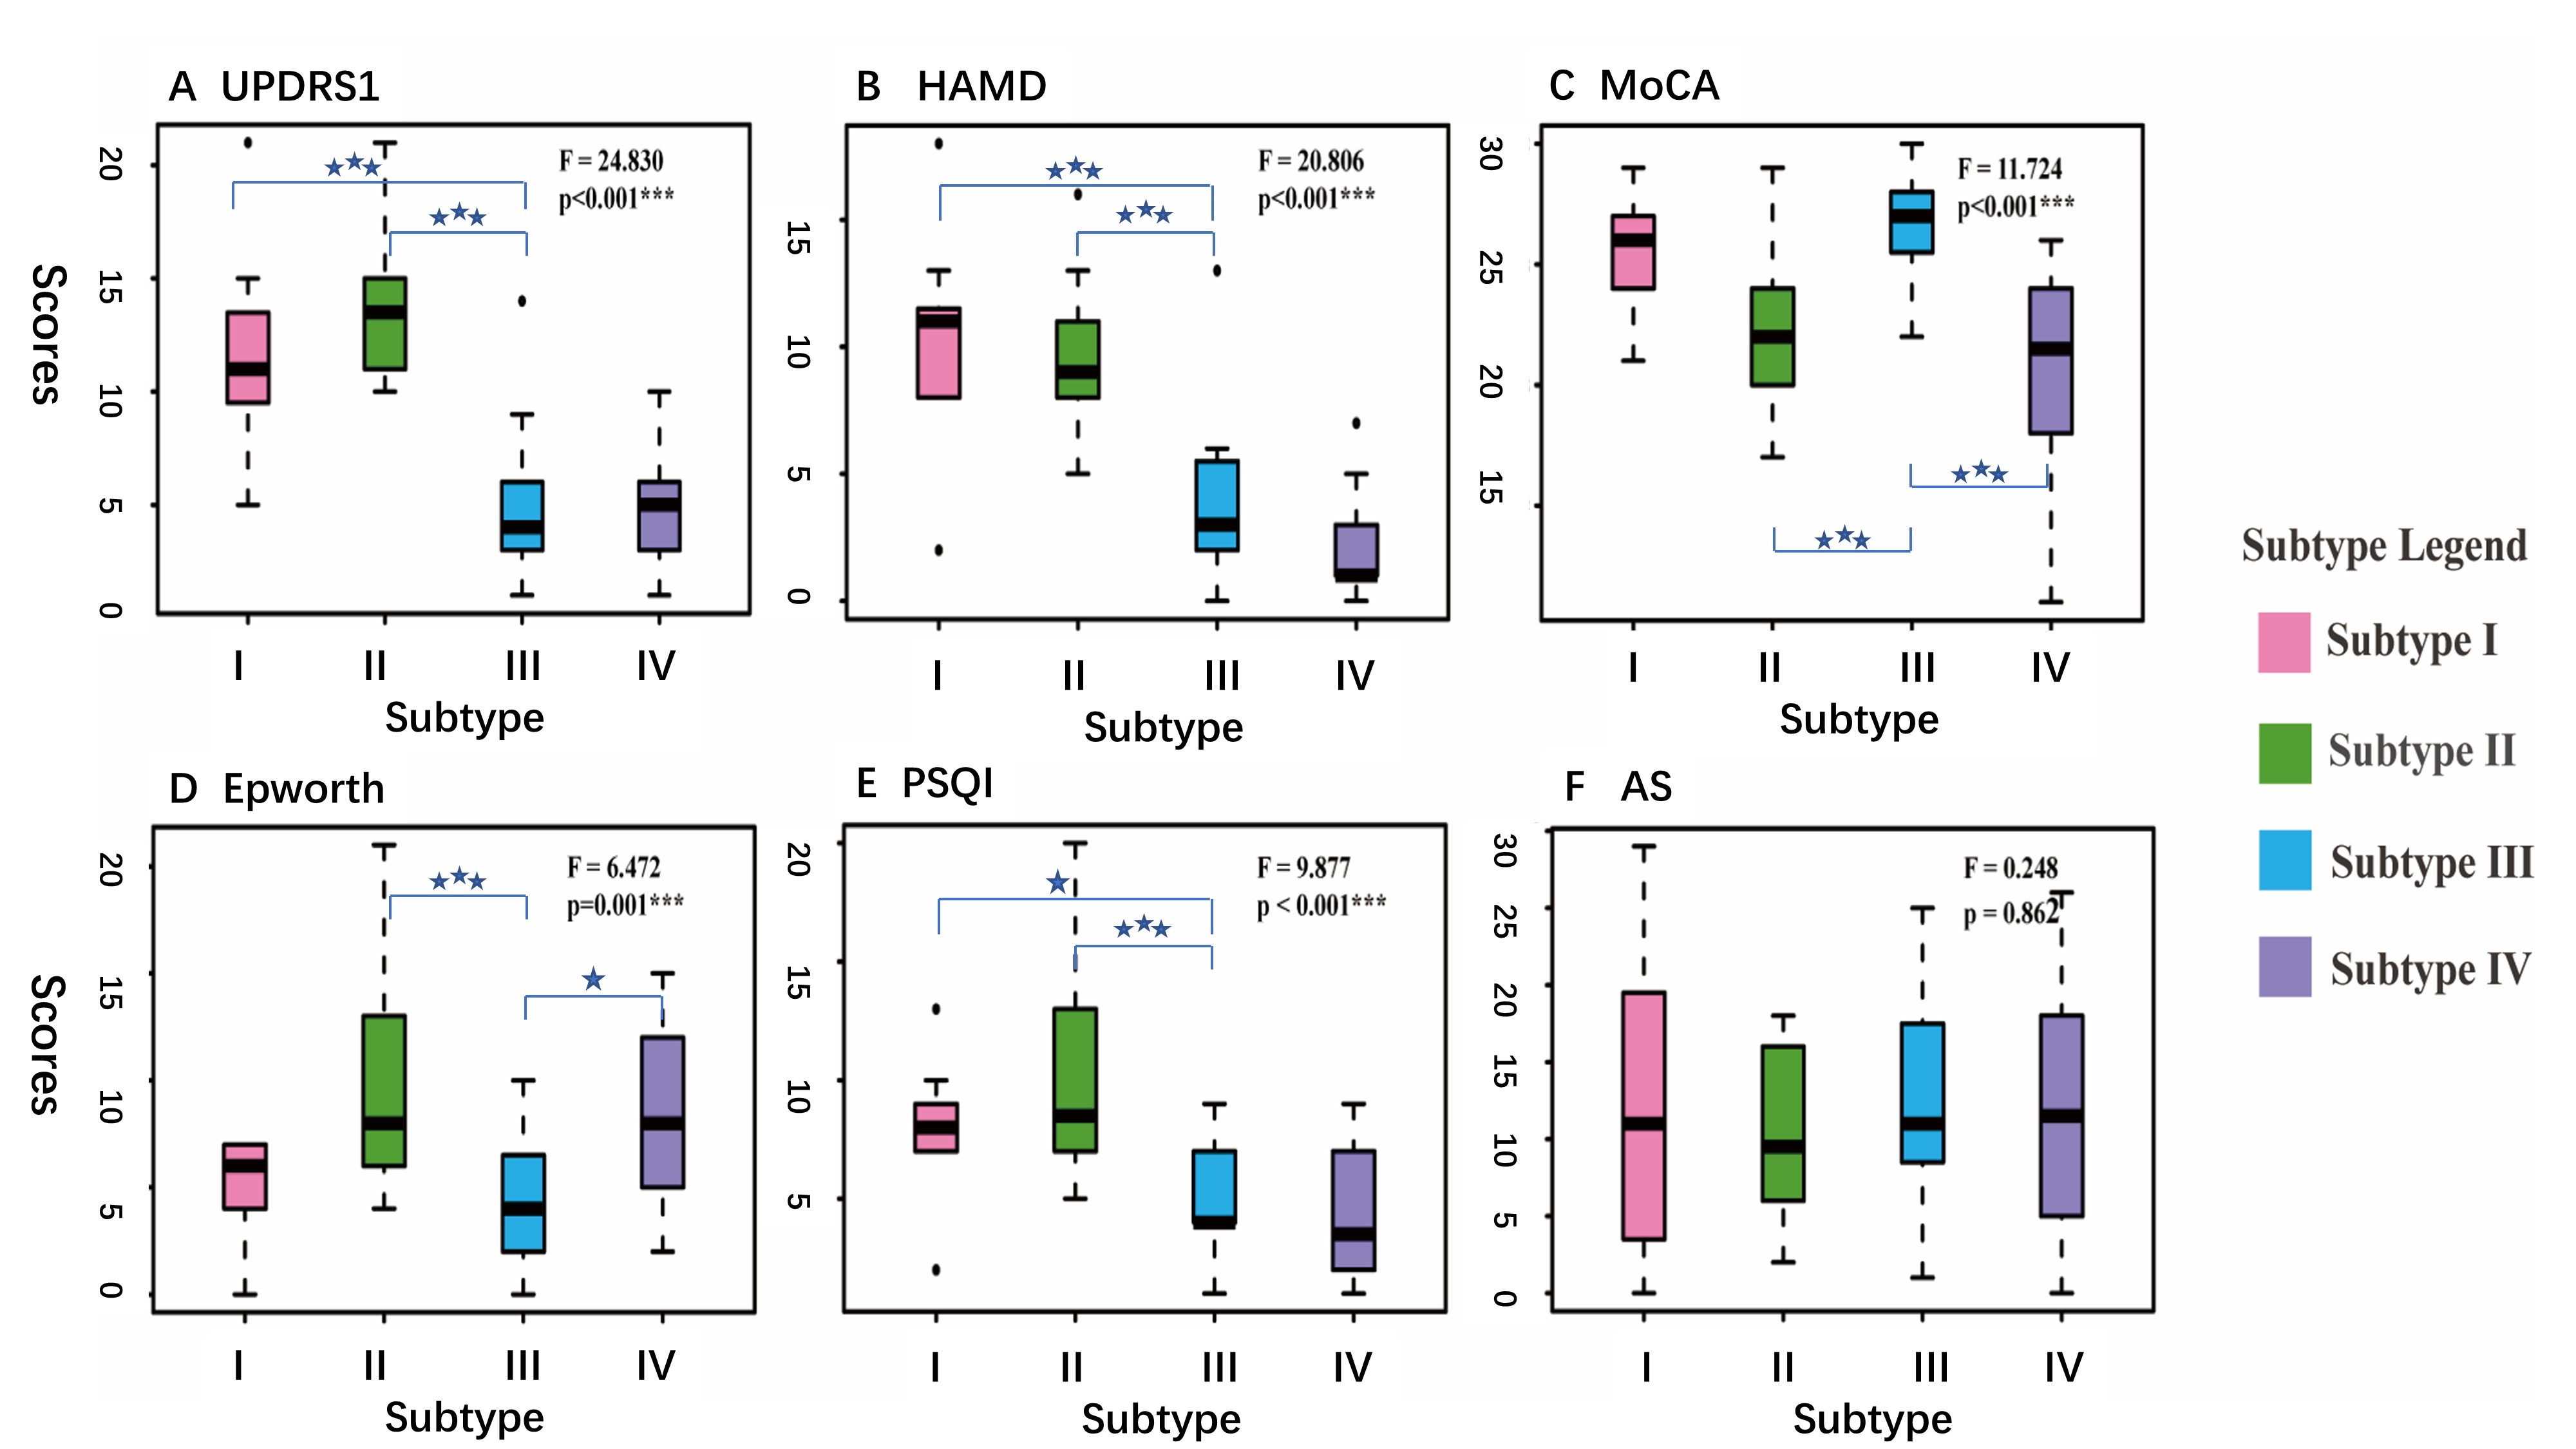
Figure2 Boxplots of clinical scores for four subtypes. ANOVA was conducted among the groups, with statistically significant differences ( p<0.001***) except for AS ( p = 0.862). Post-hoc test was performed between any two groups, and the blue stars reflected the statistical significance compared with subtype III (*** p<0.001, ** p<0.01, *p<0.05). Abbreviations: UPDRS1: Unified Parkinson’s Disease Rating Scale I, HAMD: Hamilton depression scale, MoCA: Montreal Cognitive Assessment, PSQI: Pittsburgh sleep quality index, AS: Autonomic Symptom.
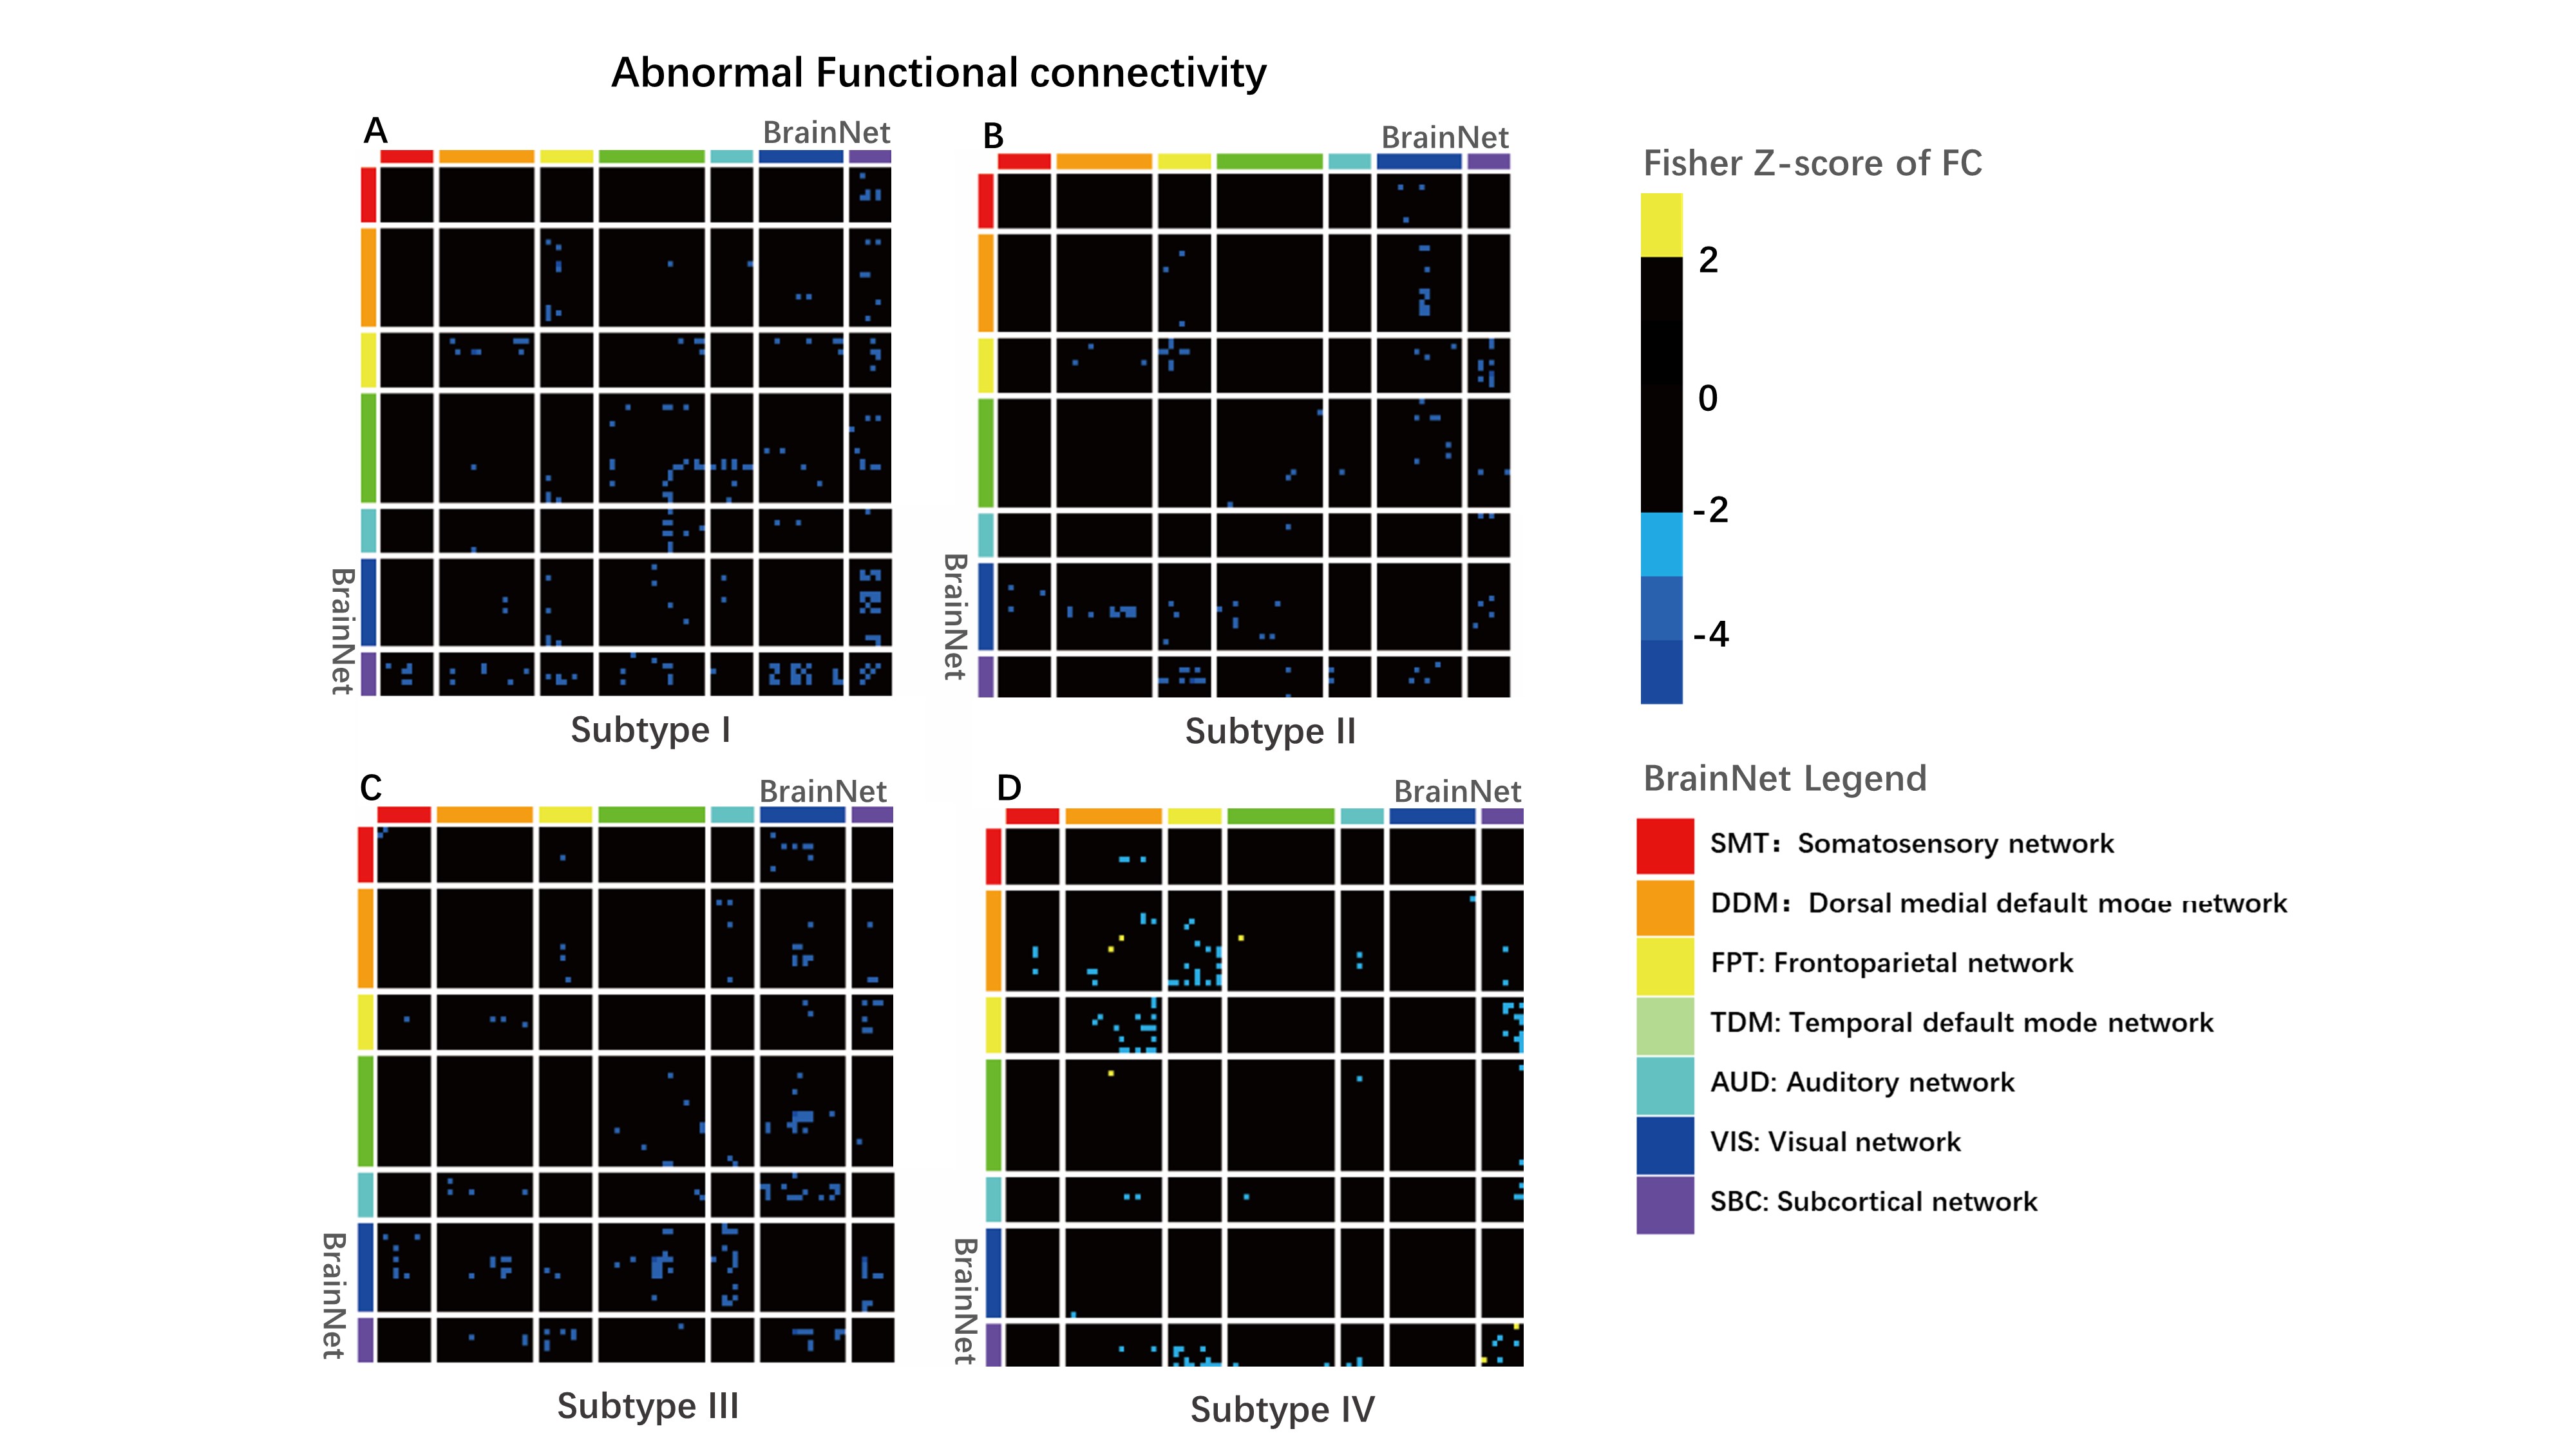
Figure3 Four subtypes of abnormal functional connectivity. For subtype I, II, III: two-sample T-tests with FDR correction was performed between each subtype and the HCs (PFDR < 0.05); for subtype IV: to get abnormal connectivity, just a two-sample T-test was conducted without FDR correction (P<0.05).
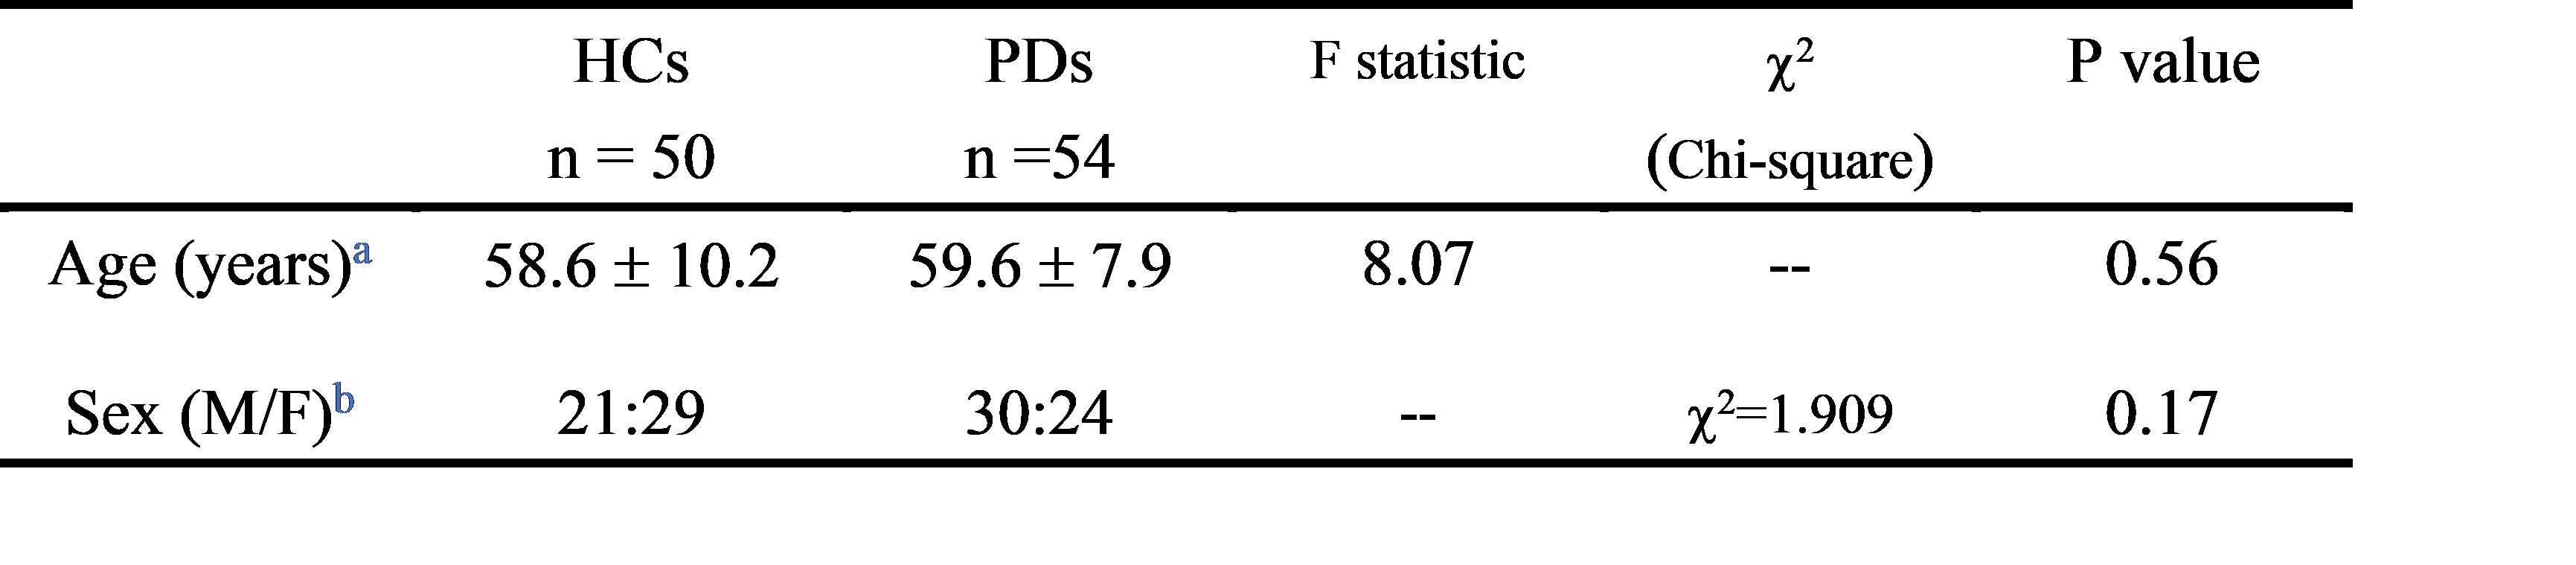
Table1 Demographic information
Abbreviations: PDs = Patients with Parkinson’s disease, HCs = Healthy control, M = Male, F = Female. a Two-sample T-test, b Chi-squared test
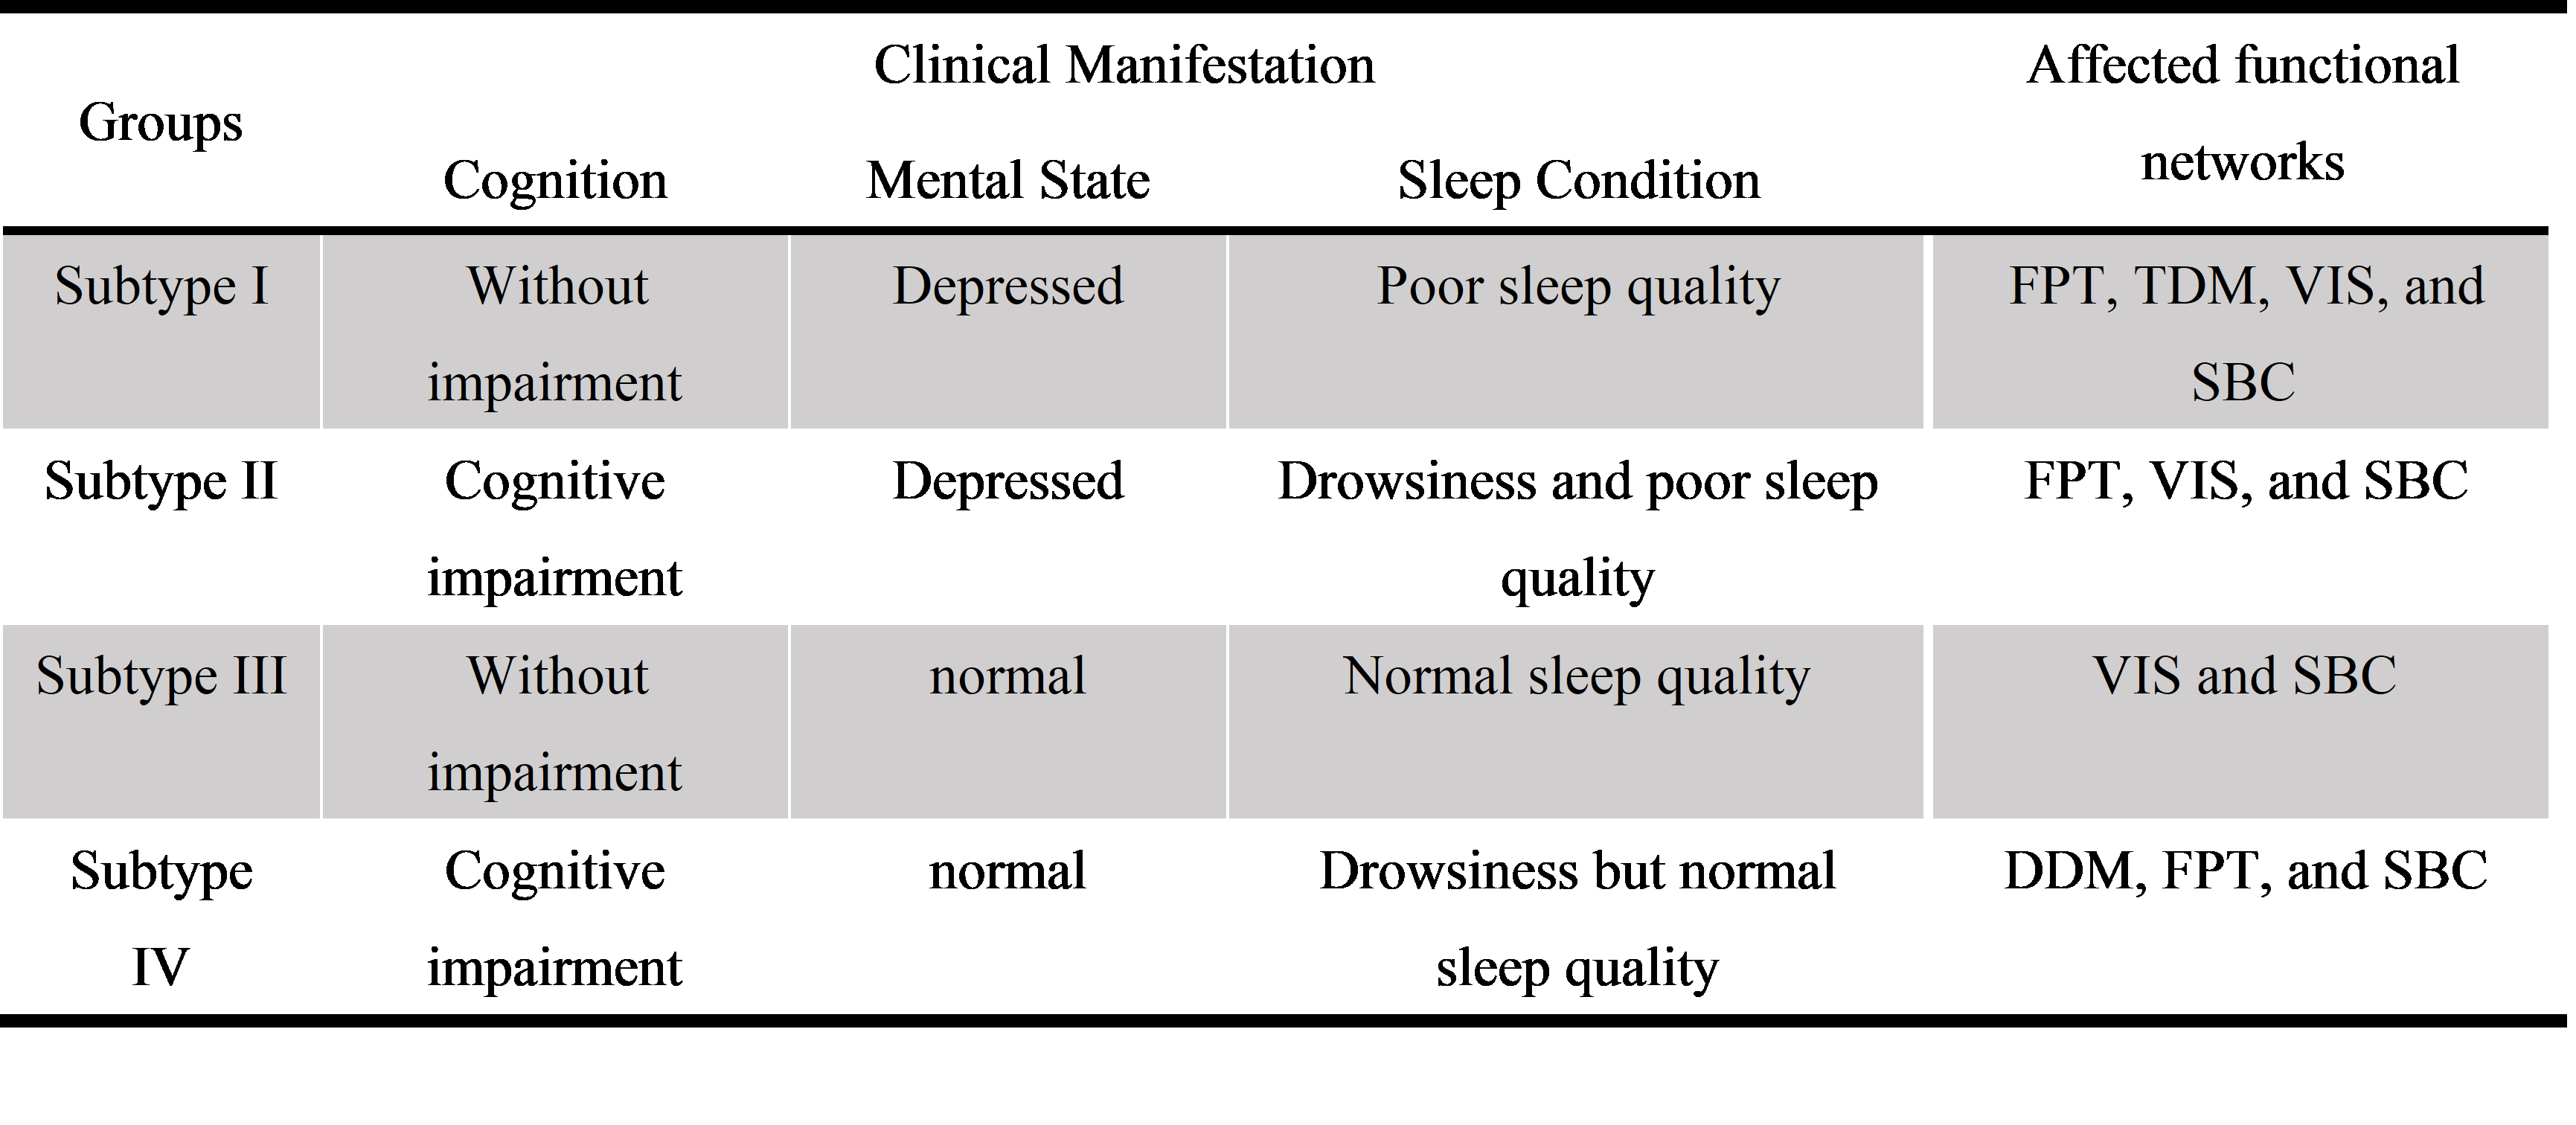
Table2 Clinical manifestations and affected functional networks of the four PD non-motor subtypes
Abbreviations: FPT: Frontoparictal network, TDM: Temporal default mode network, VIS: Visual network, SBC: Subcortical network.
DOI: https://doi.org/10.58530/2022/3803