3802
Morphological Characterization of Hepatic Steatosis Using Stereology and Spatial Statistics1School of Biomedical Engineering, Anhui Medical University, Heifei, China, 2Radiology, University of Wisconsin-Madison, Madison, WI, United States, 3Medical Physics, University of Wisconsin-Madison, Madison, WI, United States, 4Biomedical Engineering, University of Wisconsin-Madison, Madison, WI, United States, 5Medicine, University of Wisconsin-Madison, Madison, WI, United States, 6Emergency Medicine, University of Wisconsin-Madison, Madison, WI, United States
Synopsis
Monte Carlo modeling enables characterization of MR signals in various tissues, and has been applied to liver MR in the presence of fat. However, Monte Carlo modeling requires accurate information about the underlying tissue properties. In this work, we investigate the size and clustering of fat droplets in the liver using stereology and spatial statistics for three human liver biopsy samples with steatosis. Results show that the generalized gamma distribution function can accurately determine the size and location distributions of fat droplets. This may enable analysis of the underlying biophysical mechanisms between fat fraction and R2* from microscopic magnetic sensitivity.
Introduction
Previous studies have shown a positive correlation between proton density fat fraction (FF) and R2* in the liver 1, 2. The underlying biophysical mechanism was preliminarily validated by Monte Carlo simulation with simple assumptions3, 4. Shrestha et al. developed a Monte Carlo model by incorporating the plane morphological characterization of 16 mouse liver samples, however two-dimensional (2D) in-plane and two-dimensional (3D) volumetric distributions of fat droplets (FDs) may differ significantly4. Therefore, the purpose of this study was to quantitatively analyze FD distribution for human liver biopsy samples using three criteria: 1) size (i.e., radius) distribution in 2D and 3D space; 2) nearest neighbor distance distribution in 2D and 3D space; 3) regional anisotropy indicating inter-regional variability (i.e., clustering) in FF.Methods
After obtaining IRB approval and informed written consent as in the previous study5, histological analysis of hepatic steatosis for three human liver biopsy samples with various FFs (3.3%, 6.4% and 15.4%) was retrospectively performed. Each FD is approximated as sphere, and represented as circle in 2D tissue space. The radius and coordinate of FDs were obtained by Image Pro Plus 7.0 software (Media Cybernetics, Inc., Rockville, MD), and the following analysis was then implemented using Matlab R2016b (MathWorks, Natick, MA). Morphological features of hepatic steatosis with respect to size, nearest neighbor distance and regional anisotropy were characterized using a generalized gamma distribution function (GDF), as described next.1) 2D/3D size distribution: The 2D size histogram was directly generated based on the radius data. The 3D size distribution was obtained by sphere unfolding procedure based on the Scheil-Schwartz-Saltykov method6. Given a 2D radius histogram with number of bins m and frequency NA , the corresponding 3D approximate frequency NVcan be calculated by the following formula:
$$N_V(j)\,=\,\sum_{i=j}^{m} \,\alpha _{ji}\,N_A(i)$$
where i, j define the histogram bins (1, 2, 3, . . ., m) and αij can be obtained by the inverse of the matrix coefficients (kij):
$$k_{ji} =\sqrt{(j^{2}-(i-1)^2)} -\sqrt{j^2-i^2} $$
2) 2D/3D nearest neighbor distance distribution: To characterize the density and spacing of FDs using nearest neighbor distance, 2D nearest neighbor distance was calculated as the shortest distance of its center to the center of neighboring FDs, and 2D nearest neighbor distance histogram was then generated. The 3D nearest neighbor distance distribution cannot be directly calculated, and an indirect method was adopted. For given grid points of the 3D nearest neighbor distance GDF parameters in a given range, Monte Carlo models were simulated based on the distributions of 3D size and 3D nearest neighbor distance7. The optimal nearest neighbor distance GDF parameters were determined by comparing the random 2D section of the model with real 2D nearest neighbor distance GDF parameters.
3) Regional anisotropy: The heterogeneous accumulation (“clustering”) of FDs in different regions of a liver biopsy sample was characterized using regional anisotropy. Liver biopsy samples were gridded into 200μm side square regions (approximately the size of 10 hepatocytes), and regional anisotropy was quantified by calculating the FF within each region and normalizing it by the maximum FF for all squares.
The generalized GDF was used to model distributions of FD size and nearest neighbor distance, as well as regional anisotropy, which can be formulated as:
$$GDF\,(x)\,=\,\frac{1}{\beta \times \Gamma \,(\gamma )}\times \left ( \left ( \frac{x}{\beta }\right )^{\left ( \gamma - 1 \right ) }\times exp\left ( -\frac{x}{\beta } \right ) \right )$$
where β and γ are positive scale and shape parameters, x>0. Γ(γ) is defined as :
$$\Gamma \,\left ( \gamma \right )\,=\,\int_{0}^{\infty}\,x^{\gamma -1}\,e^{-x} \mathrm{d}x $$
Results
The FD radius for the three representative liver biopsy ranged from 4.09 to 42.65 μm with an average of 9.27 ± 3.95 μm. The nearest neighbor distance for FDs ranges from 10.57 to 271.66 μm with an average of 32.08 ± 17.62 μm. Figure 1 shows three representative liver samples with FF of 3.3%, 6.4% and 15.4%, respectively. With increasing FF, FDs are visibly distributed in a non-uniform (clustering) manner.The 2D and 3D fitting curves from histogram of size and nearest neighbor distance are shown in Figure 2 and 3. Results indicated that radius and nearest neighbor distance have a similar distribution pattern and can be well described by the GDF. Figure 4 represents the fitting curve of regional anisotropy. For high FF, the right-shifted histogram peaks indicate increased regions with more FDs. The estimated parameters with respect to FD size, nearest neighbor distance and regional anisotropy based on the GDF are shown in Table 1.
Discussion/Conclusions
In this study, we quantitatively analyze FD size and nearest neighbor distance for 2D in-plane and 3D volumetric distributions, as well as regional anisotropy in three liver biopsy samples with different FFs. Our results show that these distributions can be well characterized by the generalized gamma distribution function. The FD distribution (e.g. size, non-uniform clustered deposition) can induce local B0 field inhomogeneity that may affect R2* value. This study has several limitations, including absence of small FDs in biopsy sample due to technique, and no analysis of biopsy samples with higher FF. Future work is also needed to calibrate the relationship between FF and R2* based on Monte Carlo simulation by incorporating FD distribution. Moreover, the proposed method may also be applicable to other intracellular particles such as hemosiderin deposition.Acknowledgements
We acknowledge the support of BSKY Research Grant from Anhui Medical University (XJ201811), Anhui Provincial Natural Science Foundation (2008085QH425), National Natural Science Foundation of China (62001005), National Institutes of Health (K24 DK102595, R01DK100651, R01 DK088925, R01 DK083380)
References
1. Hernando D, Haufe W, Hooker C, et al. Relationship between liver proton density fat fraction and R2* in the absence of iron overload. In Proceedings of the 23rd Annual Meeting of ISMRM, Toronto, Canada, 2015. p.4118.
2. Karlsson M, Ekstedt M, Dahlstrom N, et al. Liver R2* is affected by both iron and fat: A dual biopsy-validated study of chronic liver disease. J Magn Reson Imaging. 2019; 50(1): 325-333.
3. Wang C, Reeder S B, Hernando D. Monte Carlo Modeling of Liver MR Signal in the Presence of Fat. In Proceedings of the 25th Annual Meeting of ISMRM, Hawaii, United States, 2017. p.2264.
4. Shrestha U, Van Der Merwe M, Kumar N, et al. Morphological characterization of hepatic steatosis and Monte Carlo modeling of MRI signal for accurate quantification of fat fraction and relaxivity. NMR Biomed. 2021; 34(6): e4489.
5. Ratli B A, Hernando D, Wiens C, et al. Liver Biopsy Analysis to Determine Fat Droplet Distribution. In Proceedings of the 25th Annual Meeting of ISMRM, Hawaii, United States. 2017. p.1467.
6. Chiu S N, Stoyan D, Kendall W S, et al. Stochastic geometry and its applications. John Wiley & Sons; 2013. 430-432
7. Ghugre N R, Gonzalez-Gomez I, Shimada H, et al. Quantitative analysis and modelling of hepatic iron stores using stereology and spatial statistics. J Microsc, 2010; 238(3): 265-274.
Figures
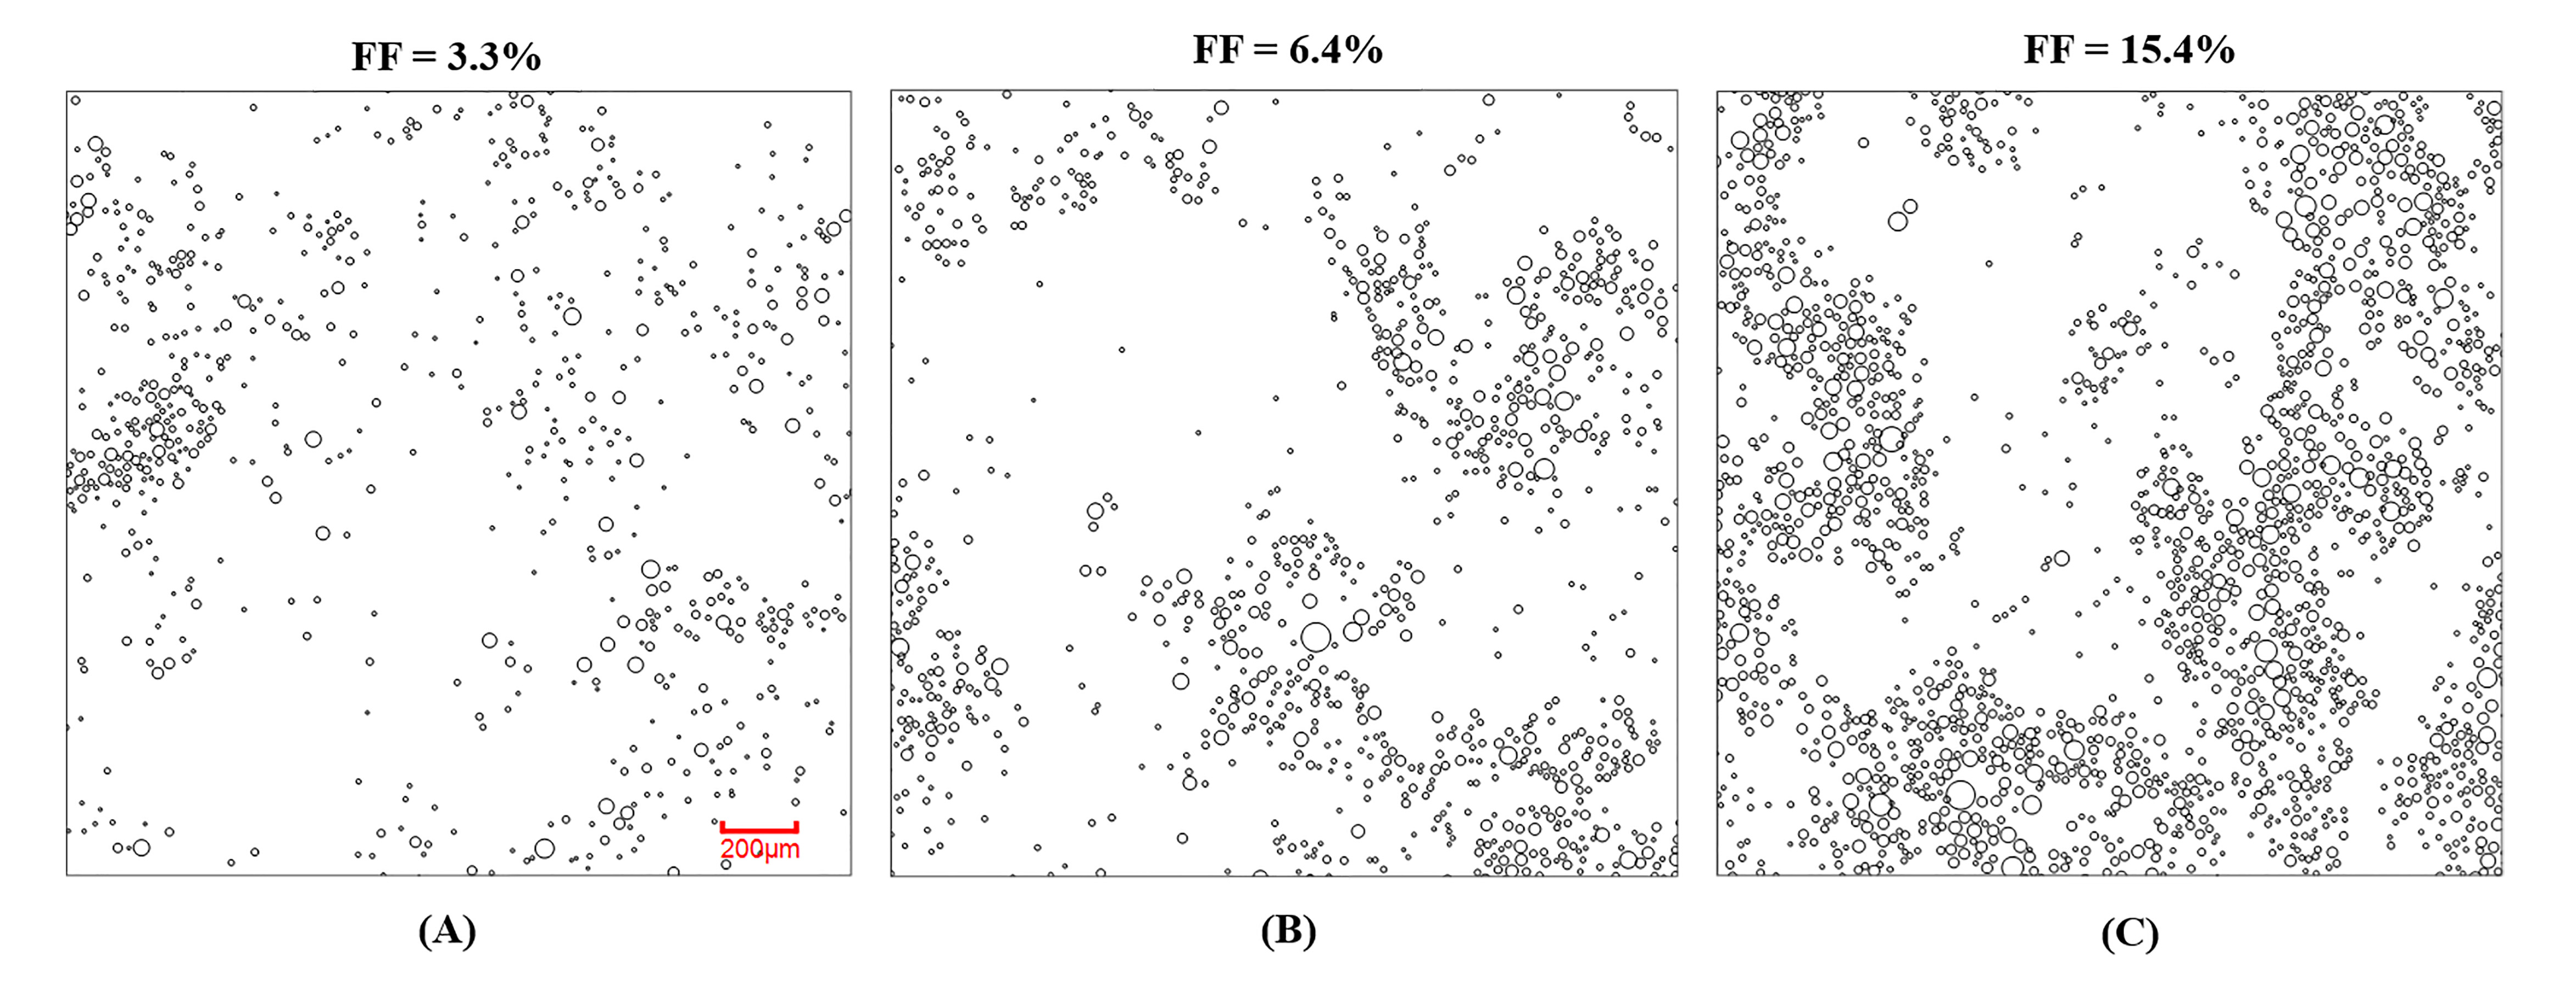
Figure 1. Three representative liver biopsy samples with FDs of 3.3% (A), 6.4% (B) and 15.4% (C). Each FD is approximated as a sphere, and represented as a circle in 2D tissue space. With increasing FF, FDs are visibly distributed in a non-uniform clustered manner.
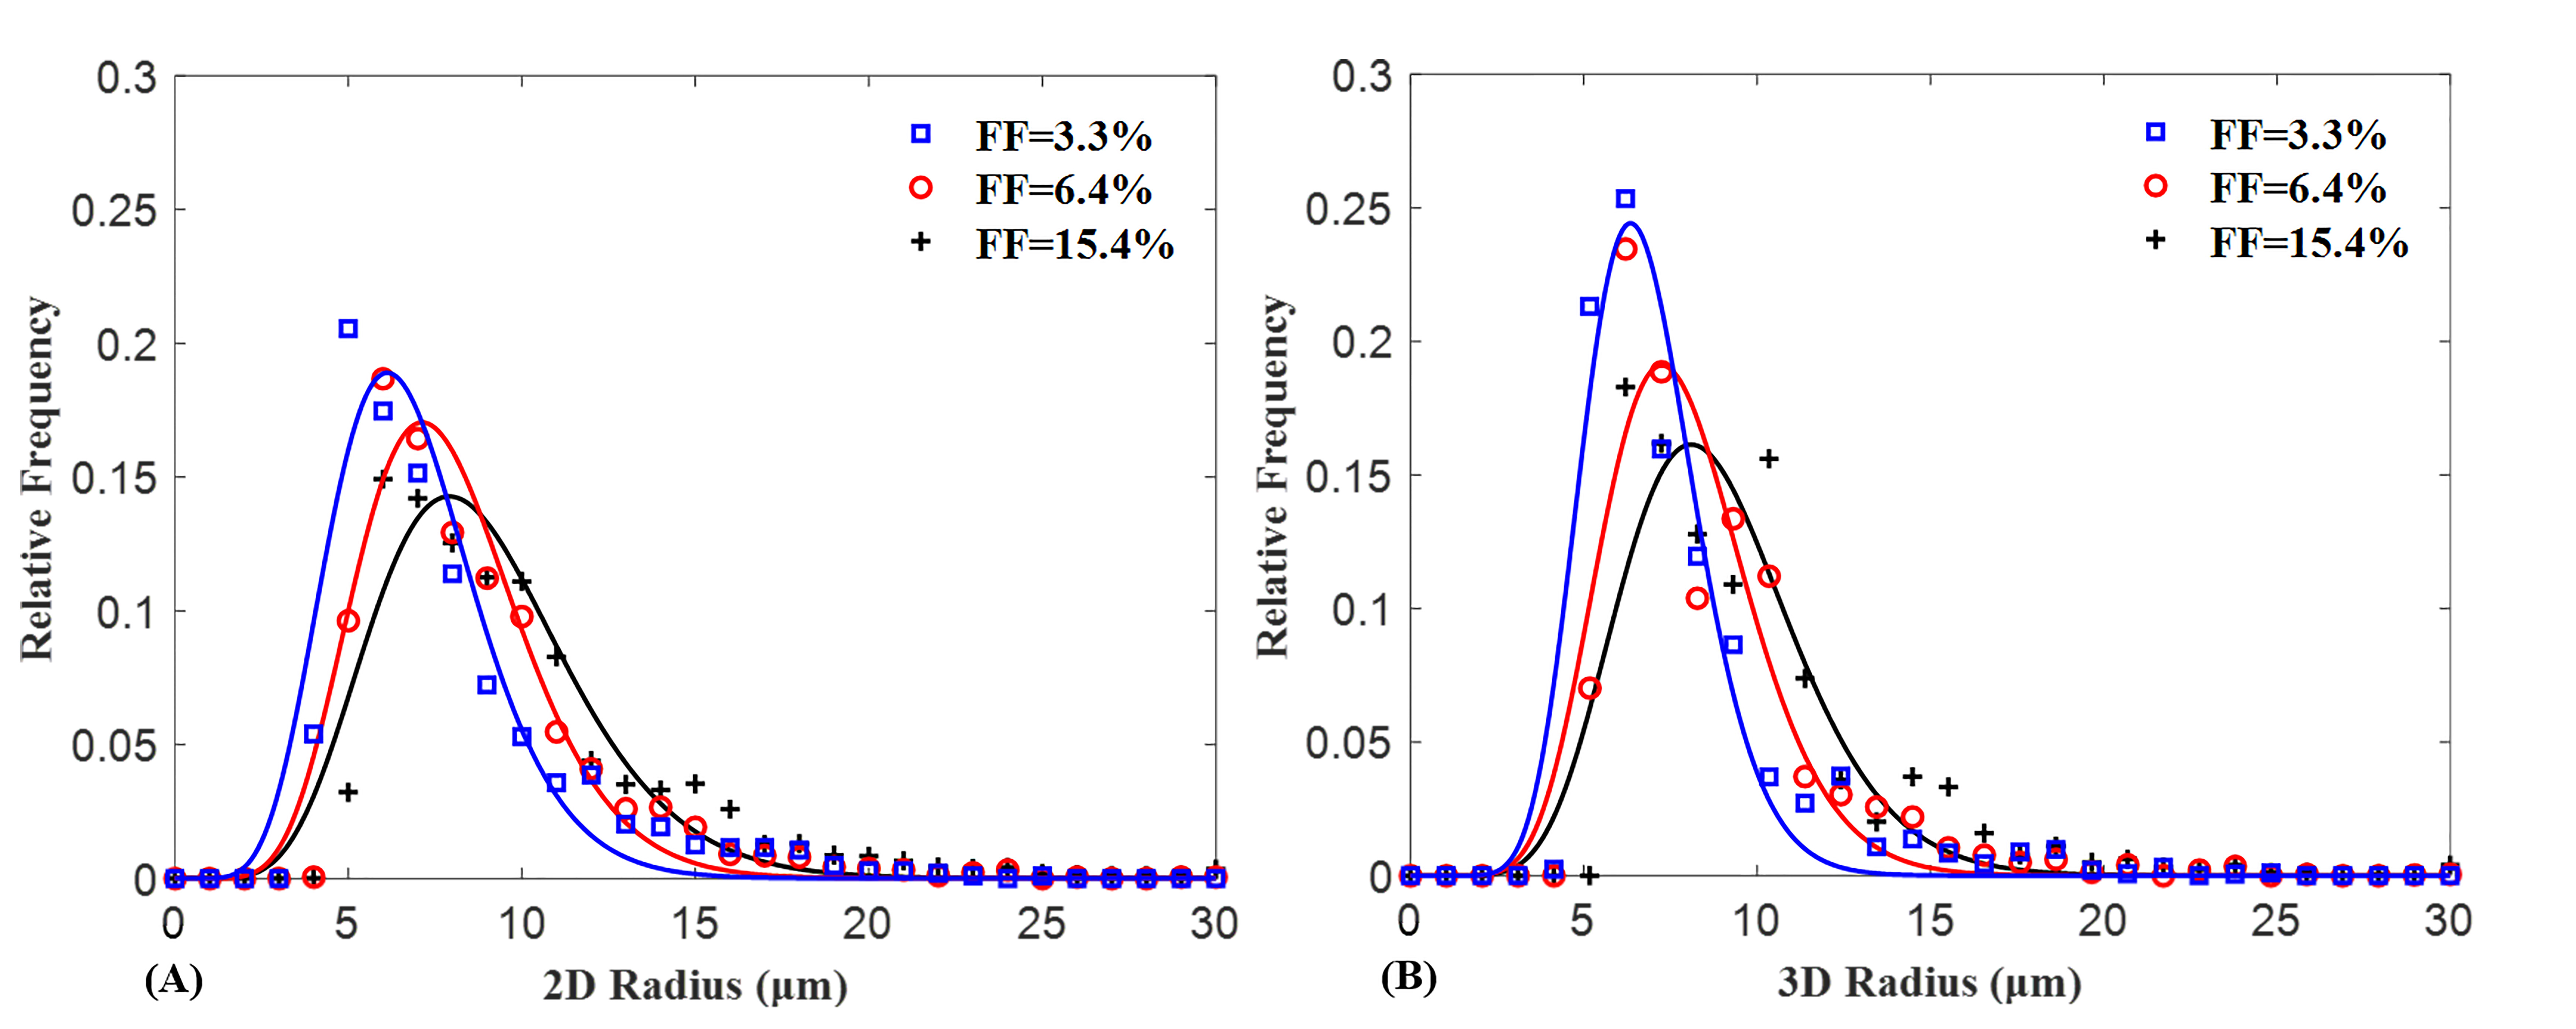
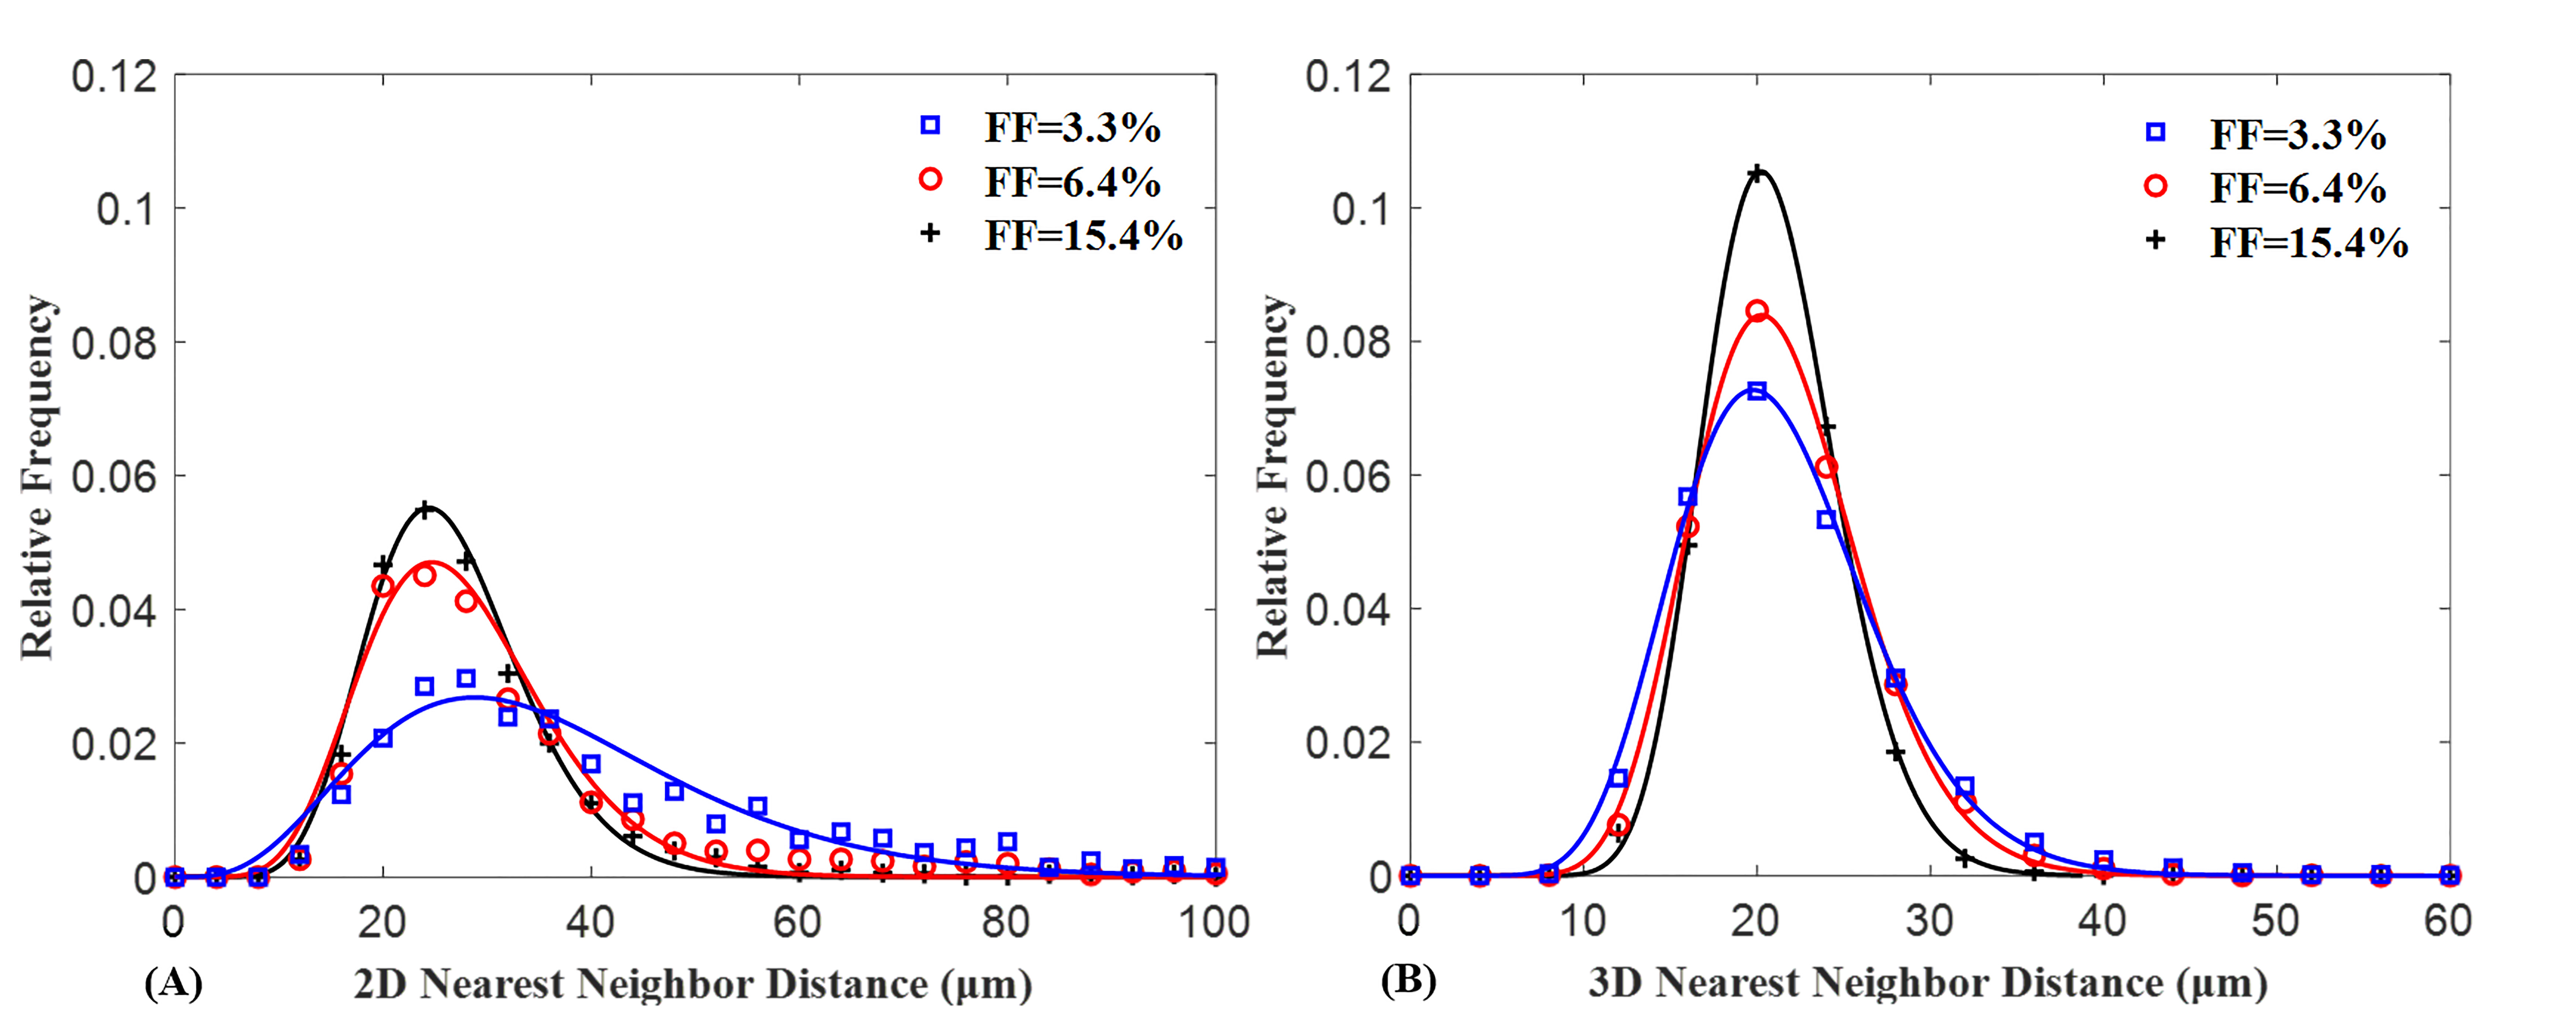
Figure 3. Distribution of FD nearest neighbor distance in 2D (A) and 3D (B) space for the three representative liver biopsy samples. Based on generalized GDF curve fitting, it was demonstrated that nearest neighbor distance histogram in 2D and 3D space can be well described by the generalized GDF. Compared with 2D situations, the left-shifted peak and narrow distribution in 3D space indicate that the FDs are distributed densely.
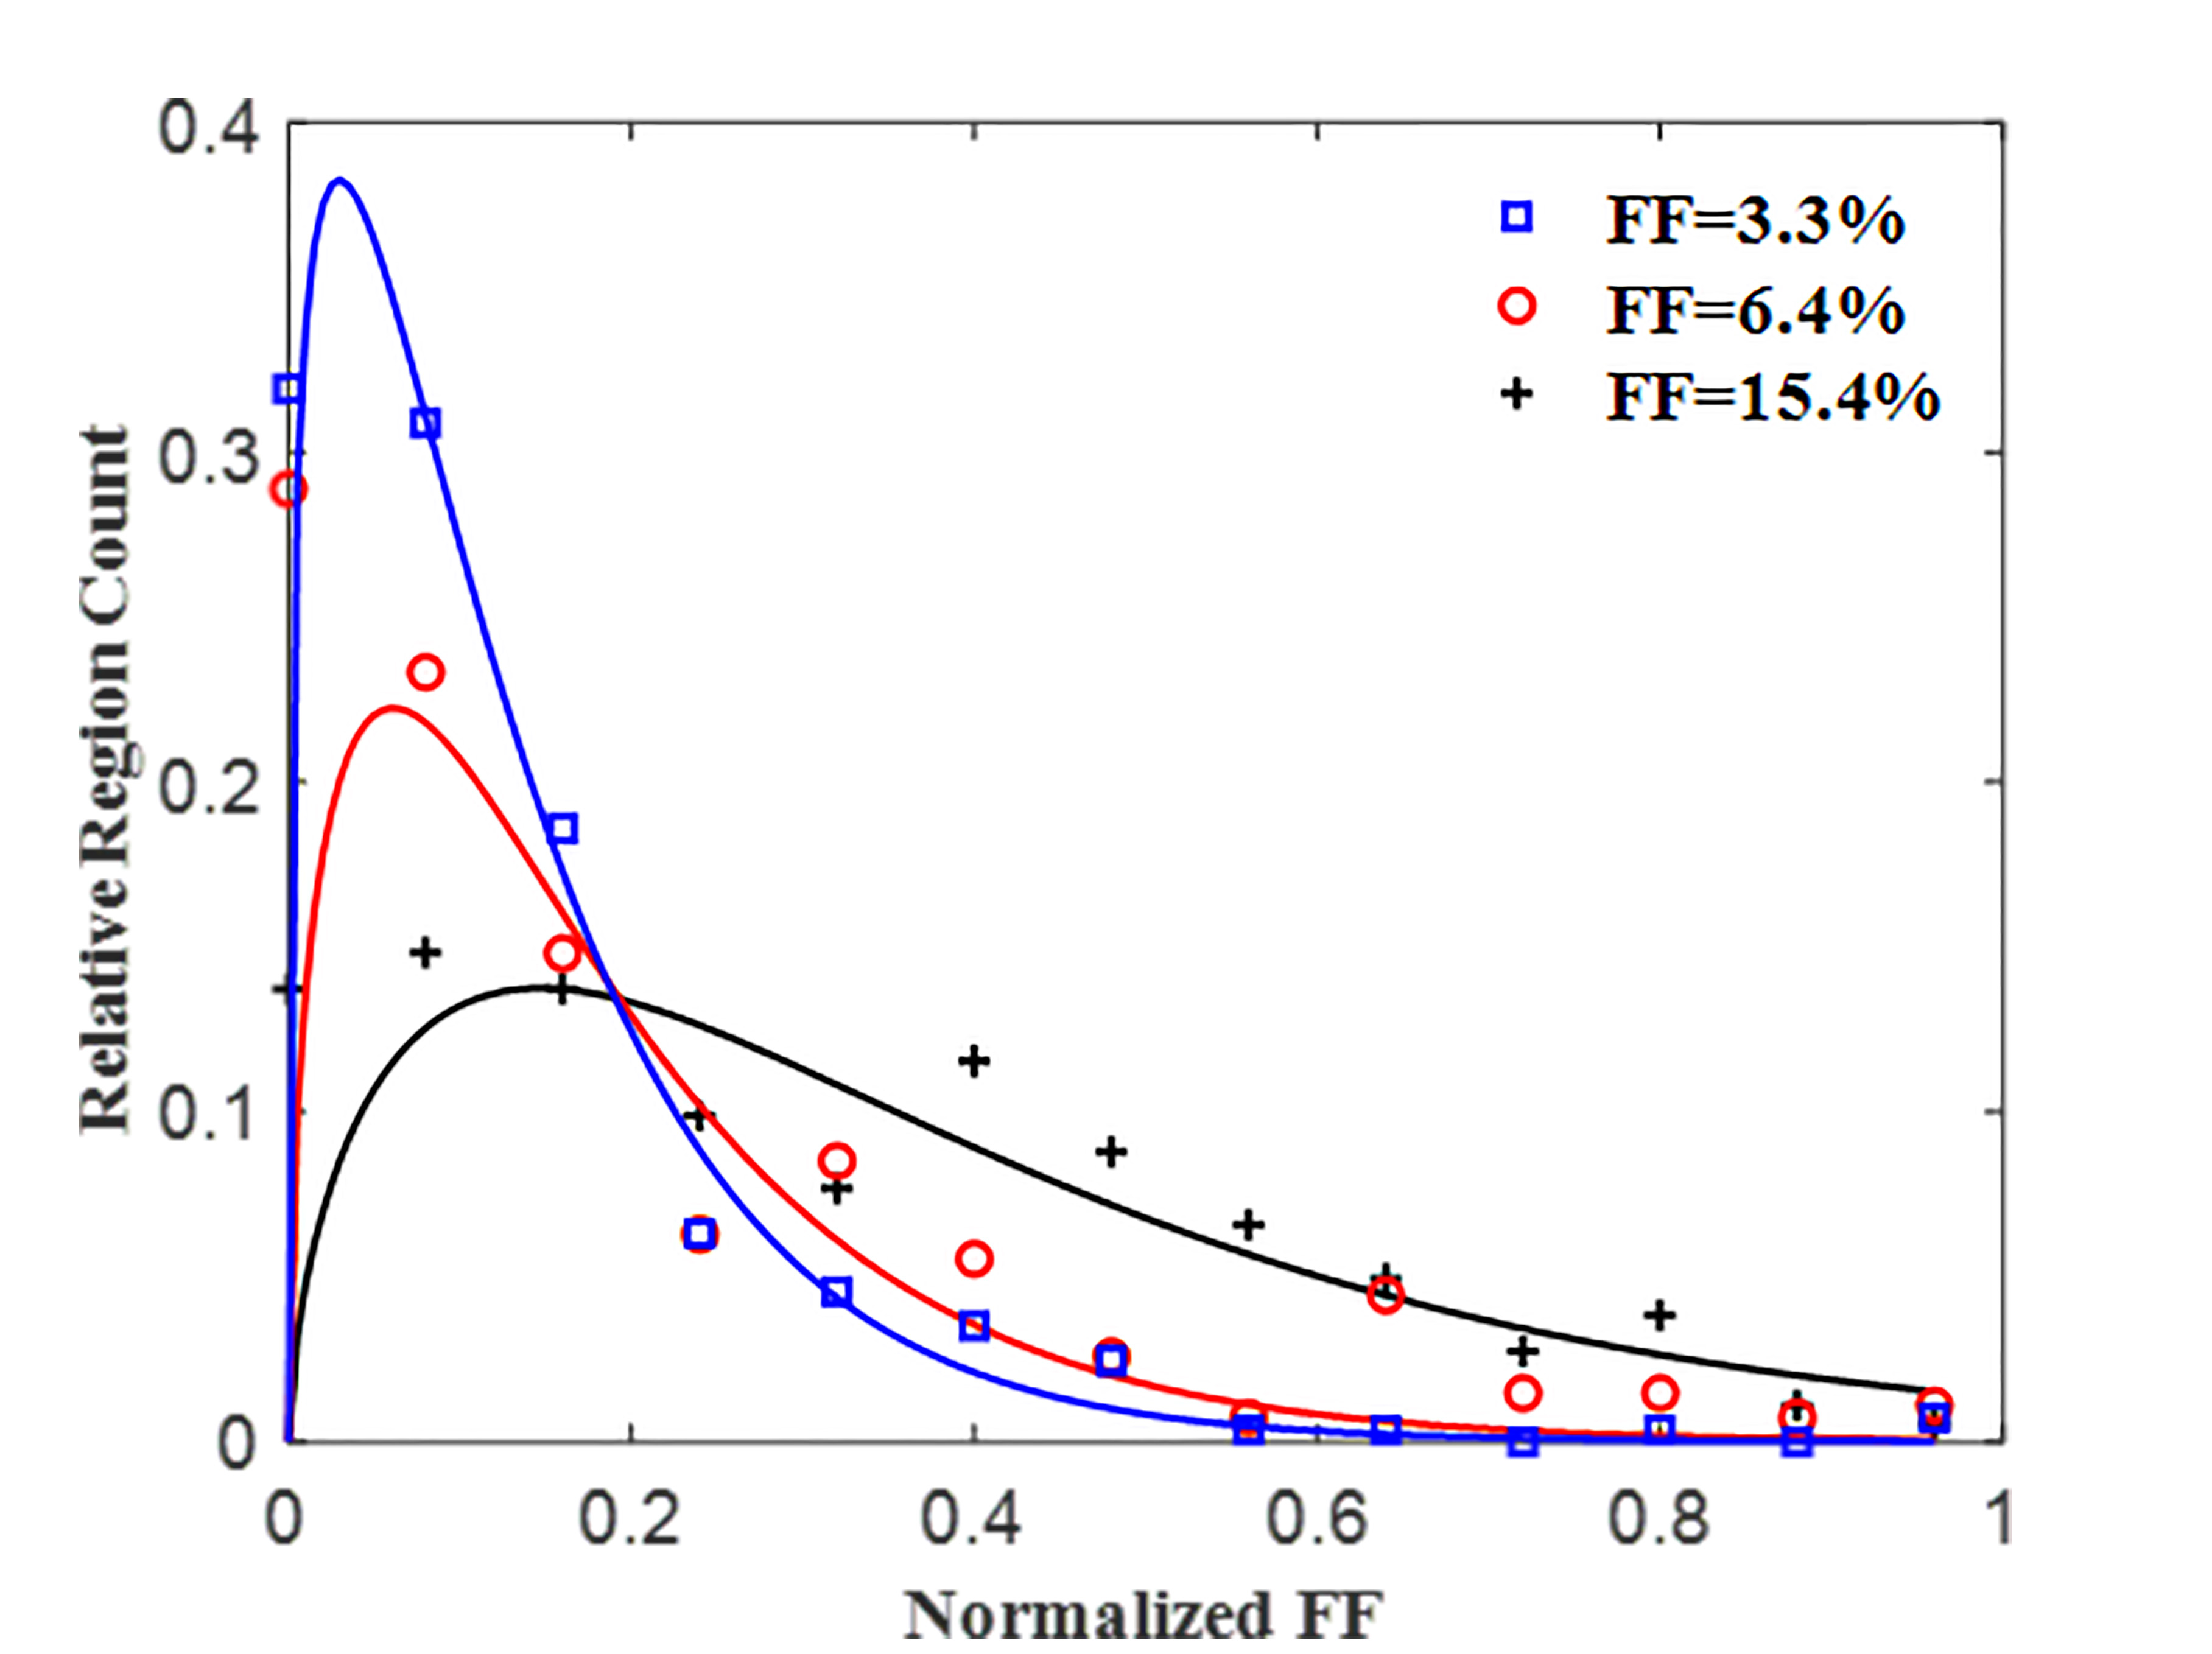
Figure 4. Regional anisotropy of FD deposition for the three representative liver biopsy samples. For high FD, the right-shifted histogram peaks indicate increased regions with more FDs (clustering).
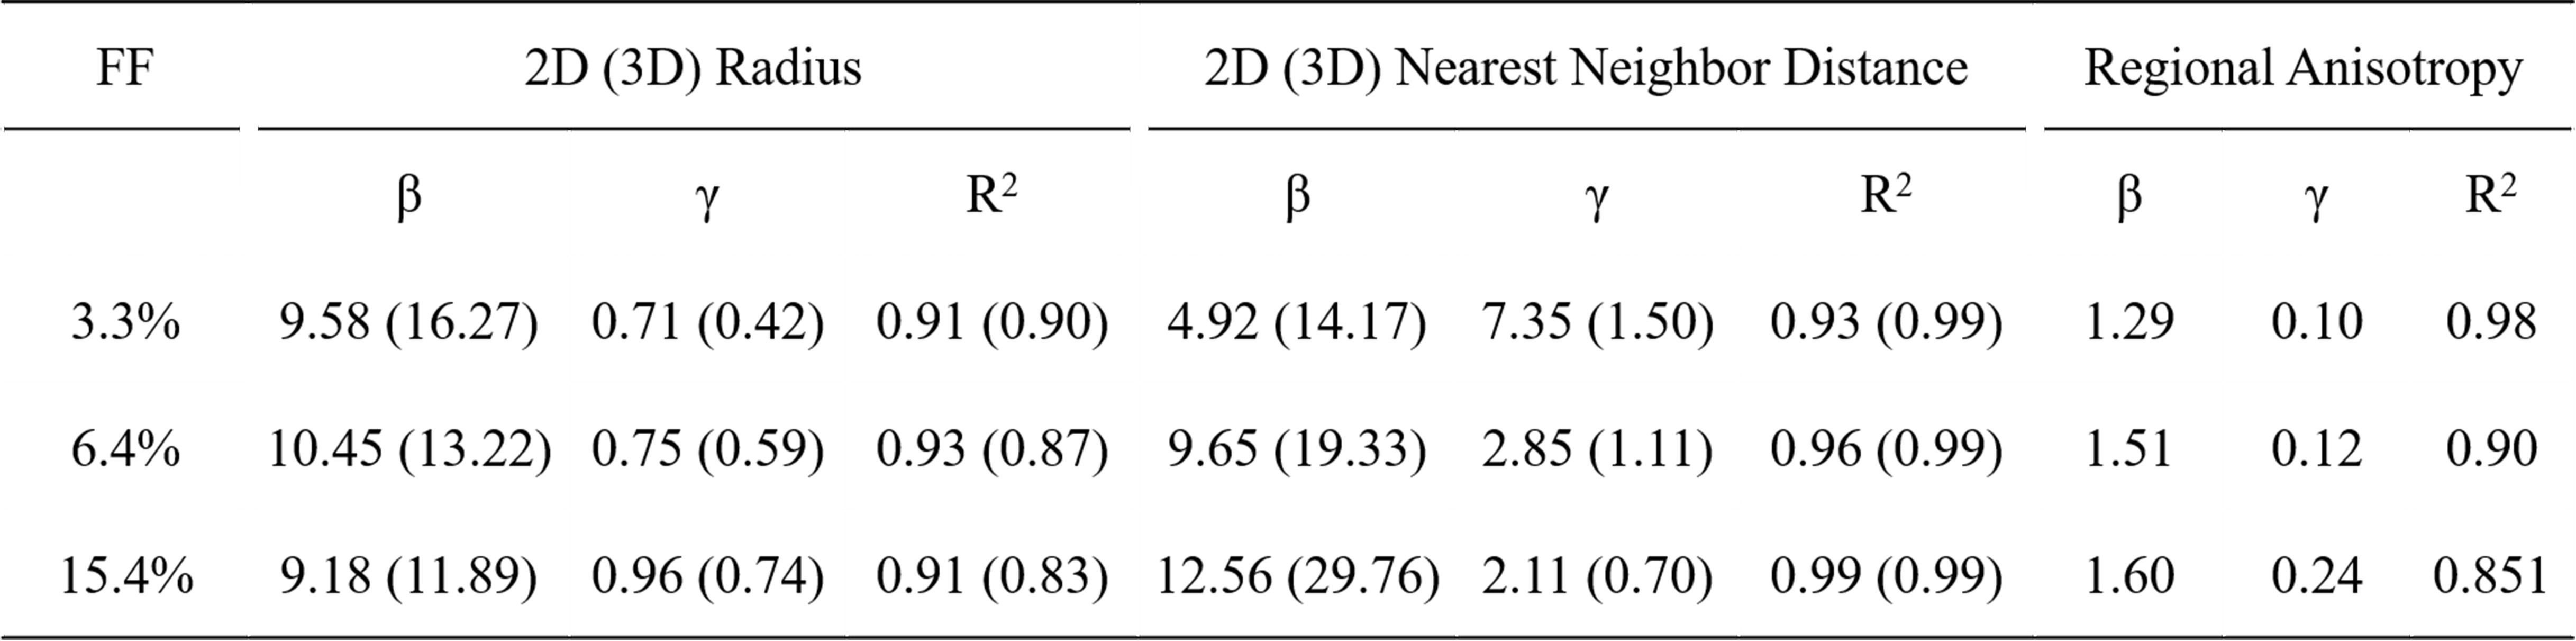
Table1. Estimated parameters with respect to FD size, nearest neighbor distance and regional anisotropy based on the generalized GDF.