3799
What happens “when one door is half closed, another does not open yet” for the unilateral sudden sensorineural hearing loss patients1Tangdu Hospital, Fourth Military Medical University, Xi'an, China, 2GE Healthcare, MR Research China, Beijing, Beijing, China
Synopsis
Featured alterations in dynamic brain functions, neurovascular coupling, or brain structure occurs at early-, intermediate- or late-stage of unilateral sudden sensorineural hearing loss (SSNHL) “when one door is half closed, another does not open yet”, respectively, and may serve as the neuroimaging markers for SSNHL.
Introduction
A partial cross-modal plasticity establishes after long time single sided deafness, i.e., “when one door is half closed, another opens to some extent”. Our object is to explore the whether there is cross-modal plasticity and what happens in the human brain of patients along with the disease development of unilateral sudden sensorineural hearing loss (SSNHL) “when one door is half closed, another does not open yet”Methods
SSNHL patients were enrolled according to hearing loss at least 30 dB in three sequential frequencies in the standard pure-tone audiogram (PTA) in less than 3 days and were divided into three subgroups (early-, intermediate- or late- stage). Then, we used functional magnetic resonance imaging (fMRI), three-dimensional arterial spin labeling (3D-ASL) and three-dimensional brain volume (3D-BRAVO) magnetic resonance (MR) scanning to explore alteration of different periods in SSNHL.Results
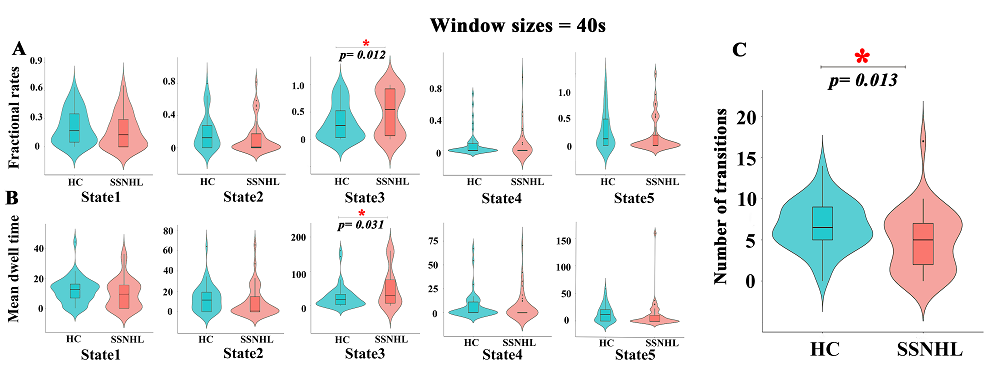
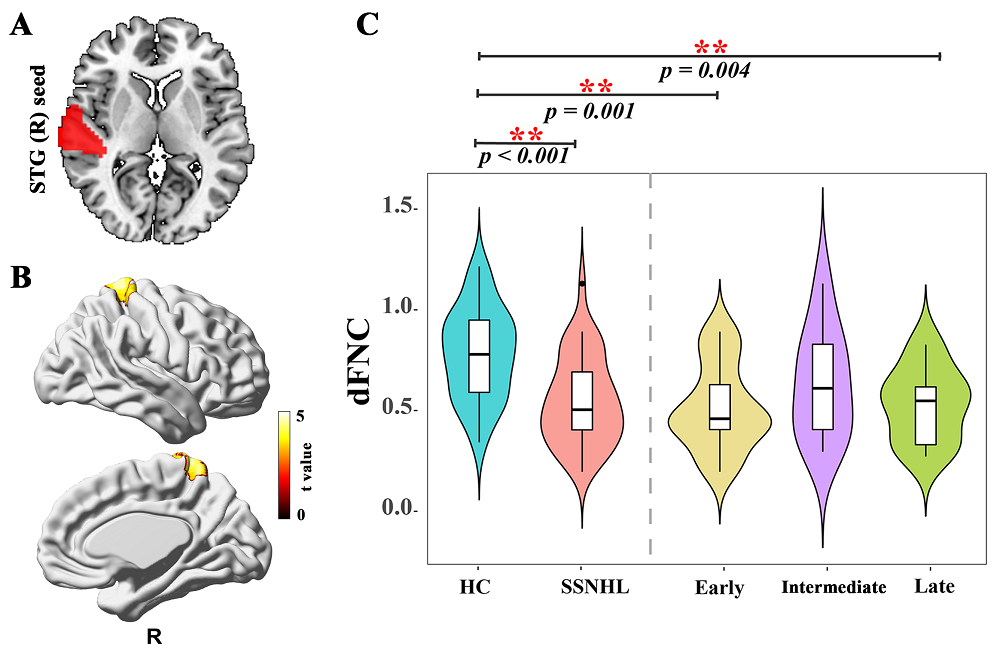
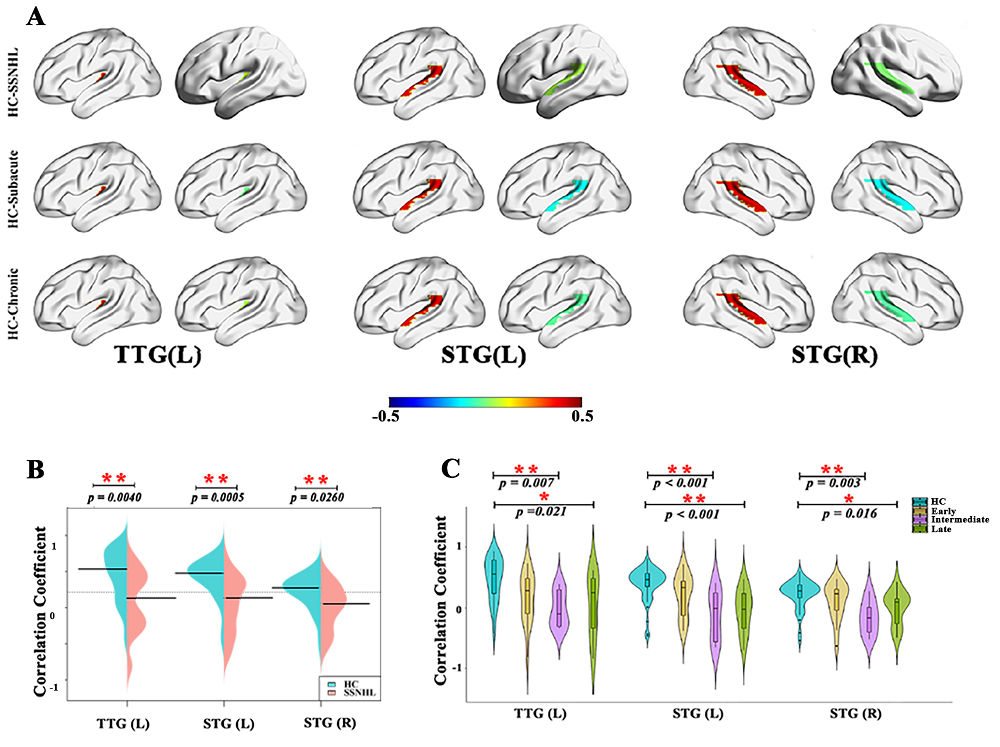
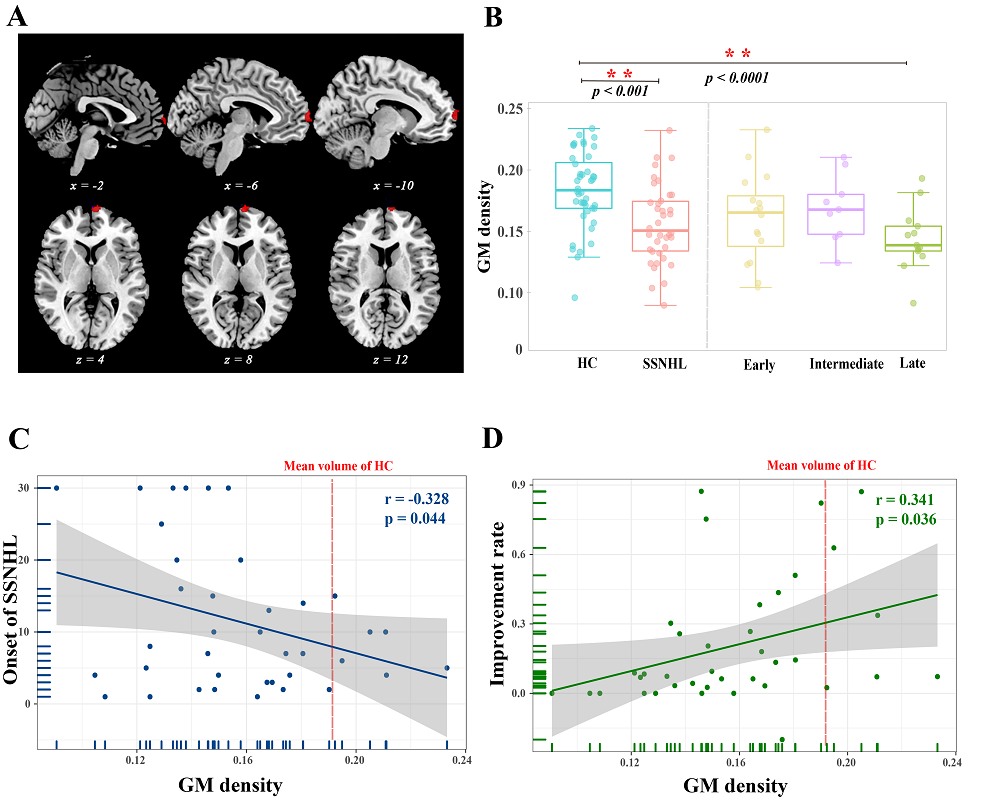
38 SSNHL patients and 44 health controls were enrolled. We first identified low number of transitions (NT) between varied dynamic functional network connectivity (dFNC) states (Fig. 1) and decreased connectivity between the right superior temporal gyrus (STG) and right Precuneus gyrus/ right Postcentral gyrus occurs at the early-stage SSNHL (Fig. 2). We then revealed the decreased neurovascular coupling (NVC) occurs restricted to the primary auditory cortex (left transverse temporal gyrus (TTG) and bilateral superior temporal gyrus (STG)) at the intermediate- and late-stage SSNHL (Fig. 3). These dFNC and NVC analyses advocated that cross-modal plasticity less likely occurred at the early- or intermediate-stage SSNHL. Furthermore, a significant volume decrease in right orbital part of the superior frontal gyrus (ORBsup) was observed only in the late-stage SSNHL cohort (Fig. 4A and 4B), suggesting a partial cross-modal plasticity in the emotional response occurred. Finally, only the volume of right ORBsup is robustly correlated with both disease stage and patient prognosis (Fig. 4C and 4D).Conclusion
Our study supported the brain change occurred first within the AUD and gradually develop cross-modal plasticity along with the short-, intermediate- and late-stage SSNHL. These findings explain why short-stage SSNHL patients are with better therapeutic responses and hearing recovery. Our study shed light on potential of being translated to the clinic set to identify early-stage SSNHL patients and predict the prognosis of SSNHL patients.Acknowledgements
The authors would like to thank Drs. Wu-Xun Cui, Si-Jie Xiu, from Department of Radiology of Tangdu Hospital, as well as Dr. Xiao-Cheng Wei from MR Research China of GE Healthcare for their outstanding technique support. Our gratitude also goes for Profs. Jin-Lian Li, Liang-Wei Chen and Jun-Ling Zhu from Department of Radiology of Tangdu Hospital for their constructive comments for this project.References
1. Dewey RS, Hartley DE: Cortical cross-modal plasticity following deafness measured using functional near-infrared spectroscopy. Hear Res 2015, 325:55-63.
2. Qiao Y, Li X, Shen H, Zhang .X, Sun Y, Hao W, Guo B, Ni D, Gao Z, Guo H et al: Downward cross-modal plasticity in single-sided deafness. NeuroImage 2019, 197:608-617.
3. Benetti S, van Ackeren MJ, Rabini G, Zonca J, Foa V, Baruffaldi F, Rezk M, Pavani F, Rossion B, Collignon O: Functional selectivity for face processing in the temporal voice area of early deaf individuals. Proceedings of the National Academy of Sciences of the United States of America 2017, 114(31):E6437-E6446.
4. Benetti S, Zonca J, Ferrari A, Rezk M, Rabini G, Collignon O: Visual motion processing recruits regions selective for auditory motion in early deaf individuals. NeuroImage 2021, 230:117816.
5. Hribar M, Suput D, Battelino S, Vovk A: Review article: Structural brain alterations in prelingually deaf. NeuroImage 2020, 220:117042.
6. Benetti S, Novello L, Maffei C, Rabini G, Jovicich J, Collignon O: White matter connectivity between occipital and temporal regions involved in face and voice processing in hearing and early deaf individuals. NeuroImage 2018, 179:263-274.
7. Kral A, Kronenberger WG, Pisoni DB, O'Donoghue GM: Neurocognitive factors in sensory restoration of early deafness: a connectome model. Lancet Neurol 2016, 15(6):610-621.
Figures